Outlook Summary
- ENSO neutral conditions continued during September 2019, with sea surface temperatures (SSTs) near average for the time of year in the central equatorial Pacific.
- The Southern Oscillation Index (SOI) was -1.3 during September, an indication that the atmosphere was still responding to a residual warm pool of water in the west-central Pacific.
- Oceanic ENSO neutral will most likely continue (60% chance) over the next three months.
- During September, New Zealand’s coastal sea temperatures were cooler than average for all regions for the first time since 2017. This is expected to influence air temperatures during the October-December period.
- A strongly positive Indian Ocean Dipole event is expected to influence New Zealand’s climate over the next three months.
- For October to December, air pressure is forecast to be lower than normal in the New Zealand region, especially south of the country. This is expected to be associated with a westerly quarter air flow anomaly, particularly during November and December. Occasional easterly quarter winds are possible during October.
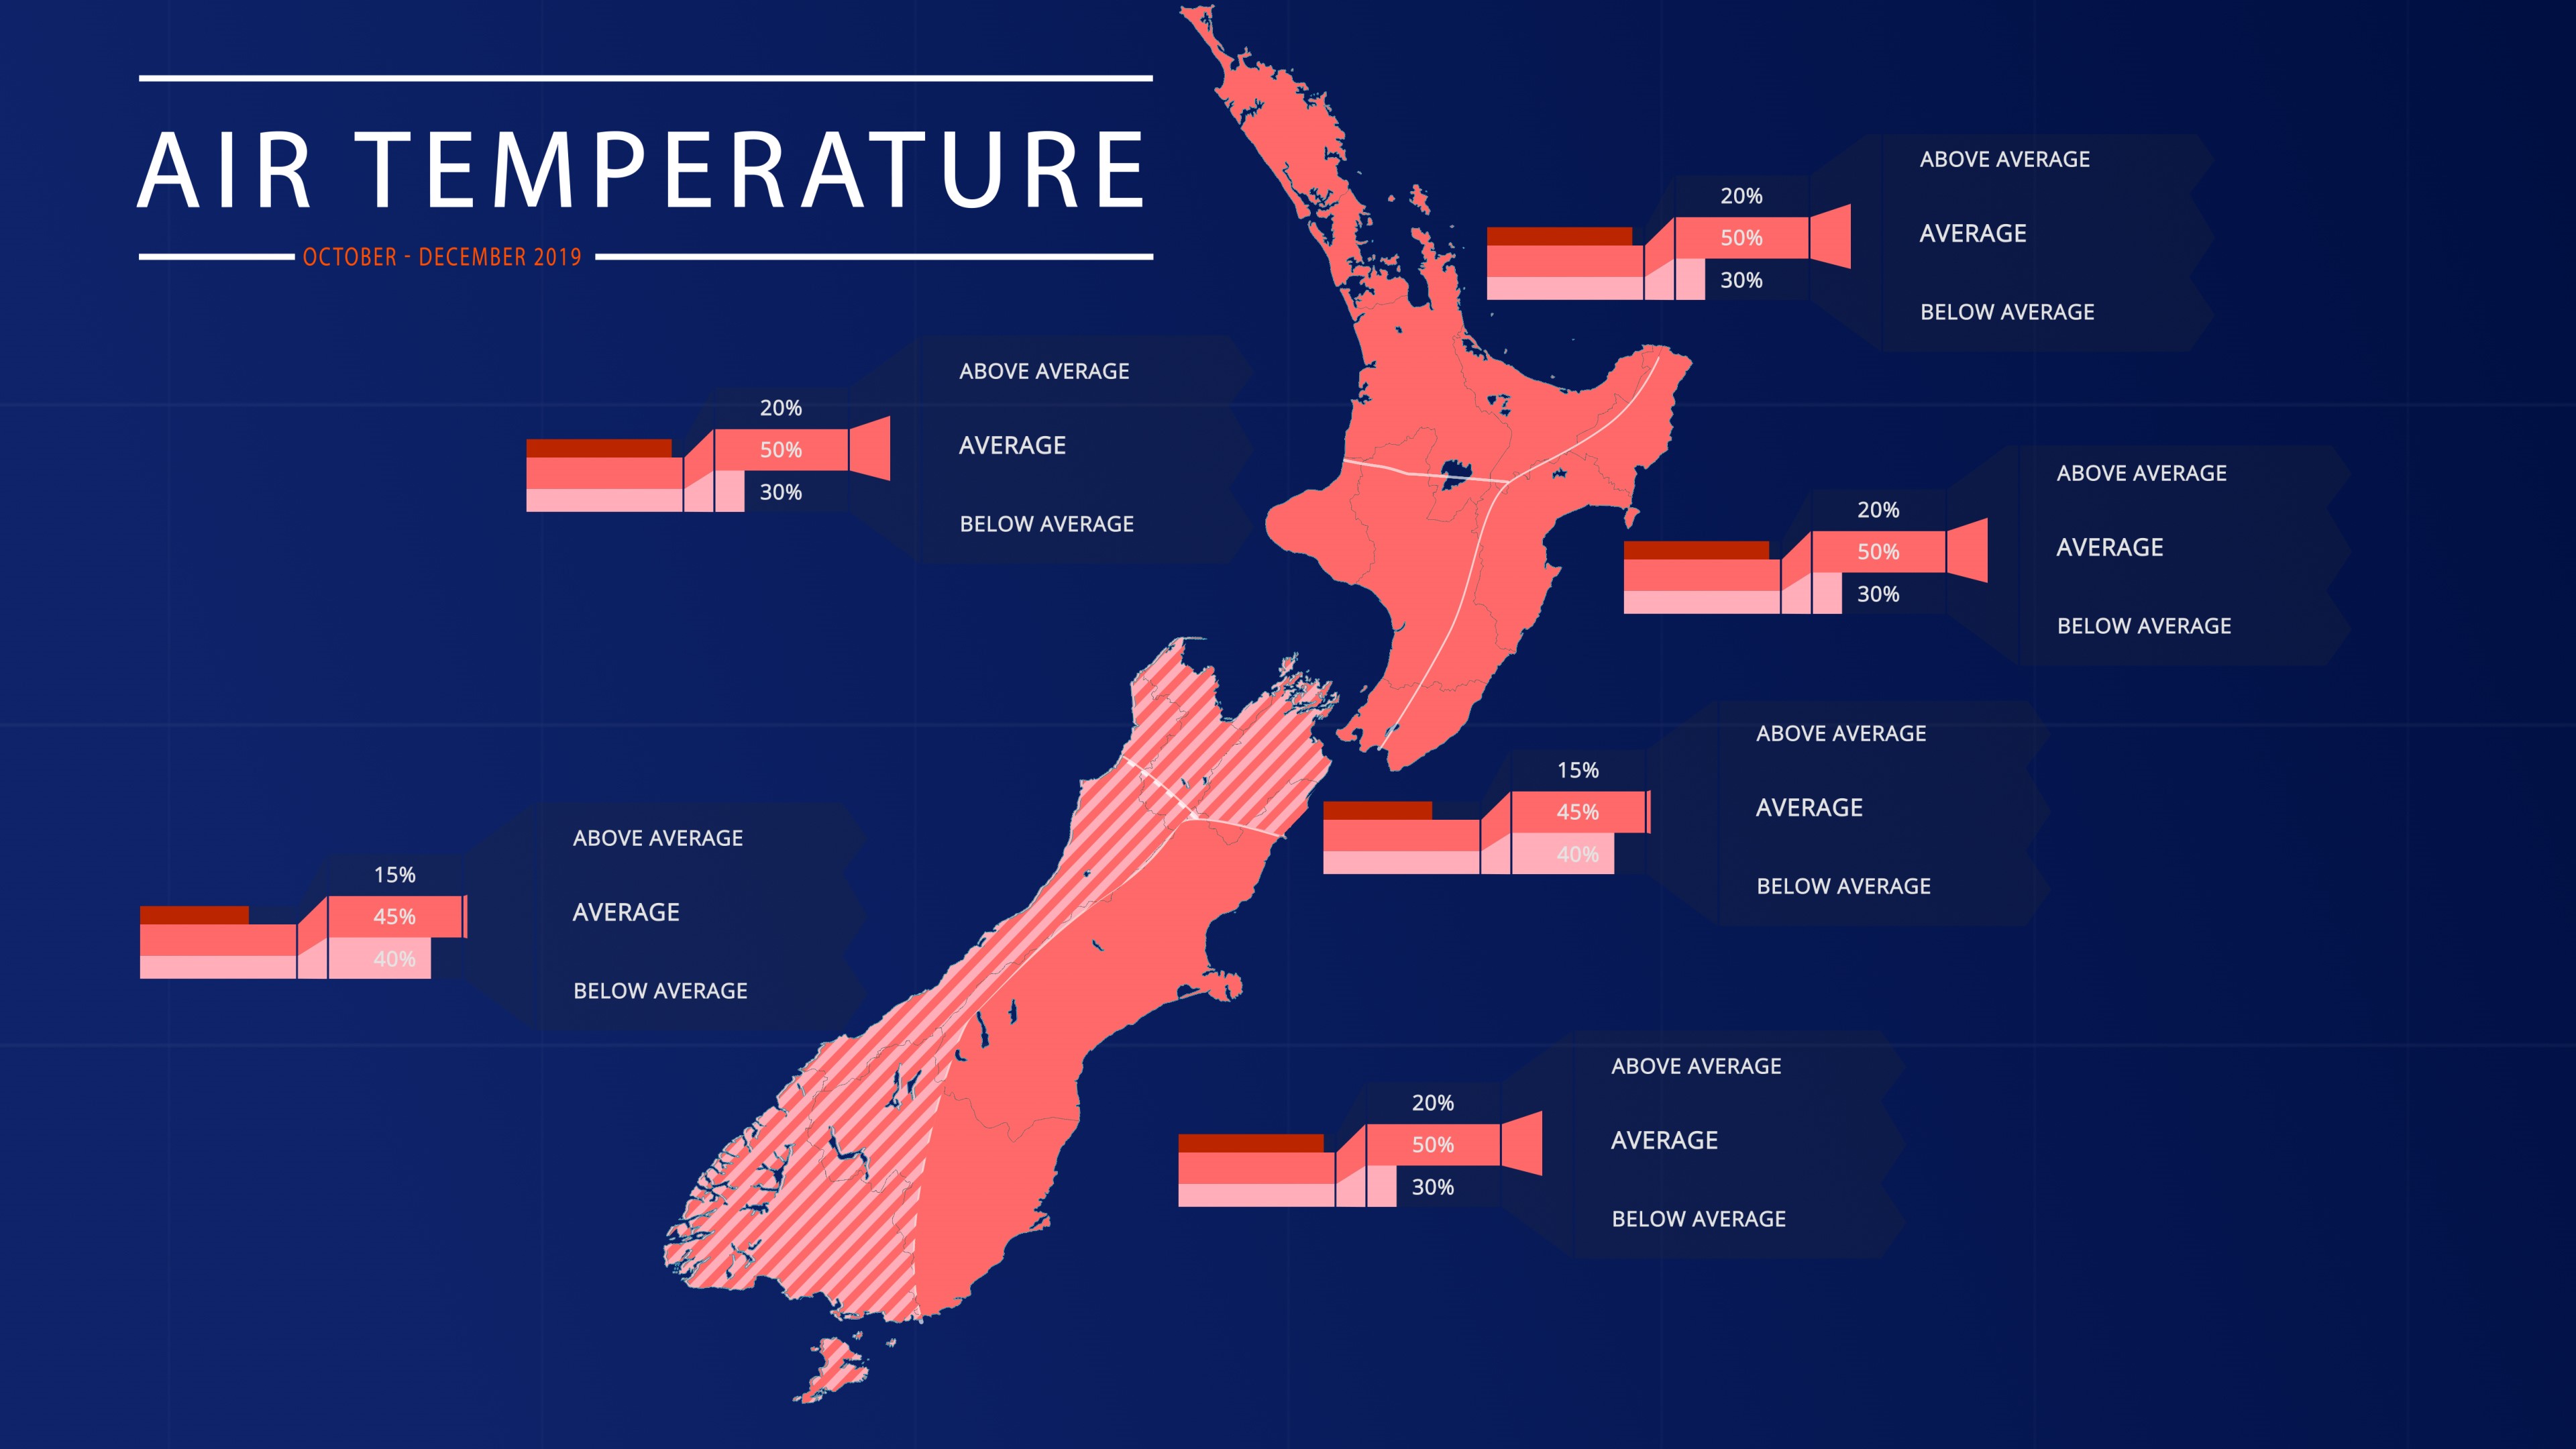
- Temperatures are most likely to be near average for much of New Zealand, except the west and north of the South Island where there is about equal chances for near average or below average temperatures. Several sharp cold snaps are forecast during the first half of October.
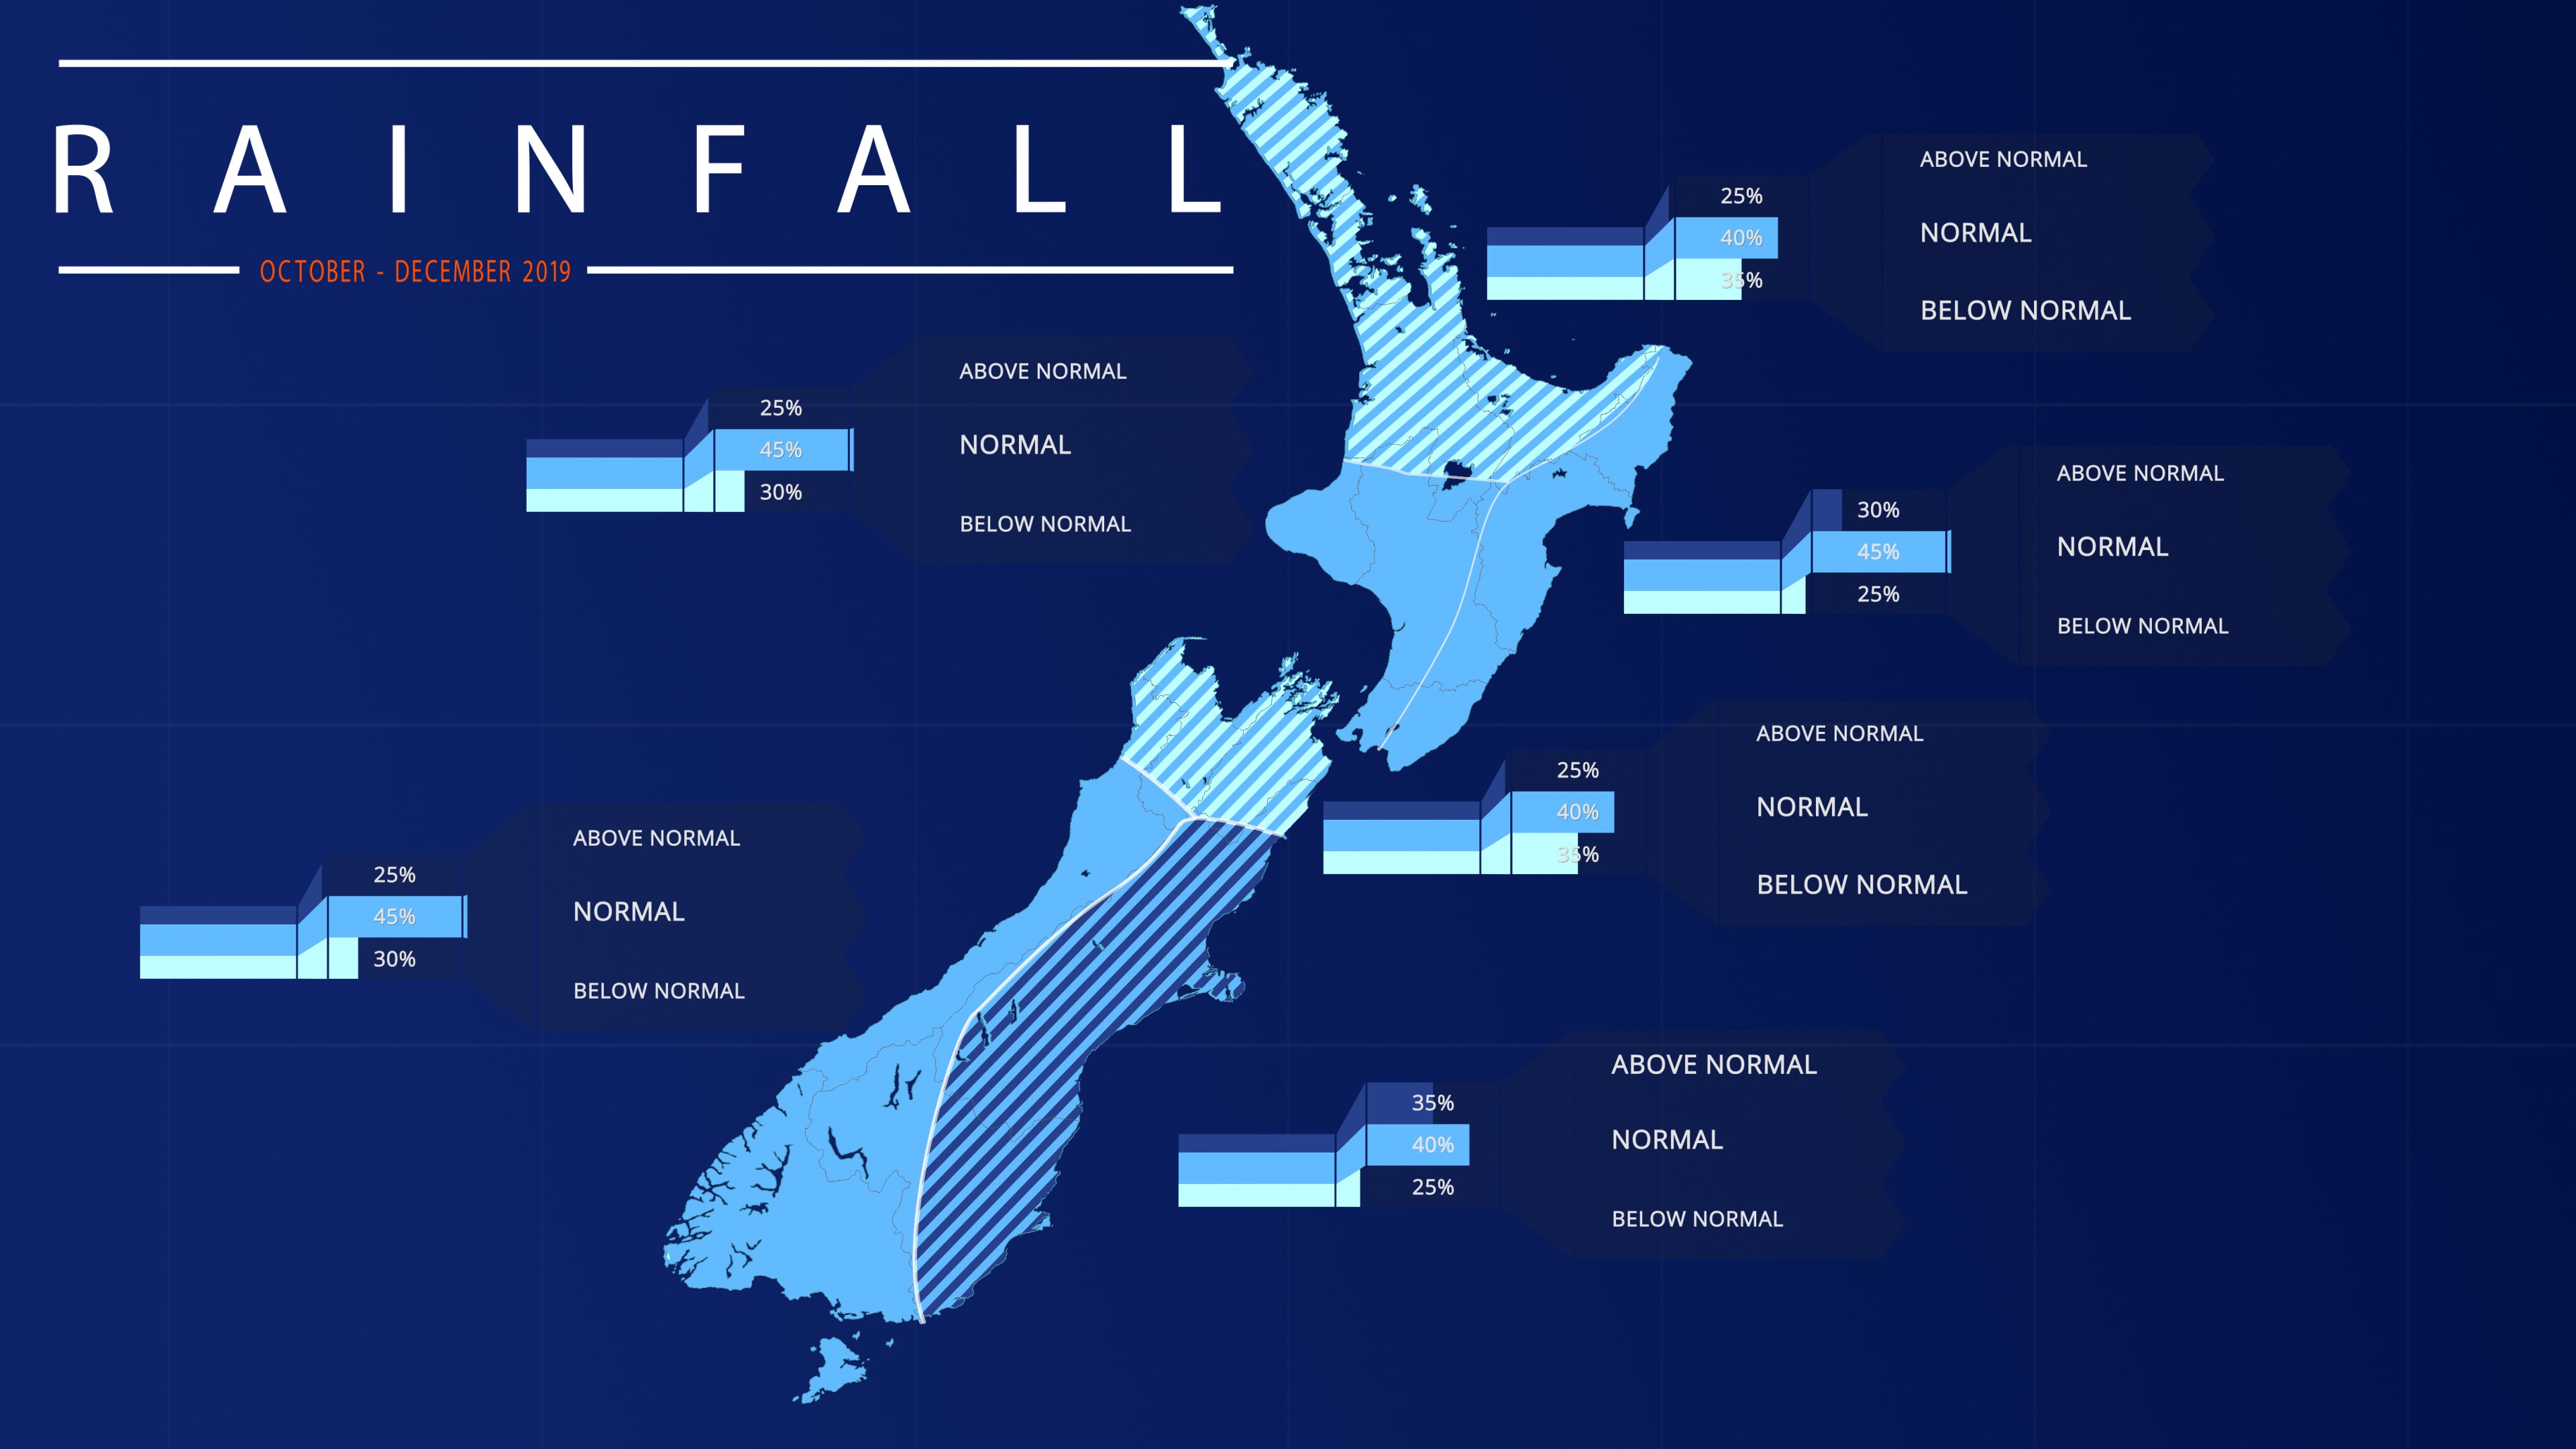
- Rainfall is most likely to be near normal for much of New Zealand, except the east of the the South Island where near normal or above normal rainfall is about equally likely and the north of the North and South Island where near normal or below normal rainfall is about equally likely. An increase in westerly winds is possible later in October and November, which may lead to periods of unusually wet conditions, particularly in western areas.
Climate Scientist Nava Fedaeff and Meteorologist Ben Noll discuss what weather Kiwi's might contend with for the rest of spring and early summer:
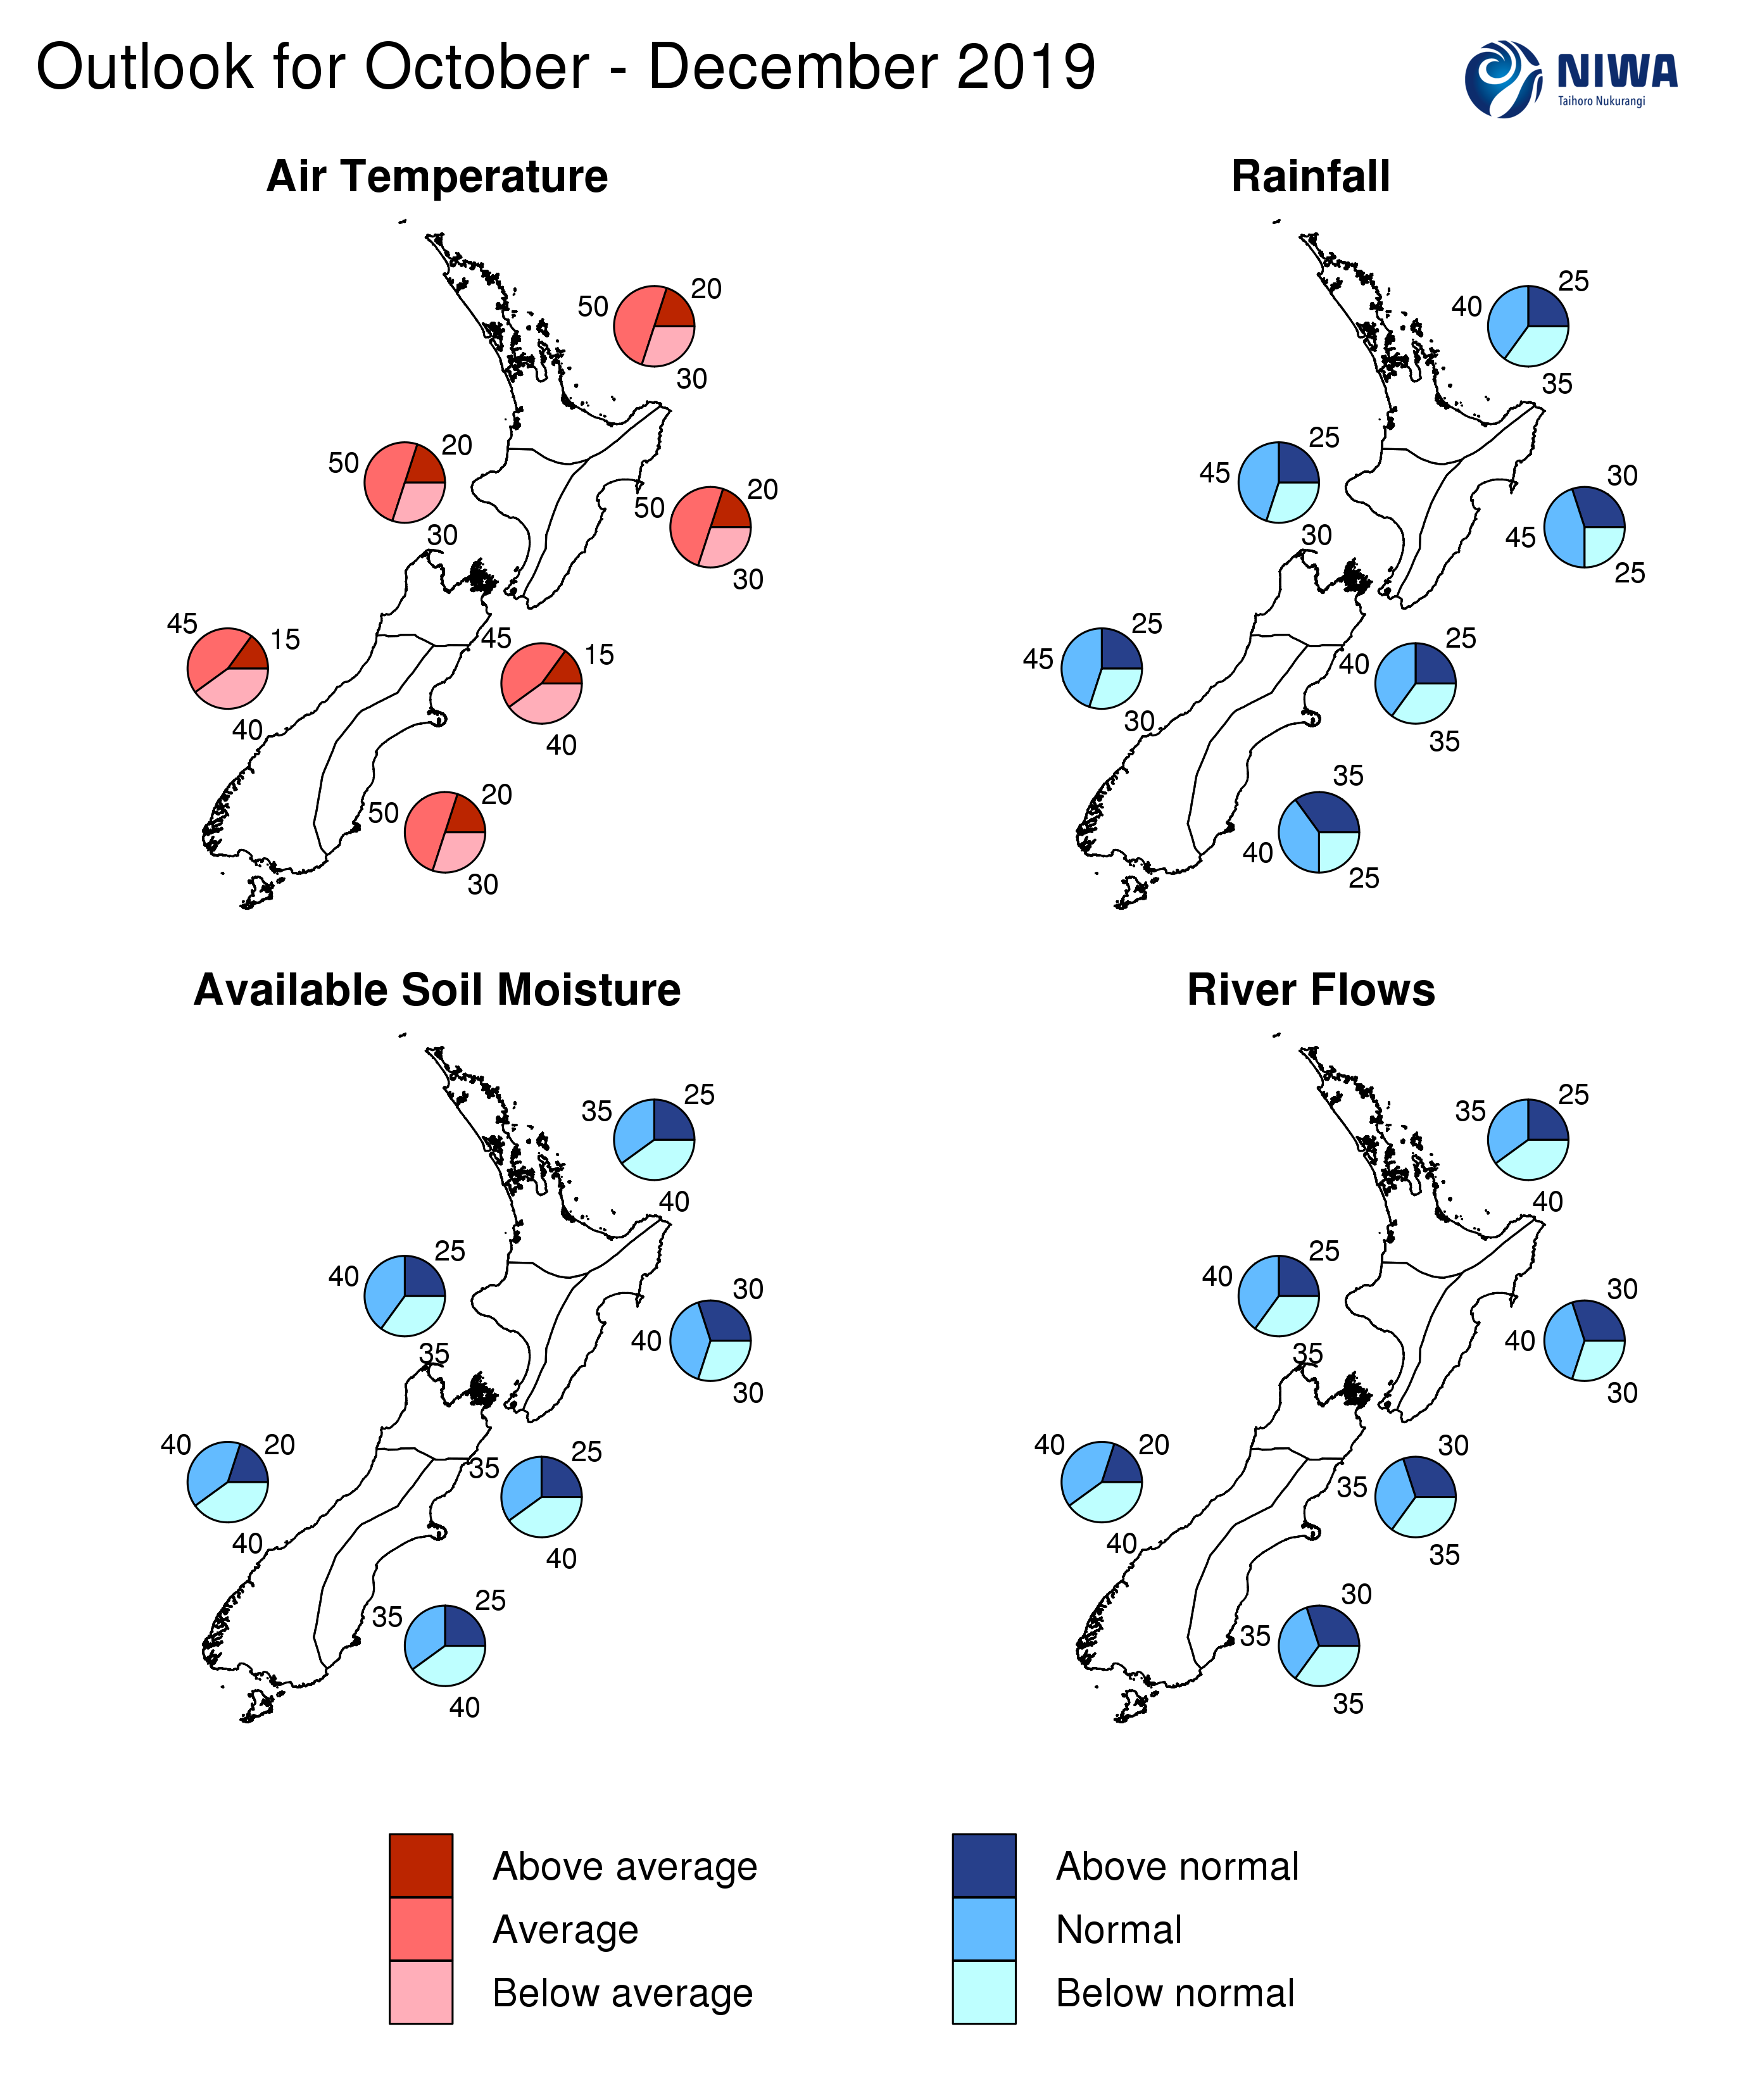
October – December 2019 temperatures have about equal chances of being near average (45% chance) or below average (40% chance) for the west and north of the South Island. All other regions of New Zealand will most likely experience near average temperatures (50% chance).
October – December 2019 rainfall is about equally likely to be near normal (40% chance) or below normal (35% chance) for the north of the North and South Island and about equally likely to be near normal (40% chance) or above normal (35% chance) in the east of the South Island. Near normal rainfall is most likely for all other regions of New Zealand (45% chance).
October – December 2019 soil moisture levels and river flows are most likely to be near normal (35-40%) or below normal (35-40% chance) for all regions of New Zealand except for the east of the North Island where near normal soil moisture levels and river flows are most likely.
Regional predictions for the October – December 2019 season
Northland, Auckland, Waikato, Bay of Plenty
The table below shows the probabilities (or percent chances) for each of three categories: above average, near average, and below average. In the absence of any forecast guidance there would be an equal likelihood (33% chance) of the outcome being in any one of the three categories. Forecast information from local and global guidance models is used to indicate the deviation from equal chance expected for the coming three-month period, with the following outcomes the most likely (but not certain) for this region:
- Temperatures are most likely to be near average (50% chance).
- Rainfall totals are about equally likely to be near normal (40% chance) or below normal (35% chance).
- Soil moisture levels and river flows are about equally likely to be below normal (40% chance) or near normal (35% chance).
The full probability breakdown is:
|
Temperature |
Rainfall |
Soil moisture |
River flows |
|
|
Above average |
20 |
25 |
25 |
25 |
|
Near average |
50 |
40 |
35 |
35 |
|
Below average |
30 |
35 |
40 |
40 |
Central North Island, Taranaki, Whanganui, Manawatu, Wellington
Probabilities are assigned in three categories: above average, near average, and below average.
- Temperatures are most likely to be near average (50% chance).
- Rainfall totals are most likely to be in the near normal range (45% chance).
- Soil moisture levels and river flows are about equally likely to be near normal (40% chance) or below normal (35% chance).
The full probability breakdown is:
|
Temperature |
Rainfall |
Soil moisture |
River flows |
|
|
Above average |
20 |
25 |
25 |
25 |
|
Near average |
50 |
45 |
40 |
40 |
|
Below average |
30 |
30 |
35 |
35 |
Gisborne, Hawke’s Bay, Wairarapa
Probabilities are assigned in three categories: above average, near average, and below average.
- Temperatures are most likely to be near average (50% chance).
- Rainfall totals are most likely to be in the near normal range (45% chance).
- Soil moisture levels and river flows are most likely to be near normal (40% chance).
The full probability breakdown is:
|
Temperature |
Rainfall |
Soil moisture |
River flows |
|
|
Above average |
20 |
25 |
30 |
30 |
|
Near average |
50 |
45 |
40 |
40 |
|
Below average |
30 |
30 |
30 |
30 |
Tasman, Nelson, Marlborough, Buller
Probabilities are assigned in three categories: above average, near average, and below average.
- Temperatures are about equally likely to be near average (45% chance) or below average (40% chance).
- Rainfall totals are about equally likely to be near normal (40% chance) or below normal (35% chance).
- Soil moisture levels and river flows are about equally likely to be near normal (35% chance) or below normal (35% chance).
The full probability breakdown is:
|
Temperature |
Rainfall |
Soil moisture |
River flows |
|
|
Above average |
15 |
25 |
25 |
30 |
|
Near average |
45 |
40 |
35 |
35 |
|
Below average |
40 |
35 |
40 |
35 |
West Coast, Alps and foothills, inland Otago, Southland
Probabilities are assigned in three categories: above average, near average, and below average.
- Temperatures are about equally likely to be near average (45% chance) or below average (40% chance).
- Rainfall totals are most likely to be in the near normal range (45% chance).
- Soil moisture levels and river flows are equally likely to be near normal (40% chance) or below normal (40% chance).
The full probability breakdown is:
|
Temperature |
Rainfall |
Soil moisture |
River flows |
|
|
Above average |
15 |
25 |
20 |
20 |
|
Near average |
45 |
45 |
40 |
40 |
|
Below average |
40 |
30 |
40 |
40 |
Coastal Canterbury, east Otago
Probabilities are assigned in three categories: above average, near average, and below average.
- Temperatures are most likely to be near average (50% chance).
- Rainfall totals are about equally likely to be near normal (40% chance) or above normal (35% chance).
- Soil moisture levels and river flows are about equally likely to be near normal (35% chance) or below normal (35-40% chance).
The full probability breakdown is:
|
Temperature |
Rainfall |
Soil moisture |
River flows |
|
|
Above average |
20 |
35 |
25 |
30 |
|
Near average |
50 |
40 |
35 |
35 |
|
Below average |
30 |
25 |
40 |
35 |
Graphical representation of the regional probabilities
Background
The NINO3.4 Index (in the central Pacific) for the month of September (to the 29th) was equal to the 1981-2010 climatological value (i.e. zero anomaly). Above average warmth continued in the NINO4 region (west-central Pacific) with a monthly anomaly of +0.65˚C. The NINO 1+2 Index continued to cool during September with a monthly anomaly of -0.58˚C (near the La Niña threshold).
Upper-oceanic heat content anomalies continued to decrease in the eastern and east-central equatorial Pacific. Meanwhile, the core of the warm pool of water than had been associated with El Niño-Modoki conditions earlier in 2019 was located just west of the International Dateline during September. While this spatial pattern reflects ENSO neutral conditions, the atmosphere may respond to the growing coolness in the eastern equatorial Pacific during the next season or two.
Across the global tropics, rainfall patterns were consistent with ENSO neutral conditions. For the first month in quite a while, below normal rainfall occurred near the International Dateline. The most dominant tropical signal occurred across the eastern Indian Ocean and Indonesia, where rainfall and cloud cover was well below normal. This was consistent with a strongly positive Indian Ocean Dipole (IOD) pattern, where sea-surface temperatures are above average in the western Indian Ocean and correspondingly below average in the east near Sumatra (hence the term “dipole”). A positive IOD is associated with drought in Indonesia and southeast Australia.
When the IOD begins to influence the Walker Circulation, as it did during September, it can have flow-on impacts for areas outside the tropics, including New Zealand. Historically, a strongly positive IOD has been associated with a transition from dry to wet conditions about the western South Island during November due to an increase in westerly winds. Temperatures, historically, hedge in the cooler direction for the October-December period when the IOD is strongly positive.
Trade winds were slightly stronger than normal in the tropical Pacific during September. This led to additional cooling of SSTs. During October, stronger than normal trade winds are forecast to develop in the west-central Pacific, which may contribute to additional cooling in the Niño 3 and 4 regions.
According to the consensus from international models, oceanic ENSO-neutral conditions are most likely at 61% chance for the October – December period with El Niño at a 35% chance. For the January – March 2020 period, the probability for neutral conditions is 55% with the chance for El Niño increasing to 40%. For April – June 2020, the probability for neutral conditions and El Niño is 56% and 41%, respectively.
New Zealand’s coastal water temperatures continued to cool during September 2019. SST anomalies are now below zero for all six climate regions of NZ for the first time since January 2017. SSTs in the Southwest Pacific are close to average except east of the International Dateline where slightly above average warmth persists. Near or below average regional SSTs are forecast to continue through the next season, particularly near New Zealand and in the Tasman Sea.
New Zealand Coastal Sea Surface Temperatures during September 2019
|
North NI |
West NI |
East NI |
North SI |
West SI |
East SI |
|
-0.20˚C |
-0.27˚C |
-0.27˚C |
-0.39˚C |
-0.33˚C |
-0.06˚C |
The Southern Annular Mode (SAM) was strongly negative for the first week of September before becoming positive. During early October, the SAM may become slightly positive before turning negative. There are indications of an unsettled pattern unfolding around New Zealand during the mid-to-late October period, which may be associated with a negative SAM.
The Madden-Julian Oscillation (MJO) became convectively active in phases 8 and 1 during September. During the first half of October, an MJO pulse of moderate strength looks likely to persist in phase 1. Historically, this phase has been associated with near or below average temperatures and near or above normal rainfall for much of New Zealand (less the western South Island, where near or below normal rainfall has historically occurred).
A major Sudden Stratospheric Warming (SSW) event, or rapid warming of stratospheric temperatures (>25˚C) in a week or less AND a reversal of the stratospheric zonal mean winds at 60˚S from westerly to easterly, occurred during September 2019. This was the Southern Hemisphere’s strongest SSW on record and just the 2nd major event on record (September 2002 had a major SSW). The event was associated with a weakening and displacement of the stratospheric polar vortex toward Patagonia. Meanwhile, an area of stratospheric high pressure formed in eastern Antarctica. While the stratosphere did not couple, or directly connect, with the troposphere (where we live) as it did in 2002, an anomaly associated with the tropospheric polar vortex was located to the east of Argentina. This displacement caused impacts to surface weather patterns across the Southern Hemisphere mid-latitudes, allowing very cold air masses to sweep northward. Chile, Argentina, Uruguay, New Zealand, and southern Australia experienced colder than average temperatures during September.
For New Zealand, the start to October will come with additional sharp cold spells. Several models indicate that during the coming season, higher than normal pressure will be favoured in the polar region, allowing for the development of a ring of lower than normal pressure in the Southern Hemisphere mid-latitudes. This is consistent with a negative SAM. Although seasonal temperatures will climb from October through December, the door to the Southern Ocean may remain “ajar”, allowing air masses from the south to continually influence New Zealand’s patterns.
Forecast Confidence
Temperature
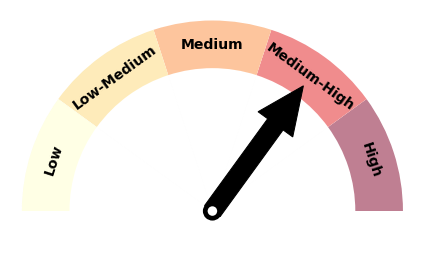
Forecast confidence for temperature is medium to high due to climate drivers such as the sudden stratospheric warming event and below average coastal sea temperatures as well as strong model agreement.
Rainfall
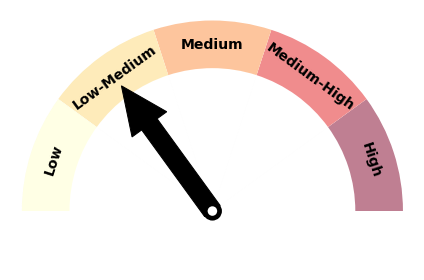
Forecast confidence for rainfall is low to medium because of the significant month-to-month variation expected during the upcoming season and a slightly above average risk for intense rainfall events associated with a positive Indian Ocean Dipole event. Furthermore, model performance was poor during September 2019.
Download
Seasonal climate outlook for October - December 2019.
