ENSO (El Niño – Southern Oscillation) neutral conditions are still present in the tropical Pacific Ocean as a whole, although some indicators are currently in the weak La Niña category. Sea surface temperatures (SSTs) in the central equatorial Pacific Ocean are near or slightly below average, and slightly above average in the western Pacific and off the South American coast. The atmospheric conditions over the tropical Pacific are generally consistent with an ENSO-neutral state, but show a leaning towards La Niña, as was already the case last month.
The Southern Oscillation Index (SOI) is currently positive (+1.3, value for September 2016 estimated on the 30th of September) and thus technically in the La Niña category. The trade winds are slightly stronger than normal in the western Pacific (west of ~ 140oW). Subsurface ocean temperature anomalies are relatively weak and cooler than normal waters are mostly found in the central (rather than the eastern) Pacific. In summary, the ocean – atmosphere system in the tropical Pacific shows a mix of ENSO-neutral and weak La Niña signals.
International guidance still slightly favours La Niña conditions (54% chance) over the next three months (October - December 2016) however neutral conditions are forecast to become slightly more likely than La Niña by January – March 2017 (50% chance for neutral) and the probability for La Niña drops sharply later on, with only 24% chance in April – June 2017. In summary, La Niña conditions are only slightly more likely than not over the next 3 months, and become less likely as we progress into the first half of 2017.
Despite the current borderline La Niña conditions and the only modest probability for La Niña to develop by the end of the year, the circulation pattern expected for October - December 2016 for the New Zealand region is broadly consistent with the typical La Niña signature: higher pressure than normal is forecast to the south and southeast of the country, while lower pressures than normal are forecast to the north of the New Zealand. These pressure anomalies are likely to be accompanied with easterly quarter flow anomalies.
NIWA Meteorologist Ben Noll explains the regional outlook for New Zealand's temperature and rainfall for the rest of spring and into summer 2016.
Outlook Summary
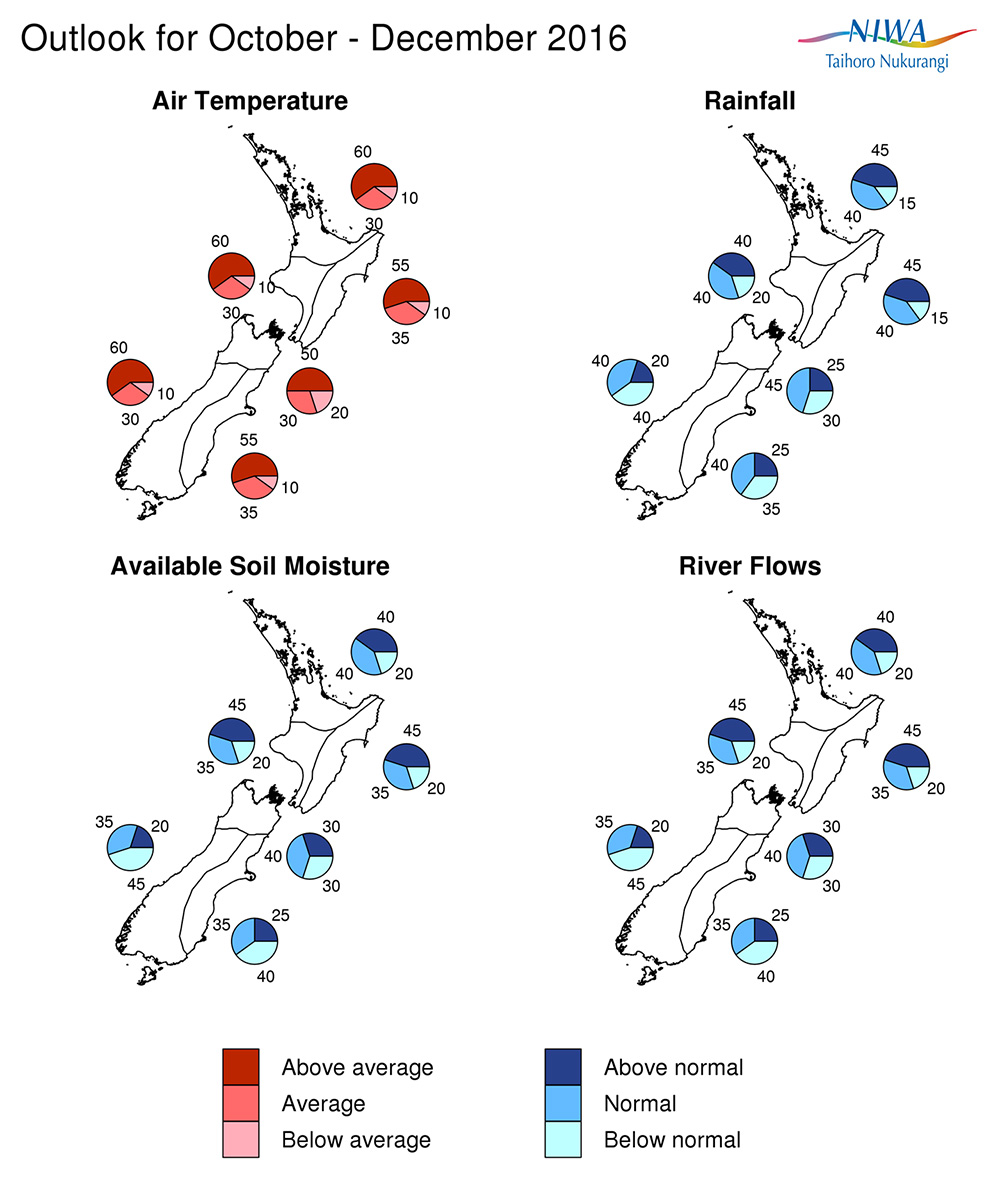
October-December 2016 temperatures are most likely (50-55% chance) to be above average in the north of the South Island, east of the North Island and east of the South Island and very likely (60% chance) to be above average in the north and west of the North Island and the west of the South Island. Sea surface temperatures around New Zealand are forecast to remain near or above normal over the next three months.
October-December 2016 rainfall totals are about equally likely to be in the near normal range (40% chance) or above normal range (40-45% chance) in the North Island. Seasonal rainfall totals are most likely (45% chance) to be in the near normal range in the north of the South Island. In the east and west of the South Island, rainfall for October-December 2016 is about equally likely to be near normal (40% chance) or below normal (35-40% chance).
October-December 2016 soil moisture levels and river flows are most likely to be above normal (45% chance) in the east and west of the North Island and equally likely (40% chance) to be near normal or above normal in the north of the North Island. Seasonal soil moisture levels and river flows in the north of the South Island are most likely (40% chance) to be in the near normal range. Below normal soil moisture levels and river flows are most likely (45% chance) for the west of the South Island. In the east of the South Island, soil moisture levels and river flows are about equally likely to be below normal (40% chance) or near normal (35% chance).
Regional predictions for the October – December 2016 season
Northland, Auckland, Waikato, Bay of Plenty
The table below shows the probabilities (or percent chances) for each of three categories: above average, near average, and below average. In the absence of any forecast guidance there would be an equal likelihood (33% chance) of the outcome being in any one of the three categories. Forecast information from local and global guidance models is used to indicate the deviation from equal chance expected for the coming three month period, with the following outcomes the most likely (but not certain) for this region:
- Temperatures are very likely to be above average (60% chance).
- Rainfall totals are about equally likely to be above normal (45% chance) or near normal (40% chance).
- Soil moisture levels and river flows are equally likely to be near normal (40% chance) or above normal (40% chance).
The full probability breakdown is:
|
Temperature |
Rainfall |
Soil moisture |
River flows |
|
|
Above average |
60 |
45 |
40 |
40 |
|
Near average |
30 |
40 |
40 |
40 |
|
Below average |
10 |
15 |
20 |
20 |
Central North Island, Taranaki, Wanganui, Manawatu, Wellington
Probabilities are assigned in three categories: above average, near average, and below average.
- Temperatures are very likely to be above average (60% chance).
- Rainfall totals most are equally likely to be near normal (40% chance) or above normal (40% chance).
- Soil moisture levels and river flows are most likely (45% chance) to be in the above normal range.
The full probability breakdown is:
|
Temperature |
Rainfall |
Soil moisture |
River flows |
|
|
Above average |
60 |
40 |
45 |
45 |
|
Near average |
30 |
40 |
35 |
35 |
|
Below average |
10 |
20 |
20 |
20 |
Gisborne, Hawke’s Bay, Wairarapa
Probabilities are assigned in three categories: above average, near average, and below average.
- Temperatures are most likely to be above average (55% chance).
- Rainfall totals are about equally likely to be above normal (45% chance) or near normal (40% chance).
- Soil moisture levels and river flows are most likely (45% chance) to be in the above normal range.
The full probability breakdown is:
|
Temperature |
Rainfall |
Soil moisture |
River flows |
|
|
Above average |
55 |
45 |
45 |
45 |
|
Near average |
35 |
40 |
35 |
35 |
|
Below average |
10 |
15 |
20 |
20 |
Nelson, Marlborough, Buller
Probabilities are assigned in three categories: above average, near average, and below average.
- Temperatures are most likely to be above average (50% chance).
- Rainfall totals are most likely (45% chance) to be in the near normal range.
- Soil moisture levels and river flows are most likely to be in the near normal range (40% chance).
The full probability breakdown is:
|
Temperature |
Rainfall |
Soil moisture |
River flows |
|
|
Above average |
50 |
25 |
30 |
30 |
|
Near average |
30 |
45 |
40 |
40 |
|
Below average |
20 |
30 |
30 |
30 |
West Coast, Alps and foothills, inland Otago, Southland
Probabilities are assigned in three categories: above average, near average, and below average.
- Temperatures are very likely to be above average (60% chance).
- Rainfall totals are equally likely to be near normal (40% chance) or below normal (40% chance).
- Soil moisture levels and river flows are most likely to be below normal (45% chance).
The full probability breakdown is:
|
Temperature |
Rainfall |
Soil moisture |
River flows |
|
|
Above average |
60 |
20 |
20 |
20 |
|
Near average |
30 |
40 |
35 |
35 |
|
Below average |
10 |
40 |
45 |
45 |
Coastal Canterbury, east Otago
Probabilities are assigned in three categories: above average, near average, and below average.
- Temperatures are most likely to be above average (55% chance).
- Rainfall totals are about equally likely to be near normal (40% chance) or below normal (35% chance).
- Soil moisture levels and river flows are about equally likely to be below normal (40% chance) or near normal (35% chance).
The full probability breakdown is:
|
Temperature |
Rainfall |
Soil moisture |
River flows |
|
|
Above average |
55 |
25 |
25 |
25 |
|
Near average |
35 |
40 |
35 |
35 |
|
Below average |
10 |
35 |
40 |
40 |
Graphical representation of the regional probabilities
Background
Sea Surface Temperatures (SST) are near to slightly below average in the central and eastern Equatorial Pacific Ocean and the conventional Niño SST indices are well into the neutral range (ranging from -0.4oC for the NINO3.4 index to +0.4oC for the NINO1+2 index). Subsurface ocean temperature anomalies are still present between about 100 to 150 m depth in the equatorial Pacific but are relatively weak (barely exceeding -2.0oC for September as a whole) and are mostly present in the central (rather than the eastern) Pacific.
The Southern Oscillation Index (SOI) is positive for September 2016, with a value of +1.3 (value estimated on the 30th of September) and is thus technically in the La Niña category. The trade winds are slightly stronger than normal in the western Pacific (west of ~ 140oW). The Intertropical Convergence Zone (ITCZ) was displaced north of its climatological position along the Equator in the central and eastern Pacific. Convection and rainfall were generally above normal for the Maritime Continent (e.g. Indonesia, Papua New Guinea).
In summary, the ocean – atmosphere system in the tropical Pacific currently shows a mix of ENSO-neutral and weak La Niña signals, with the atmosphere leaning more clearly towards La Niña than the ocean.
International guidance indicates that La Niña conditions are only slightly more likely than not (54% chance) to emerge over the next three months (October-December 2016). However neutral conditions become slightly more likely than La Niña by January – March 2017 (50% chance for ENSO-neutral) and the probability for La Niña drops sharply later on, with only 24% chance in April – June 2017.
Coastal waters around the country remain slightly warmer than normal, and ocean waters in the western Tasman Sea and to the north and northeast of New Zealand are much warmer than normal. The dynamical model’s forecasts for SSTs indicate that this pattern is likely to persist over the next three months (October – December 2016) and coastal waters around the country are expected to be near or above normal.
To find out more about normal conditions for this outlook period, refer to our daily updates on climate maps.
Contacts
For comment, please contact:
Chris Brandolino, Principal Scientist – Forecasting, NIWA National Climate Centre Tel (09) 375 6335, Mobile (027) 886 0014
Dr Brett Mullan, Principal Scientist, NIWA National Climate Centre Tel (04) 386 0508, Mobile (027) 294 1169.
Notes to reporters and editors
- NIWA’s outlooks indicate the likelihood of climate conditions being at, above, or below average for the season as a whole. They are not ‘weather forecasts’. It is not possible to forecast precise weather conditions three months ahead of time.
- The outlooks are the result of the expert judgment of NIWA’s climate scientists. They take into account observations of atmospheric and ocean conditions and output from global and local climate models. The presence of El Niño or La Niña conditions and the sea surface temperatures around New Zealand can be a useful indicator of likely overall climate conditions for a season.
- The outlooks state the probability for above average conditions, near average conditions, and below average conditions for rainfall, temperature, soil moisture, and river flows. For example, for winter (June–July–August) 2007, for all the North Island, we assigned the following probabilities for temperature: · Above average: 60 per cent · Near average: 30 per cent · Below average: 10 per cent We therefore concluded that above average temperatures were very likely.
- This three-way probability means that a random choice would be correct only 33 per cent (or one-third) of the time. It would be like randomly throwing a dart at a board divided into three equal parts, or throwing a dice with three numbers on it. An analogy with coin tossing (a two-way probability) is not correct.
- A 50 per cent ‘hit rate’ is substantially better than guesswork, and comparable with the skill level of the best overseas climate outlooks. See, for example, analysis of global outlooks issued by the International Research Institute for Climate and Society based in the US published in the Bulletin of the American Meteorological Society (Goddard, L., A. G. Barnston, and S. J. Mason, 2003: Evaluation of the IRI’s “net assessment” seasonal climate forecasts 1997–2001. Bull. Amer. Meteor. Soc., 84, 1761–1781).
- Each month, NIWA publishes an analysis of how well its outlooks perform.This is sent to about 3500 recipients of NIWA’s newsletters, including many farmers.
- All outlooks are for the three months as a whole. There will inevitably be wet and dry days, and hot and cold days, within a season. The exact range in temperature and rainfall within each of the three categories varies with location and season. However, as a guide, the “near average” or middle category for the temperature predictions includes deviations up to ±0.5°C for the long-term mean, whereas for rainfall the “near normal” category lies between approximately 80 per cent and 115 per cent of the long-term mean.
- The seasonal climate outlooks are an output of a scientific research programme, supplemented by NIWA’s Capability Funding. NIWA does not have a government contract to produce these outlooks.
- Where probabilities are within 5% of one another, the term “about equally” is used.
Visit our media centre at: www.niwa.co.nz/news-publications/media-centre