Outlook summary
- A weak, central Pacific El Niño continued during May, as patterns of enhanced rainfall persisted in the vicinity of the International Dateline. Although El Niño is forecast to continue during the upcoming three-month period, it may weaken later in 2019.
- Air pressure is expected to be higher than normal to the west and north of New Zealand and lower than normal to the south, resulting in more westerly quarter winds than normal.
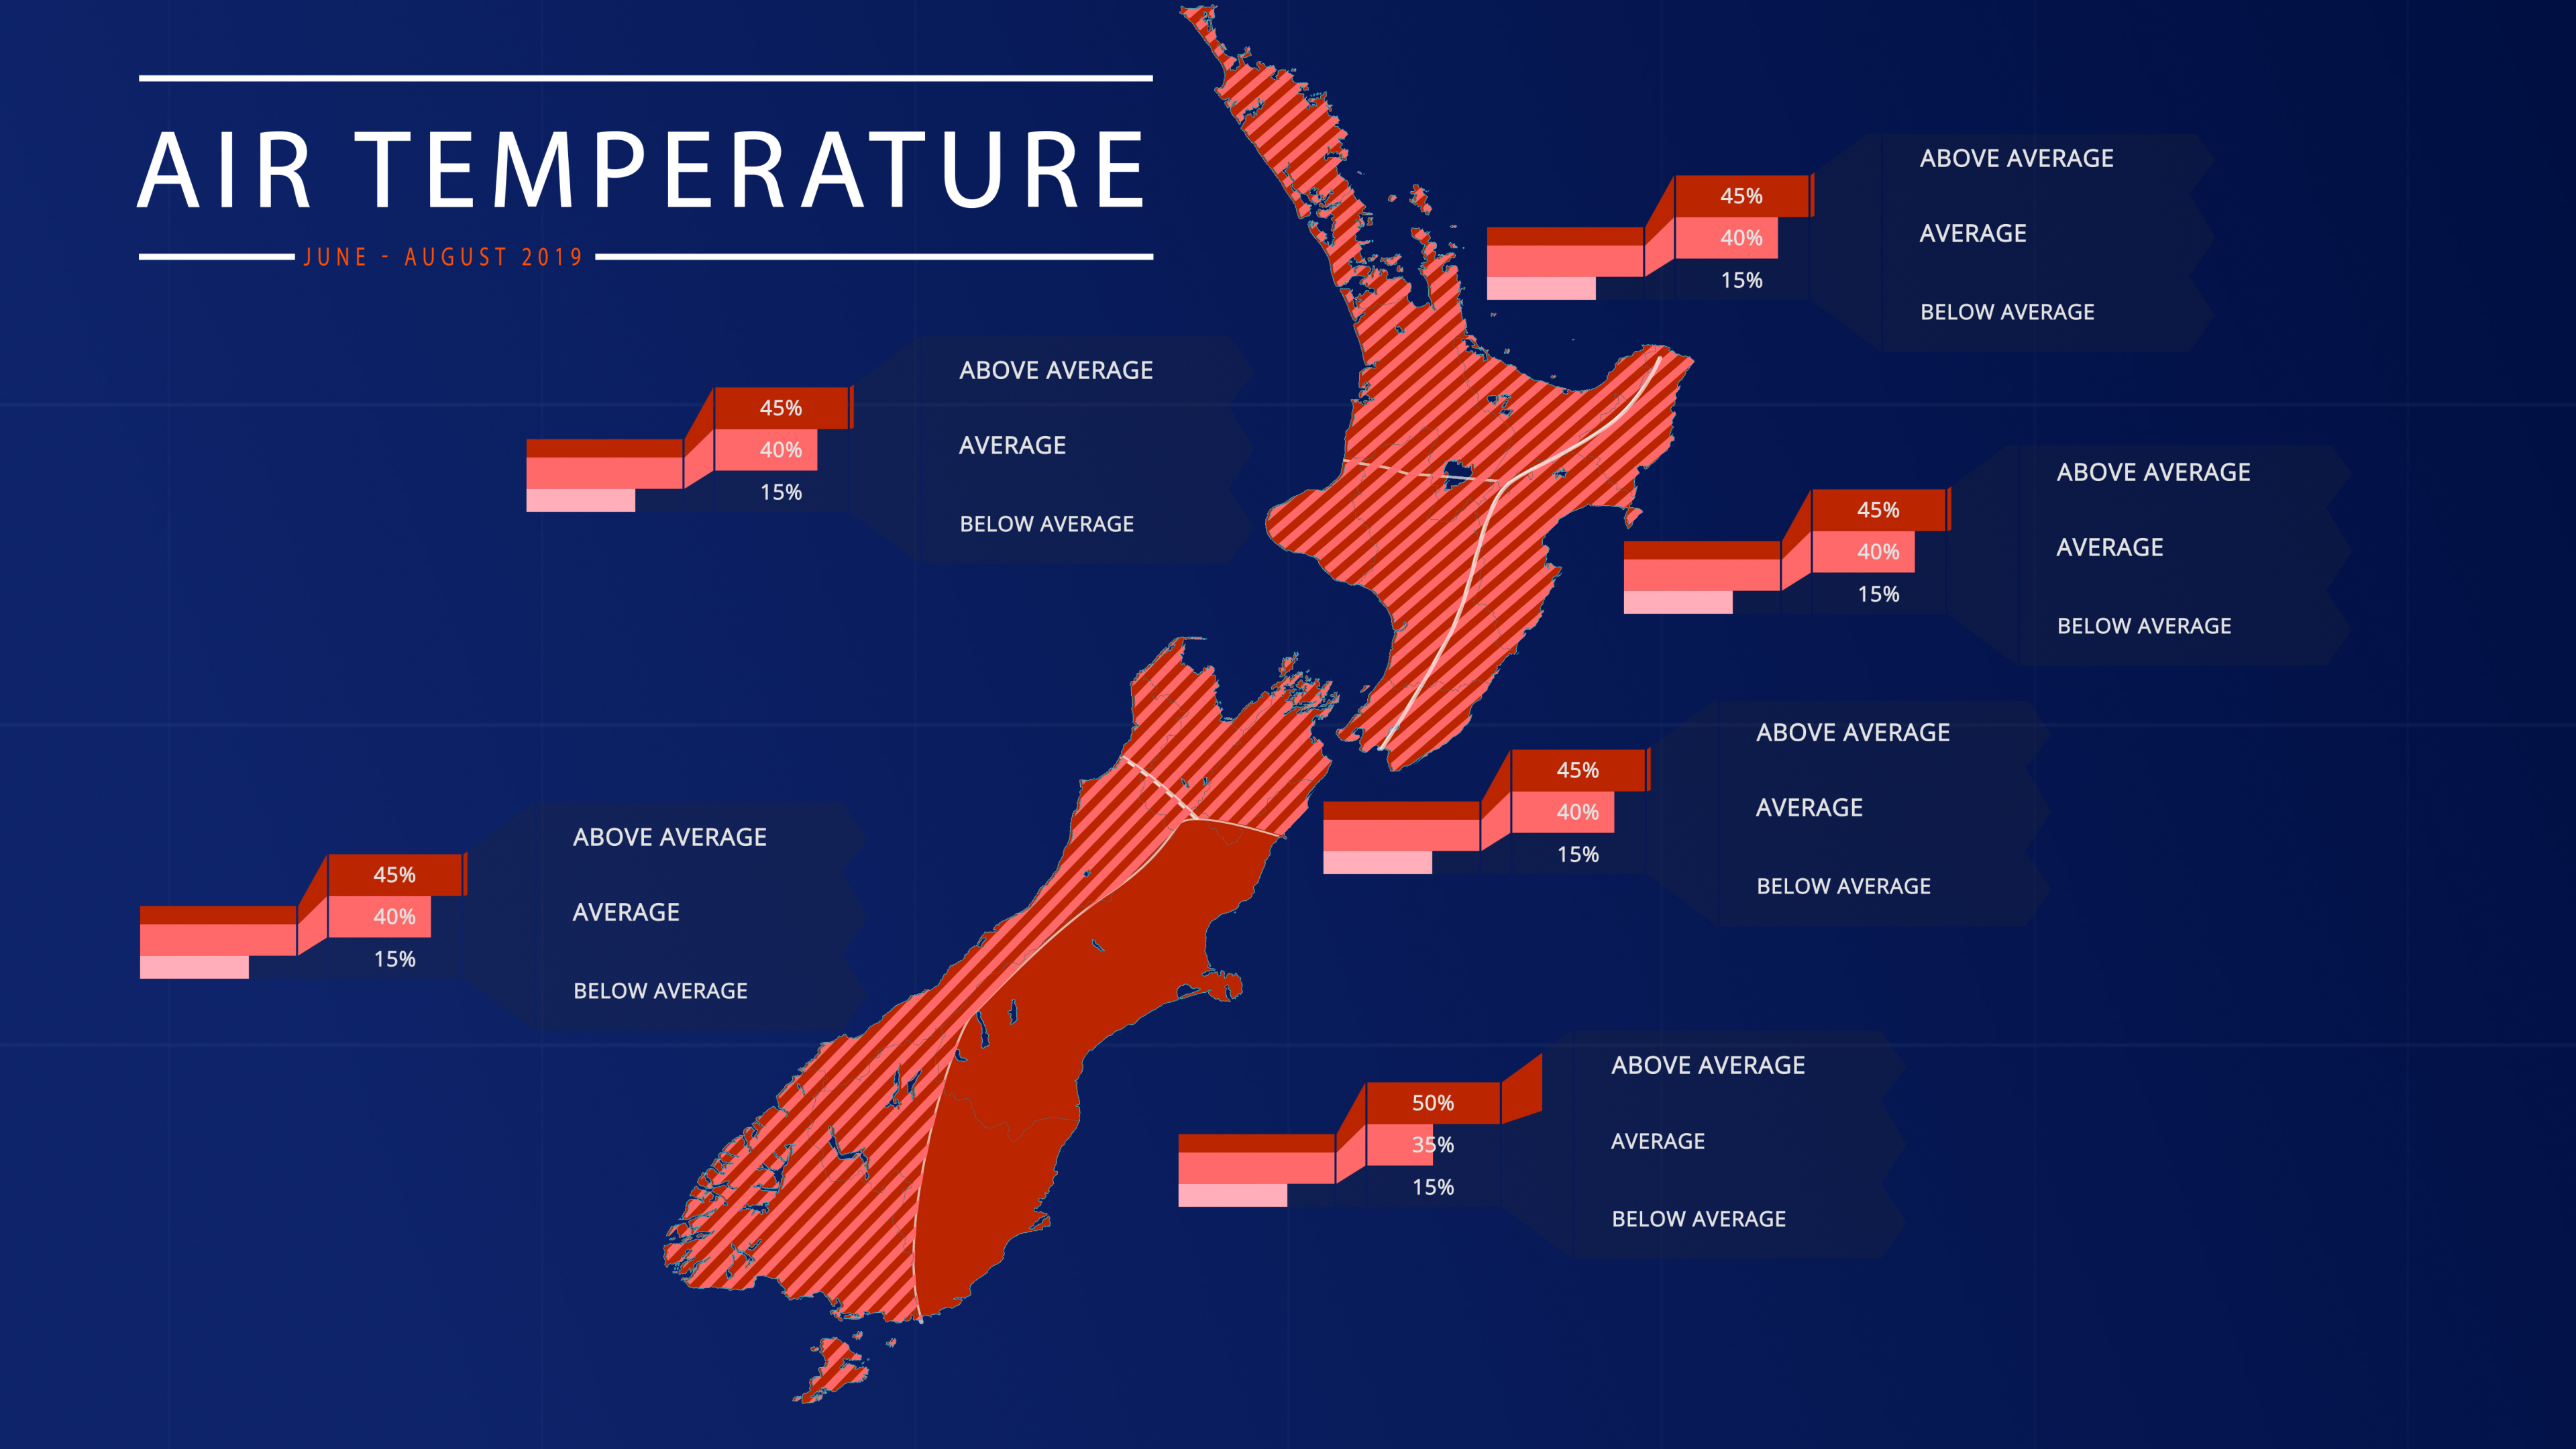
- Winter temperatures are forecast to be above average in the east of the South Island and to be above average or near average in all remaining regions.
- Early June will feature unsettled weather and colder than average temperatures for most of New Zealand, however, warmer than average coastal and Tasman Sea surface temperatures along with a lack of southerlies may reduce the risk for cold snaps.
- July could turn out to be a more settled month than June with an increased chance for high pressure systems to affect New Zealand.
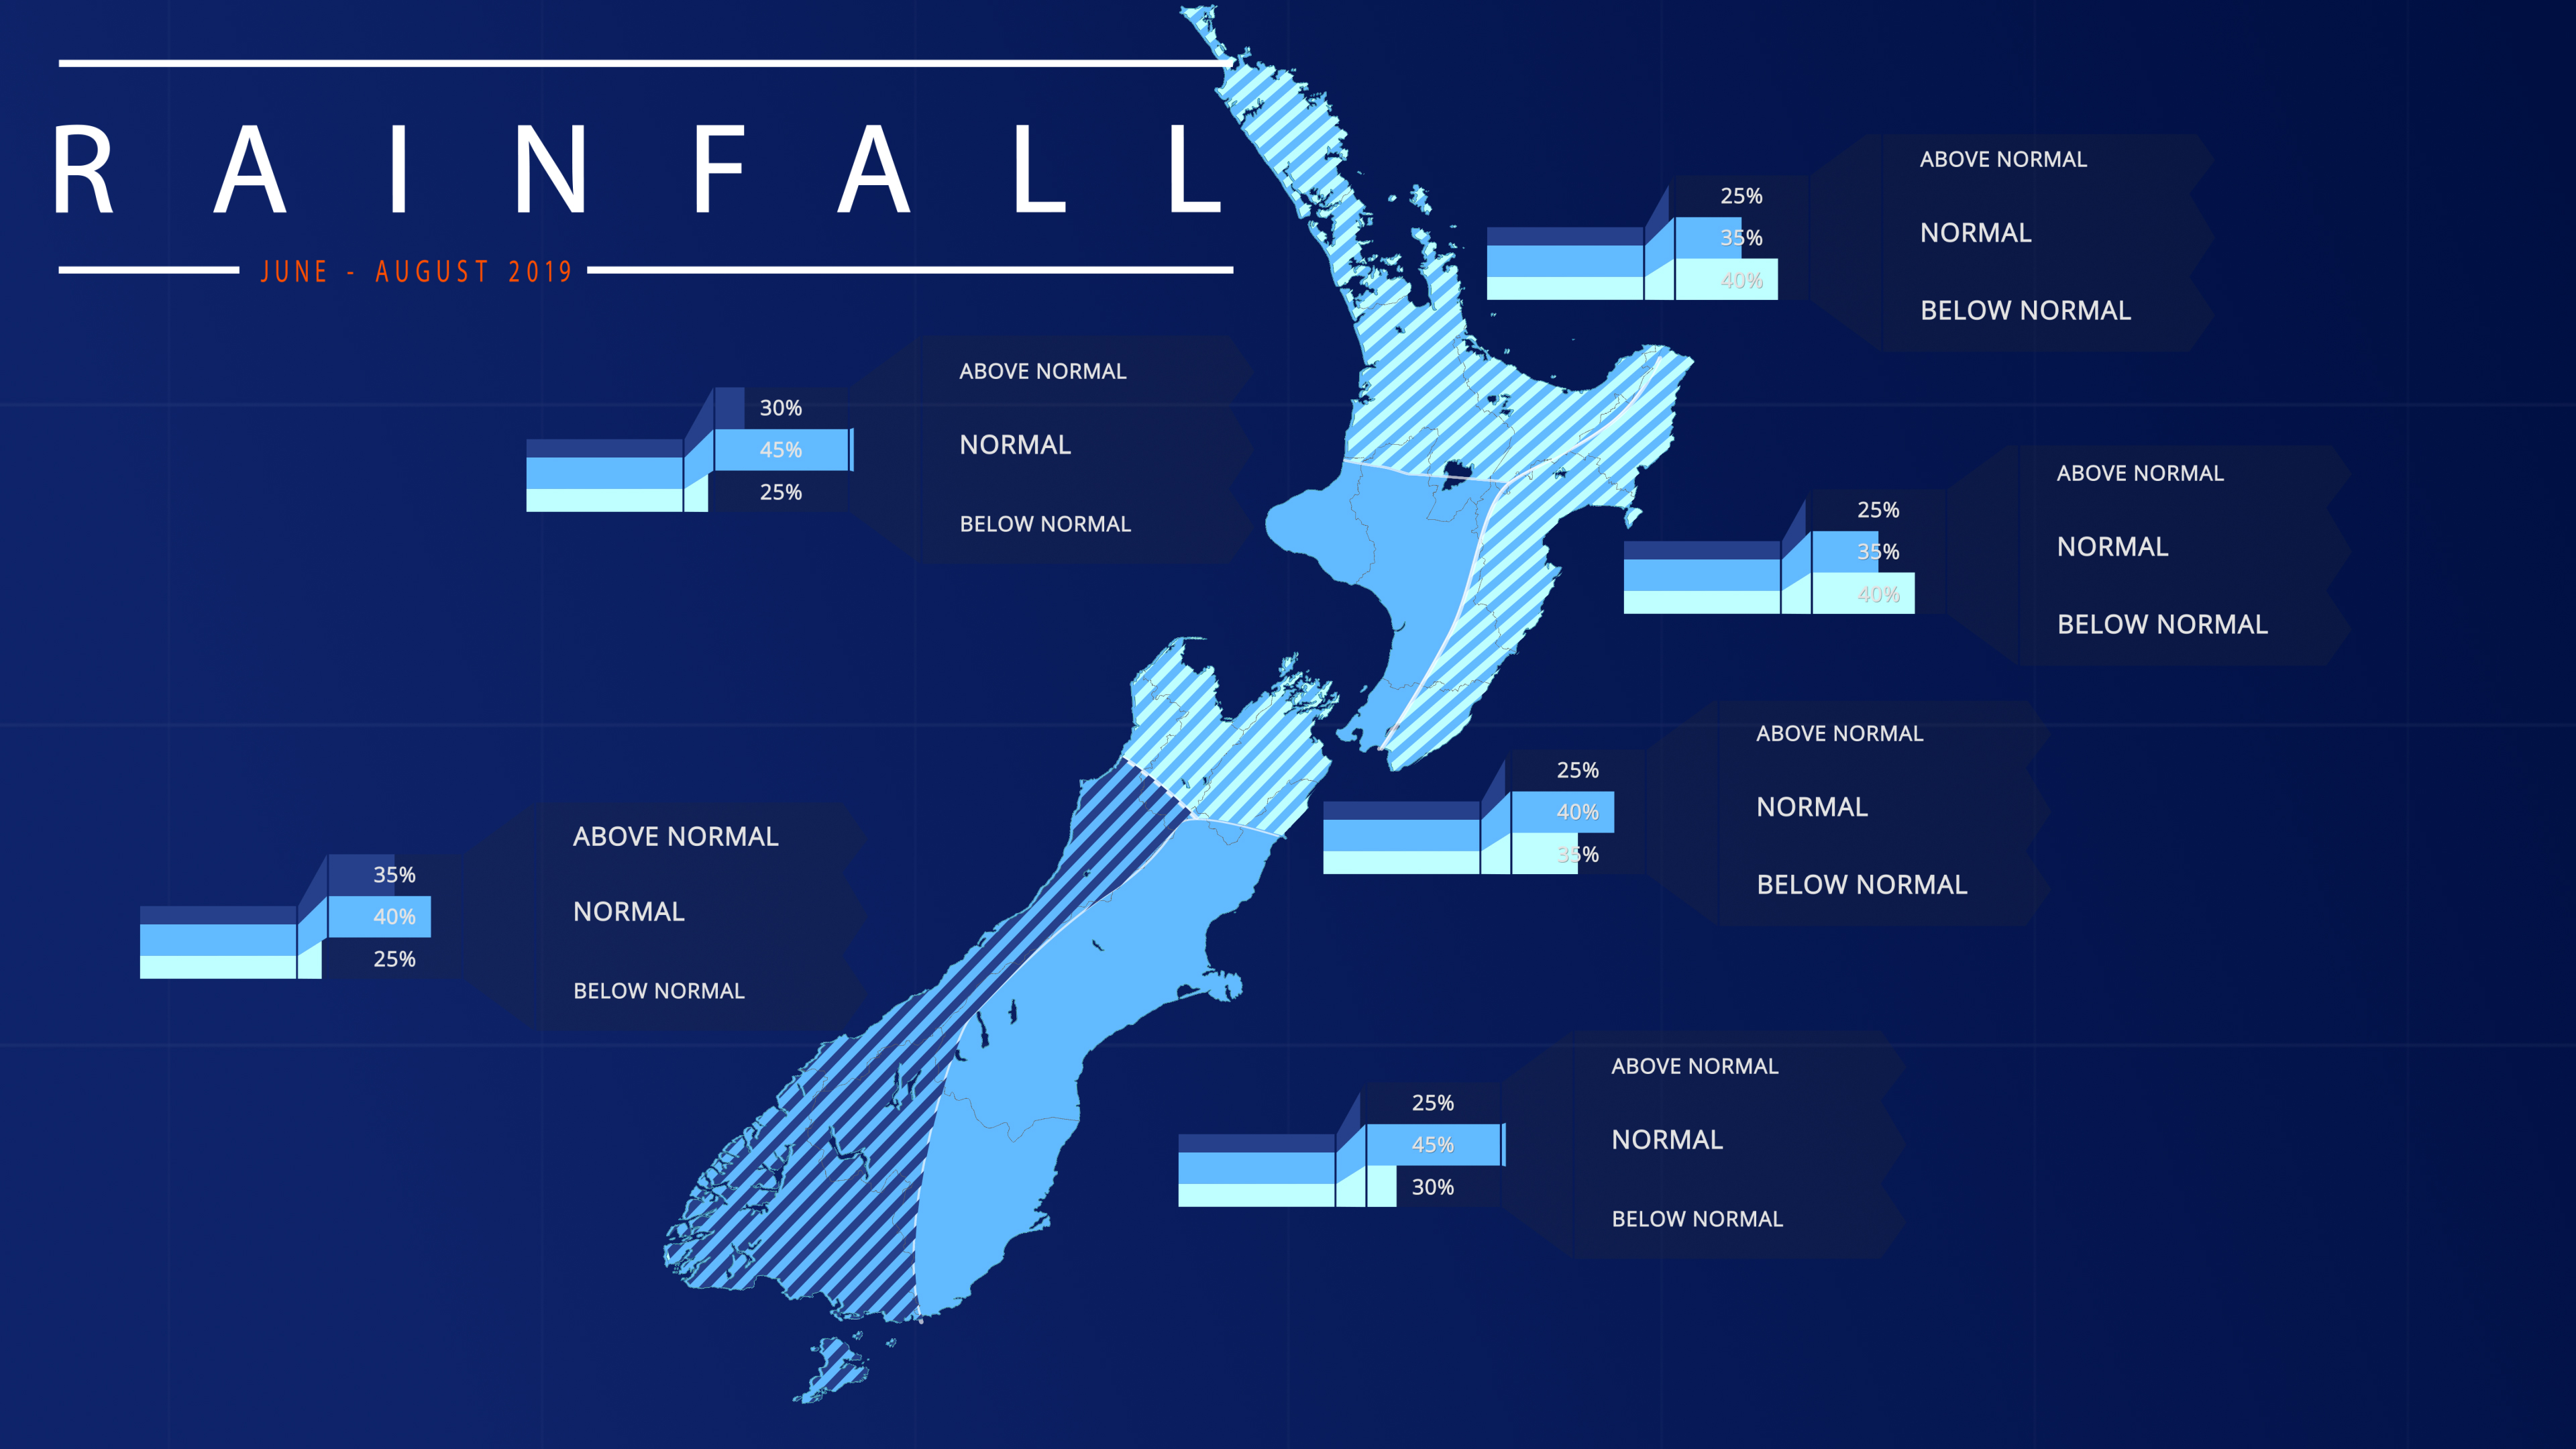
- Rainfall is about equally likely to be below normal or near normal in the north and east of the North Island and in the north of the South Island, most likely to be near normal in the east of the South Island and west of the North Island, and about equally likely to be above normal or near normal in the west of the South Island.
- Influenced by El Niño, enhanced westerly wind flows may promote heavy rainfall events for the west of the South Island, especially since regional sea surface temperatures (SSTs) remain above average.
NIWA Principal Scientist Chris Brandolino and Meteorologist Ben Noll host New Zealand's climate outlook for winter.
June – August 2019 temperatures are forecast to be above average in the east of the South Island (50% chance) and about equally likely to be above average (45% chance) or near average (40% chance) in all remaining regions of New Zealand. Despite a low chance for a winter season with below average temperatures, cold snaps and frosts remain likely to occur.
June – August 2019 rainfall is about equally likely to be near normal (40% chance) or above normal (35% chance) in the west of the South Island, most likely to be near normal (45% chance) in the east of the South Island and west of the North Island, and about equally likely to be below normal (35-40% chance) or near normal (35-40% chance) for all remaining regions of New Zealand.
June – August 2019 soil moisture levels and river flows are most likely to be below normal (55% chance) in the north of the North Island and east of the South Island. For the east of the North Island and north of the South Island, soil moisture levels and river flows are about equally likely to be near normal (40% chance) or below normal (35-40% chance), with near normal soil moisture levels and river flows likely (40-45% chance) for the west of the North Island. For the west of the South Island, soil moisture levels and river flows are about equally likely to be near normal (35-40% chance) or above normal (35-40% chance).
Regional predictions for the June – August 2019 season
Northland, Auckland, Waikato, Bay of Plenty
The table below shows the probabilities (or percent chances) for each of three categories: above average, near average, and below average. In the absence of any forecast guidance there would be an equal likelihood (33% chance) of the outcome being in any one of the three categories. Forecast information from local and global guidance models is used to indicate the deviation from equal chance expected for the coming three-month period, with the following outcomes the most likely (but not certain) for this region:
- Temperatures are about equally likely to be near average (40% chance) or above average (45% chance).
- Rainfall totals are about equally likely to be near normal (35% chance) or below normal (40% chance).
- Soil moisture levels and river flows are most likely to be below normal (55% chance).
The full probability breakdown is:
|
Temperature |
Rainfall |
Soil moisture |
River flows |
|
|
Above average |
45 |
25 |
20 |
20 |
|
Near average |
40 |
35 |
25 |
25 |
|
Below average |
15 |
40 |
55 |
55 |
Central North Island, Taranaki, Whanganui, Manawatu, Wellington
Probabilities are assigned in three categories: above average, near average, and below average.
- Temperatures are about equally likely to be near average (40% chance) or above average (45% chance).
- Rainfall totals are most likely to be near normal (45% chance) range.
- Soil moisture levels and river flows are most likely to be in the near normal (40% chance) range.
The full probability breakdown is:
|
Temperature |
Rainfall |
Soil moisture |
River flows |
|
|
Above average |
45 |
30 |
30 |
30 |
|
Near average |
40 |
45 |
40 |
40 |
|
Below average |
15 |
25 |
30 |
30 |
Gisborne, Hawke’s Bay, Wairarapa
Probabilities are assigned in three categories: above average, near average, and below average.
- Temperatures are about equally likely to be near average (40% chance) or above average (45% chance).
- Rainfall totals, soil moisture levels and river flows are about equally likely to be near normal (40% chance) or below normal (35% chance).
The full probability breakdown is:
|
Temperature |
Rainfall |
Soil moisture |
River flows |
|
|
Above average |
45 |
25 |
25 |
25 |
|
Near average |
40 |
40 |
40 |
40 |
|
Below average |
15 |
35 |
35 |
35 |
Tasman, Nelson, Marlborough, Buller
Probabilities are assigned in three categories: above average, near average, and below average.
- Temperatures are about equally likely to be above average (45% chance) or near average (40% chance).
- Rainfall totals are about equally likely to be near normal (40% chance) or below normal (35% chance).
- Soil moisture levels and river flows are equally likely to be below normal (35% chance) or near normal (35% chance).
The full probability breakdown is:
|
Temperature |
Rainfall |
Soil moisture |
River flows |
|
|
Above average |
45 |
25 |
30 |
30 |
|
Near average |
40 |
40 |
35 |
35 |
|
Below average |
15 |
35 |
35 |
35 |
West Coast, Alps and foothills, inland Otago, Southland
Probabilities are assigned in three categories: above average, near average, and below average.
- Temperatures are about equally likely to be above average (45% chance) or near average (40% chance).
- Rainfall totals, soil moisture levels and river flows are about equally likely to be near normal (35-40% chance) or above normal (35-40% chance).
The full probability breakdown is:
|
Temperature |
Rainfall |
Soil moisture |
River flows |
|
|
Above average |
45 |
35 |
40 |
40 |
|
Near average |
40 |
40 |
35 |
35 |
|
Below average |
15 |
25 |
25 |
25 |
Coastal Canterbury, east Otago
Probabilities are assigned in three categories: above average, near average, and below average.
- Temperatures are most likely to be above average (50% chance).
- Rainfall totals are most likely to be in the near normal (45% chance) range.
- Soil moisture levels and river flows are most likely to be below normal (55% chance).
The full probability breakdown is:
|
Temperature |
Rainfall |
Soil moisture |
River flows |
|
|
Above average |
50 |
25 |
20 |
20 |
|
Near average |
35 |
45 |
25 |
25 |
|
Below average |
15 |
30 |
55 |
55 |
Graphical representation of the regional probabilities

Background
During May 2019, the atmosphere continued to respond to a warm pool of water in the central and western Pacific, with anomalous rainfall and convection centred along and just west of the International Dateline. The NINO3.4 Index anomaly for May (to the 26th) was +0.72˚C, however this was the second consecutive month the value has decreased. The NINO1+2 Index (in the far eastern Pacific) had an anomaly of +0.38˚C, down nearly 0.20˚C from last month.
Overall, rainfall and SST patterns remained consistent with a weak, central Pacific El Niño. The presence of enhanced convective forcing along the equator in the central and western Pacific remained consistent with El Niño-Modoki conditions.
However, there are signals that a trend toward neutral conditions may occur toward the end of the three-month period.
The Madden-Julian Oscillation (MJO) was active in phases 5-6-7-8 in May. In early June, the MJO is forecast to move through phases 1 and 2. Guidance points to large scale ascent from the Indian Ocean to the International Dateline from mid-June through to early July. This may drive several rounds of wet weather during June and, after a cooler than average start to the month, temperatures could moderate.
The Southern Oscillation Index (SOI) decreased (preliminary value -0.7), compared to April (0.0).
The probability for oceanic El Niño conditions, according to the consensus from international models, is 66% for the June – August period. For September – November period, the probability is 56%, and for December 2019 – February 2020, El Niño remains the most likely outcome at 56%.
New Zealand’s coastal water temperatures for May 2019 have cooled for all areas compared to April, but remain above average for the time of year except in the east of the North Island. Sea surface temperatures over the Tasman Sea and far Southwest Pacific remain, in general, above average for the time of year with anomalies of around +1.0˚C, with pockets of +2.0˚C.
New Zealand Coastal Sea Surface Temperatures during May 2019[1]
|
North NI |
West NI |
East NI |
North SI |
West SI |
East SI |
|
+0.38˚C |
+0.30˚C |
-0.09˚C |
+0.56˚C |
+0.97˚C |
+0.90˚C |
Warmer than average sea surface temperatures are forecast to persist during the coming three-month period. These warm seas may contribute to spells of unseasonable warmth and invigorate low pressure systems as they approach New Zealand from the west.
The Southern Annular Mode (SAM) was positive for the first half of May and then became strongly negative for the second half of the month. The SAM is forecast to remain negative to start the winter season and is an atmospheric indicator supportive of the active, stormy start. Thereafter, there are signs of a trend toward neutral.
Download
Seasonal Climate Outlook June - August 2019. [PDF3.5MB]
Contacts
Chris Brandolino, Principal Scientist – Forecasting, NIWA National Climate Centre Tel (09) 375 6335, Mobile (027) 886 0014
Ben Noll, Meteorologist/Forecaster, NIWA National Climate Centre Tel (09) 375 6334, Mobile (027) 405 3052
Notes to reporters and editors
- NIWA’s outlooks indicate the likelihood of climate conditions being at, above, or below average for the season as a whole. They are not ‘weather forecasts’. It is not possible to forecast precise weather conditions three months ahead of time.
- The outlooks are the result of the expert judgment of NIWA’s climate scientists. They take into account observations of atmospheric and ocean conditions and output from global and local climate models. The presence of El Niño or La Niña conditions and the sea surface temperatures around New Zealand can be a useful indicator of likely overall climate conditions for a season.
- The outlooks state the probability for above average conditions, near average conditions, and below average conditions for rainfall, temperature, soil moisture, and river flows. For example, for winter (June–July–August) 2007, for all the North Island, we assigned the following probabilities for temperature: · Above average: 60 per cent · Near average: 30 per cent · Below average: 10 per cent We therefore concluded that above average temperatures were very likely.
- This three-way probability means that a random choice would be correct only 33 per cent (or one-third) of the time. It would be like randomly throwing a dart at a board divided into three equal parts, or throwing a dice with three numbers on it. An analogy with coin tossing (a two-way probability) is not correct.
- A 50 per cent ‘hit rate’ is substantially better than guesswork, and comparable with the skill level of the best overseas climate outlooks. See, for example, analysis of global outlooks issued by the International Research Institute for Climate and Society based in the US published in the Bulletin of the American Meteorological Society (Goddard, L., A. G. Barnston, and S. J. Mason, 2003: Evaluation of the IRI’s “net assessment” seasonal climate forecasts 1997–2001. Bull. Amer. Meteor. Soc., 84, 1761–1781).
- Each month, NIWA publishes an analysis of how well its outlooks perform. This is available online and is sent to about 3500 recipients of NIWA’s newsletters, including many farmers.
- All outlooks are for the three months as a whole. There will inevitably be wet and dry days, and hot and cold days, within a season. The exact range in temperature and rainfall within each of the three categories varies with location and season. However, as a guide, the “near average” or middle category for the temperature predictions includes deviations up to ±0.5°C for the long-term mean, whereas for rainfall the “near normal” category lies between approximately 80 per cent and 115 per cent of the long-term mean.
- The seasonal climate outlooks are an output of a scientific research programme, supplemented by NIWA’s Capability Funding. NIWA does not have a government contract to produce these outlooks.
- Where probabilities are within 5% of one another, the term “about equally” is used.