Outlook Summary
- ENSO neutral conditions continued during November 2019, although the Southern Oscillation Index (SOI) and sea surface temperatures (SSTs) were on the El Niño side of neutral.
- Oceanic ENSO neutral will most likely continue (70% chance) over the next three months.
- The Indian Ocean Dipole (IOD) along with local and regional SSTs are expected to be the main climate drivers for New Zealand to start the summer season. More specifically:
- A strongly positive IOD will gradually weaken but continue to promote stronger and more frequent westerly quarter winds through at least December.
- Tasman Sea and NZ coastal sea surface temperatures increased during November and are now above average in some areas; this is expected to persist during the summer season. Potential impacts include increased chances for above average warmth and/or the modification of cooler air masses as they move toward NZ.
- December 2019 – February 2020 air pressure is forecast to be lower than normal to the west and south of New Zealand with higher than normal air pressure north of the country. This is expected to be associated with a westerly quarter air flow anomaly, especially during December. In the second half of the season, due to an expected shift in large scale climate drivers, persistent westerly quarter winds may ease and tend northeasterly quarter.
- A potential transition from westerly winds in December to northeasterly quarter winds later in the summer could have an impact seasonal rainfall (e.g. areas that are wetter (drier) in early summer may be drier (wetter) for the second half of the season).
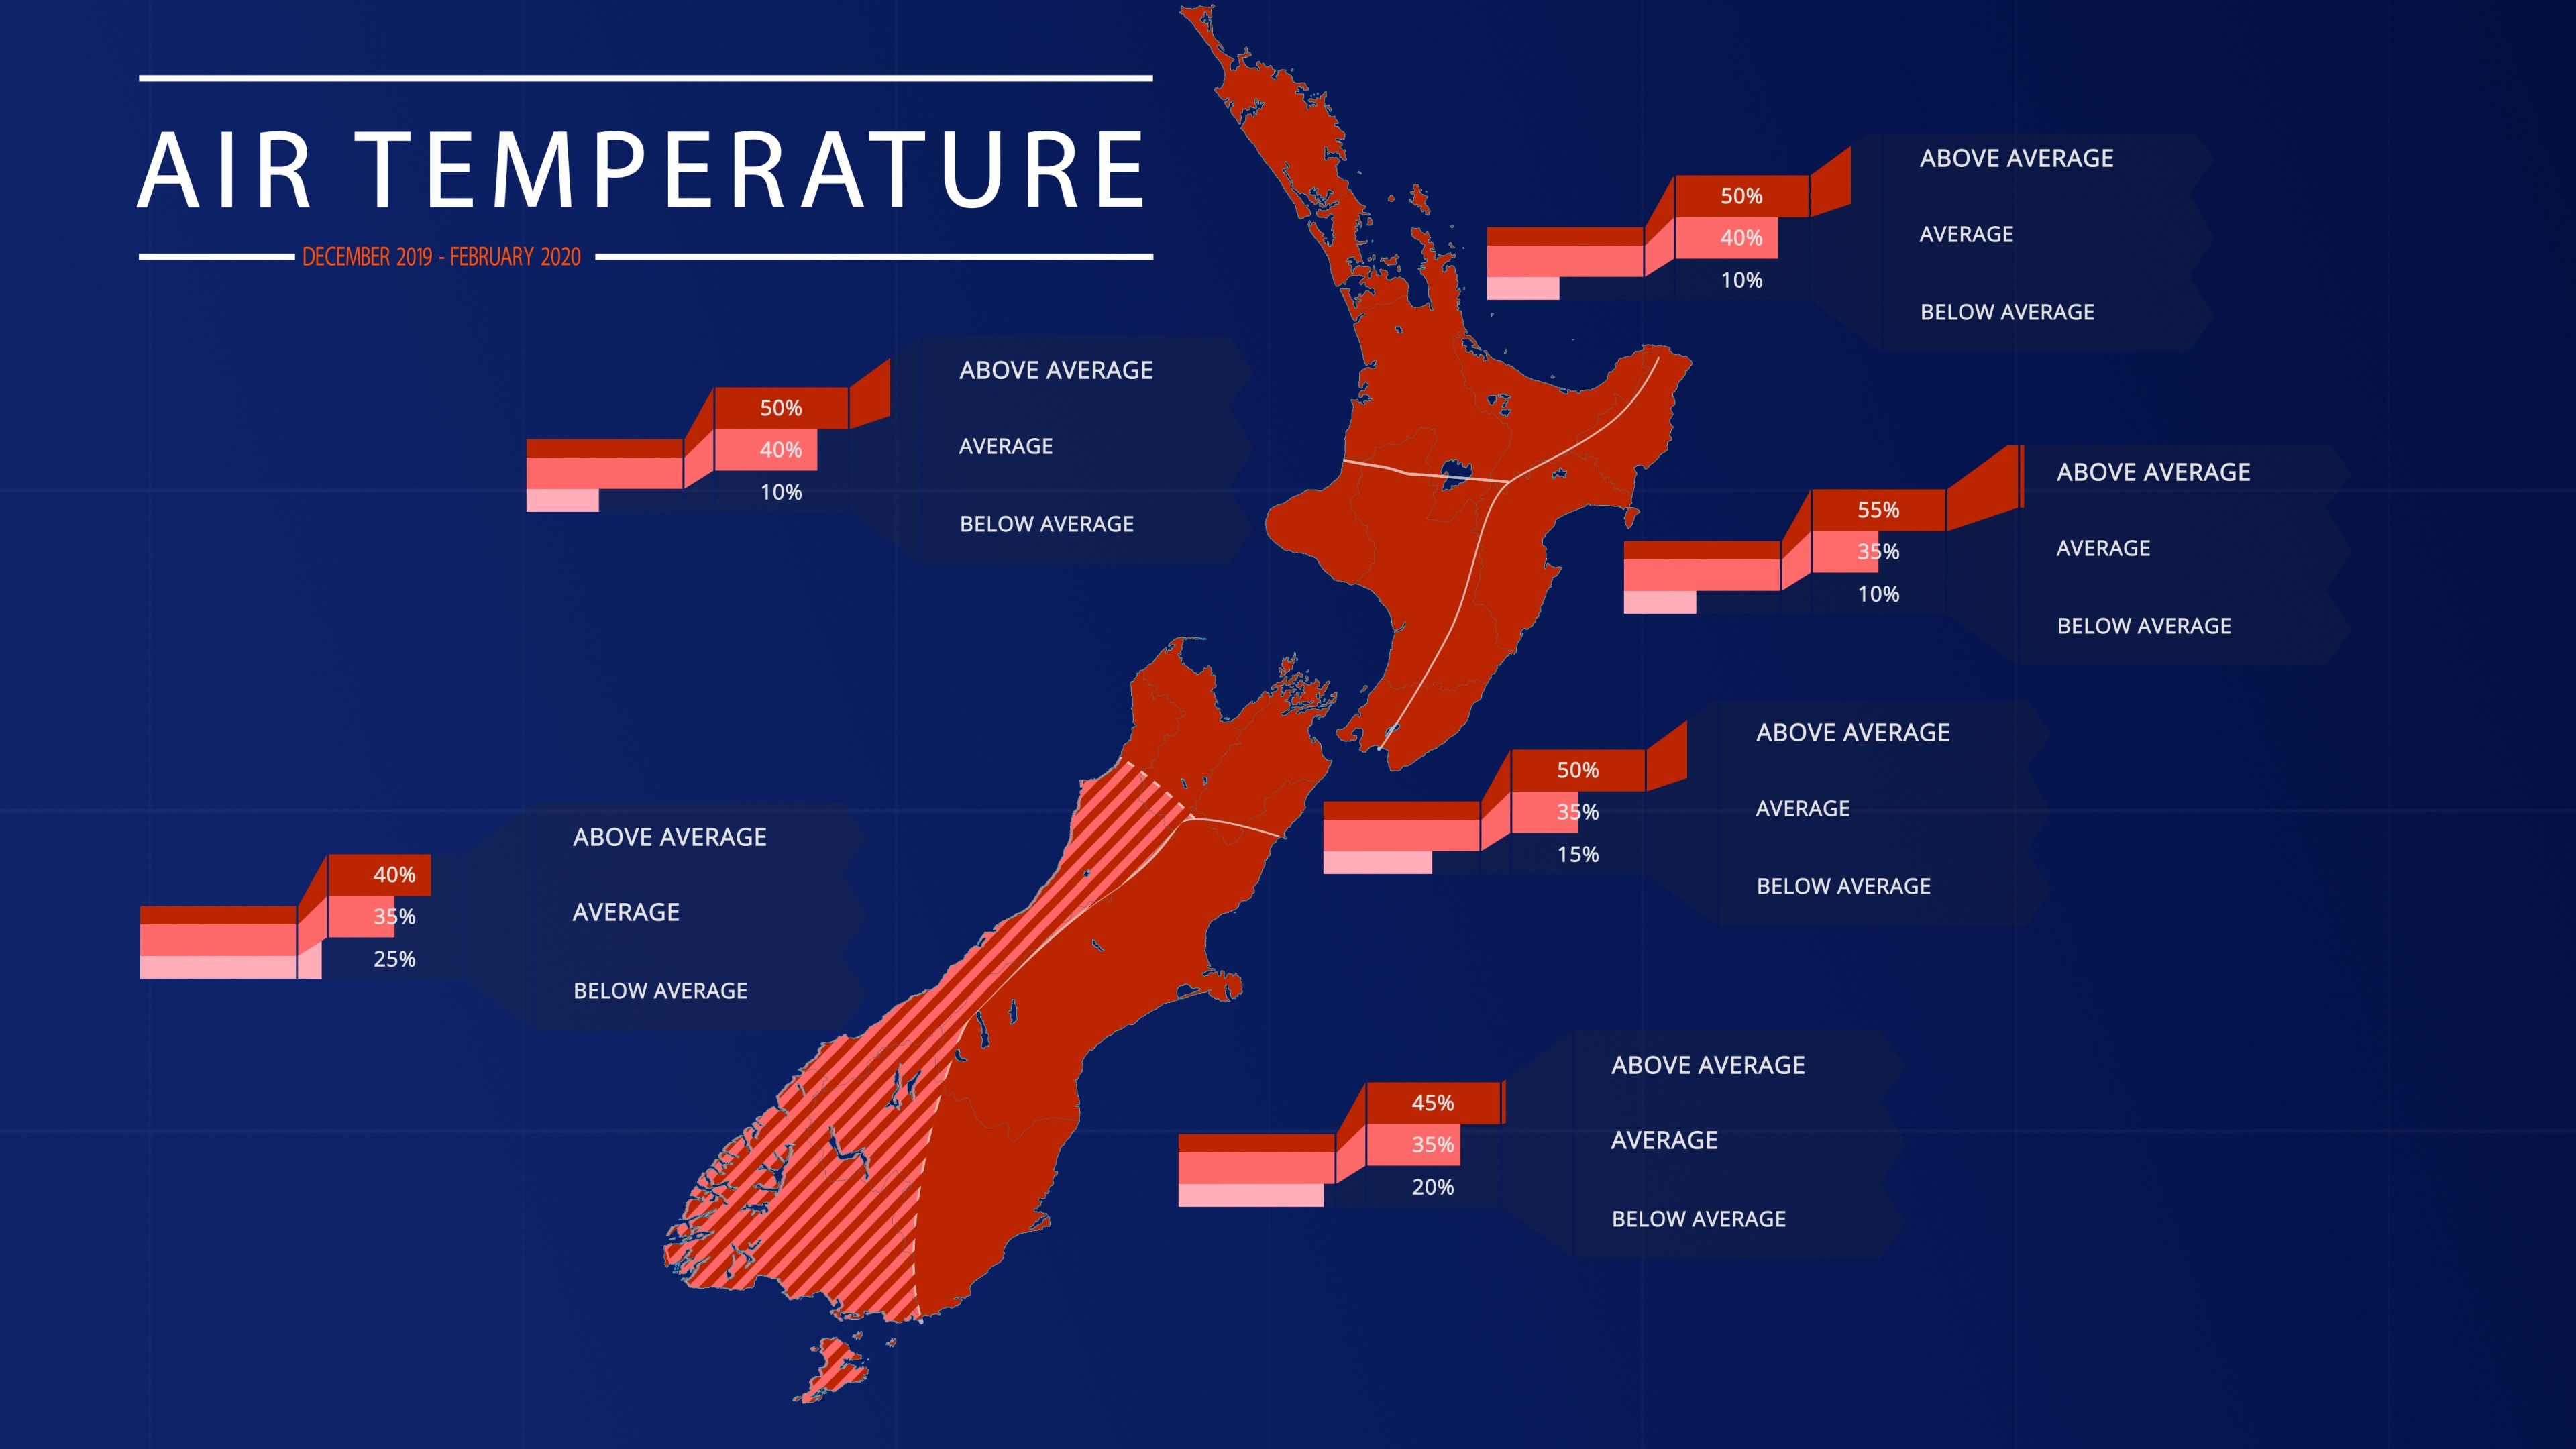
- Temperatures for the summer season are expected to be above average for New Zealand, apart from the west of the South Island where there are about equal chances for near average or above average temperatures.
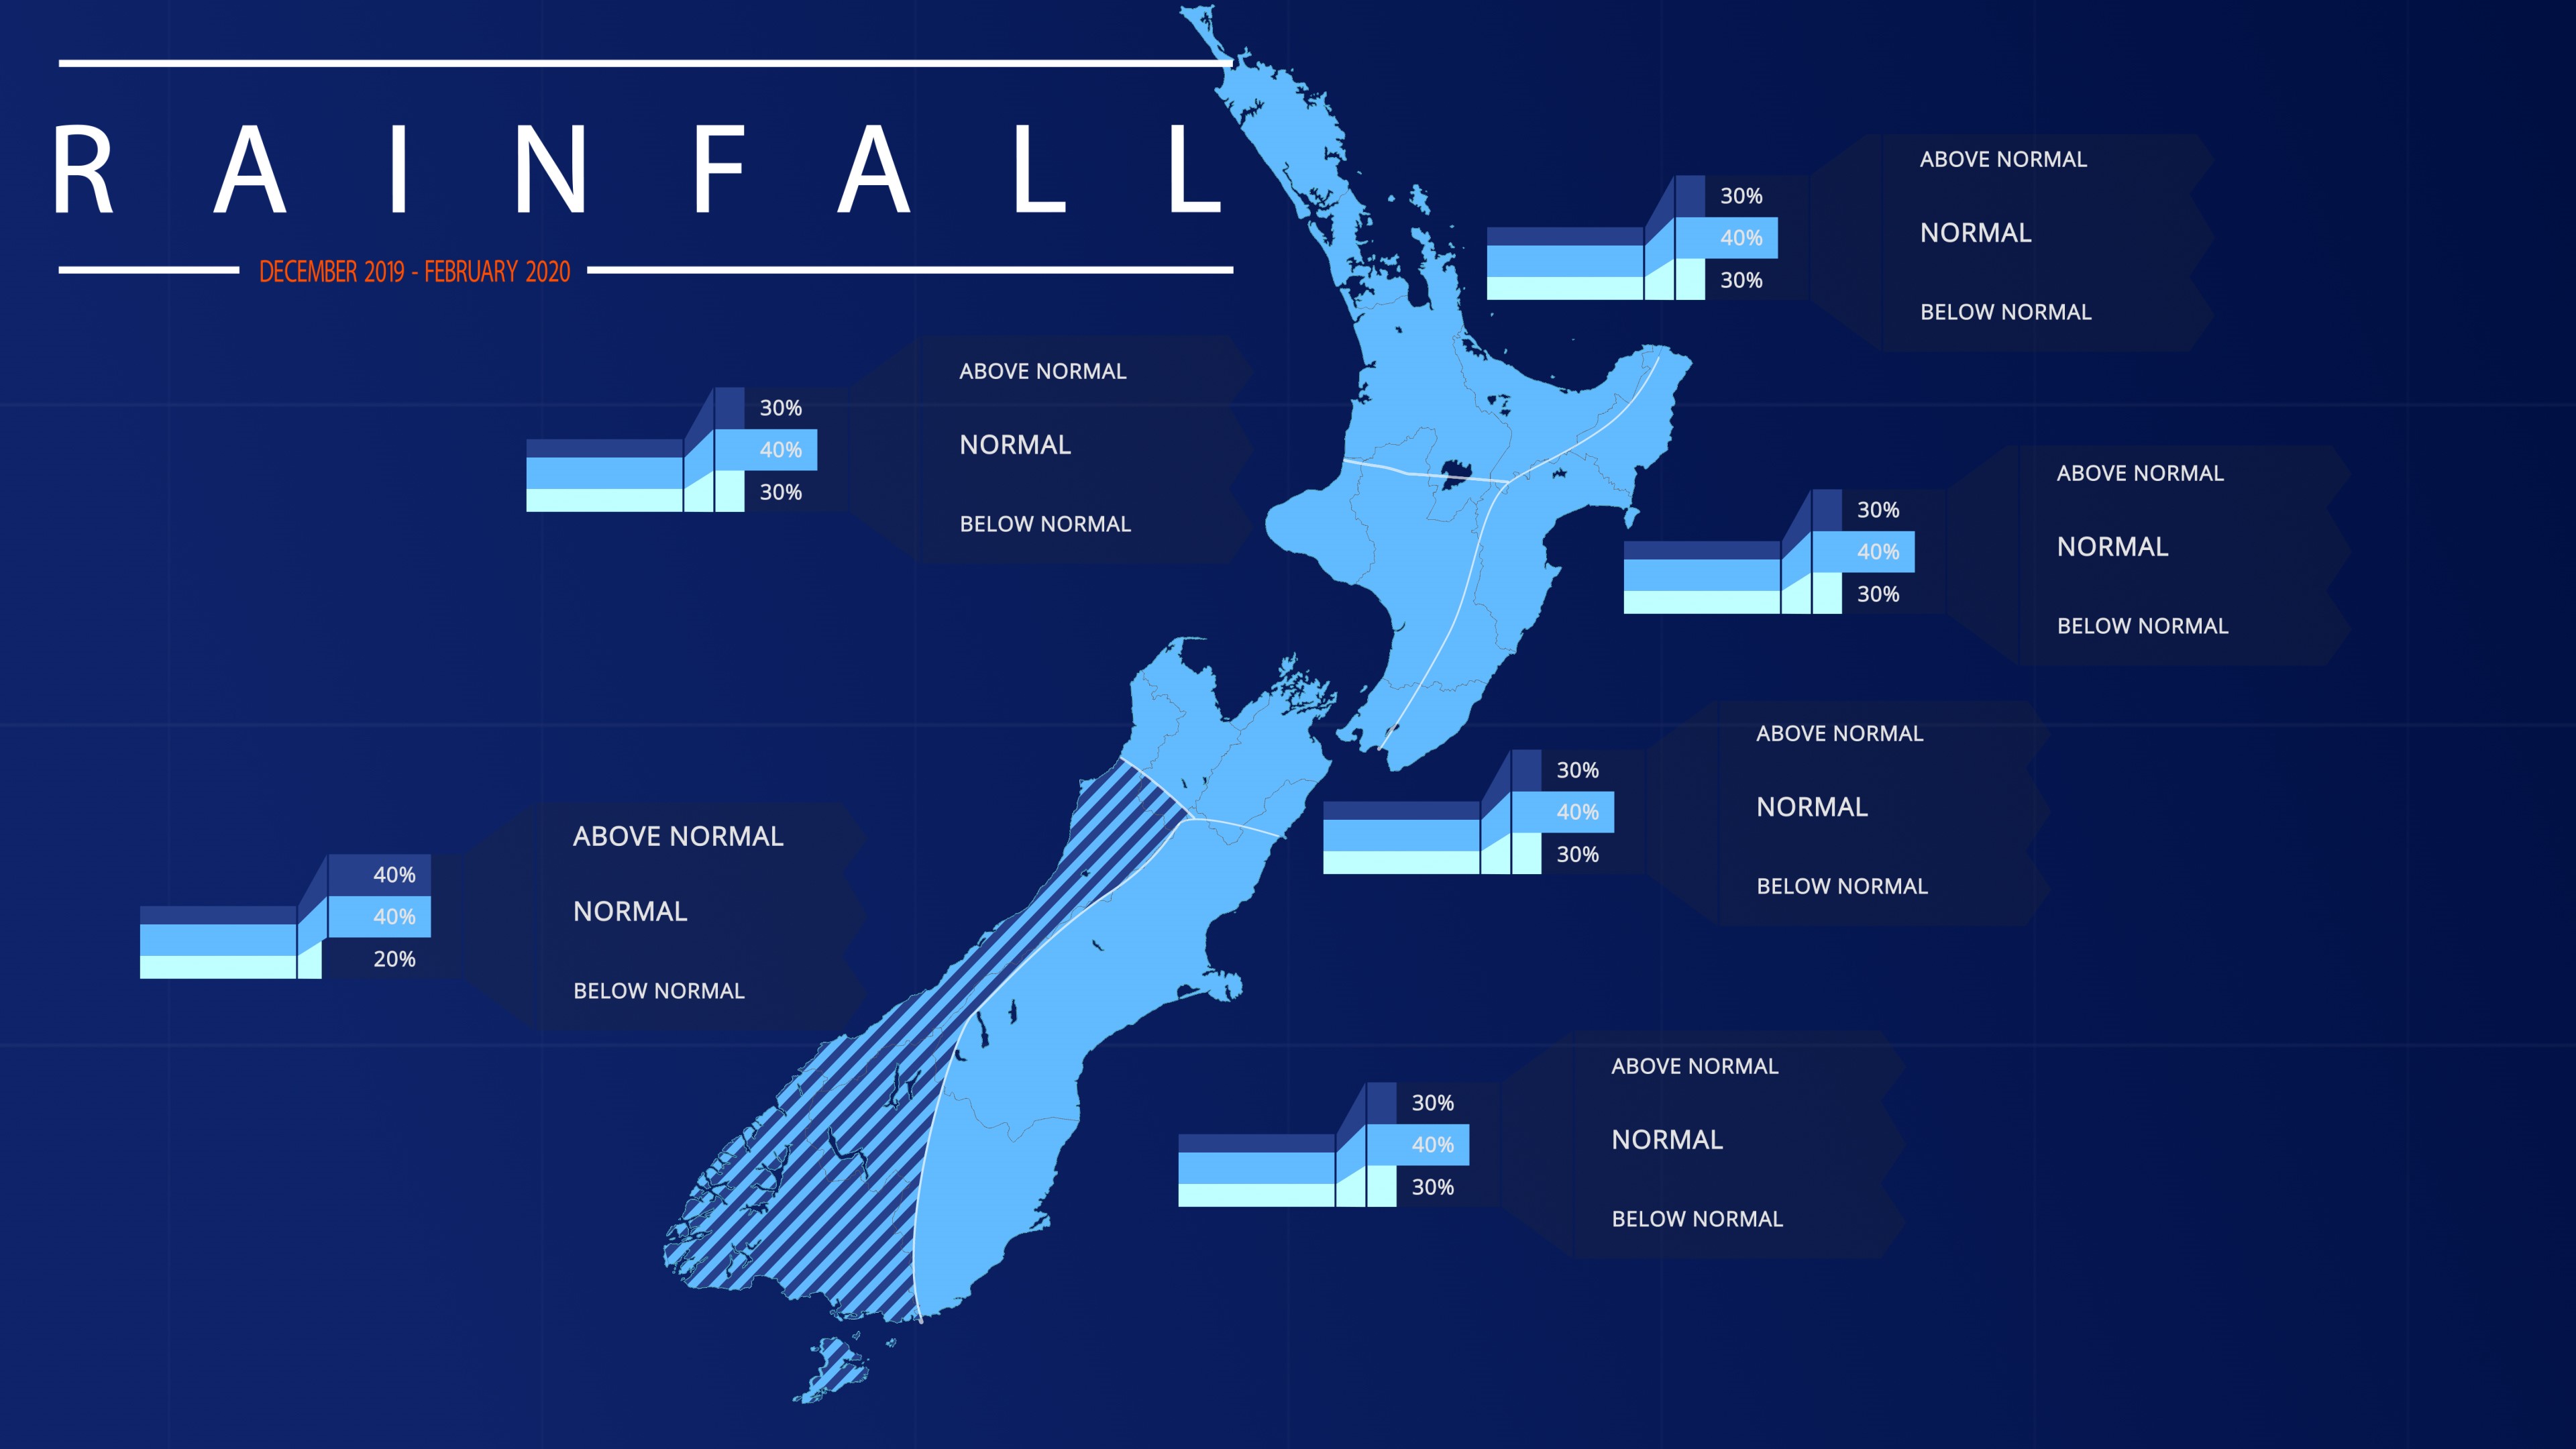
- Rainfall is projected to near normal for most of New Zealand, except for the west of the South Island where near normal or above normal summer rainfall is equally likely.
NIWA's Chris Brandolino and Ben Noll break down the expected climate patterns for the season.
Air Temperature December 2019 – February 2020 temperatures have about equal chances of being near average (35% chance) or above average (40% chance) for the west of the South Island. All other regions of New Zealand will most likely experience above average summer temperatures (45-55% chance).
Rainfall December 2019 – February 2020 rainfall is equally likely to be near normal (40% chance) or above normal (40% chance) for the west of the South Island. Near normal rainfall is most likely for the rest of the country.
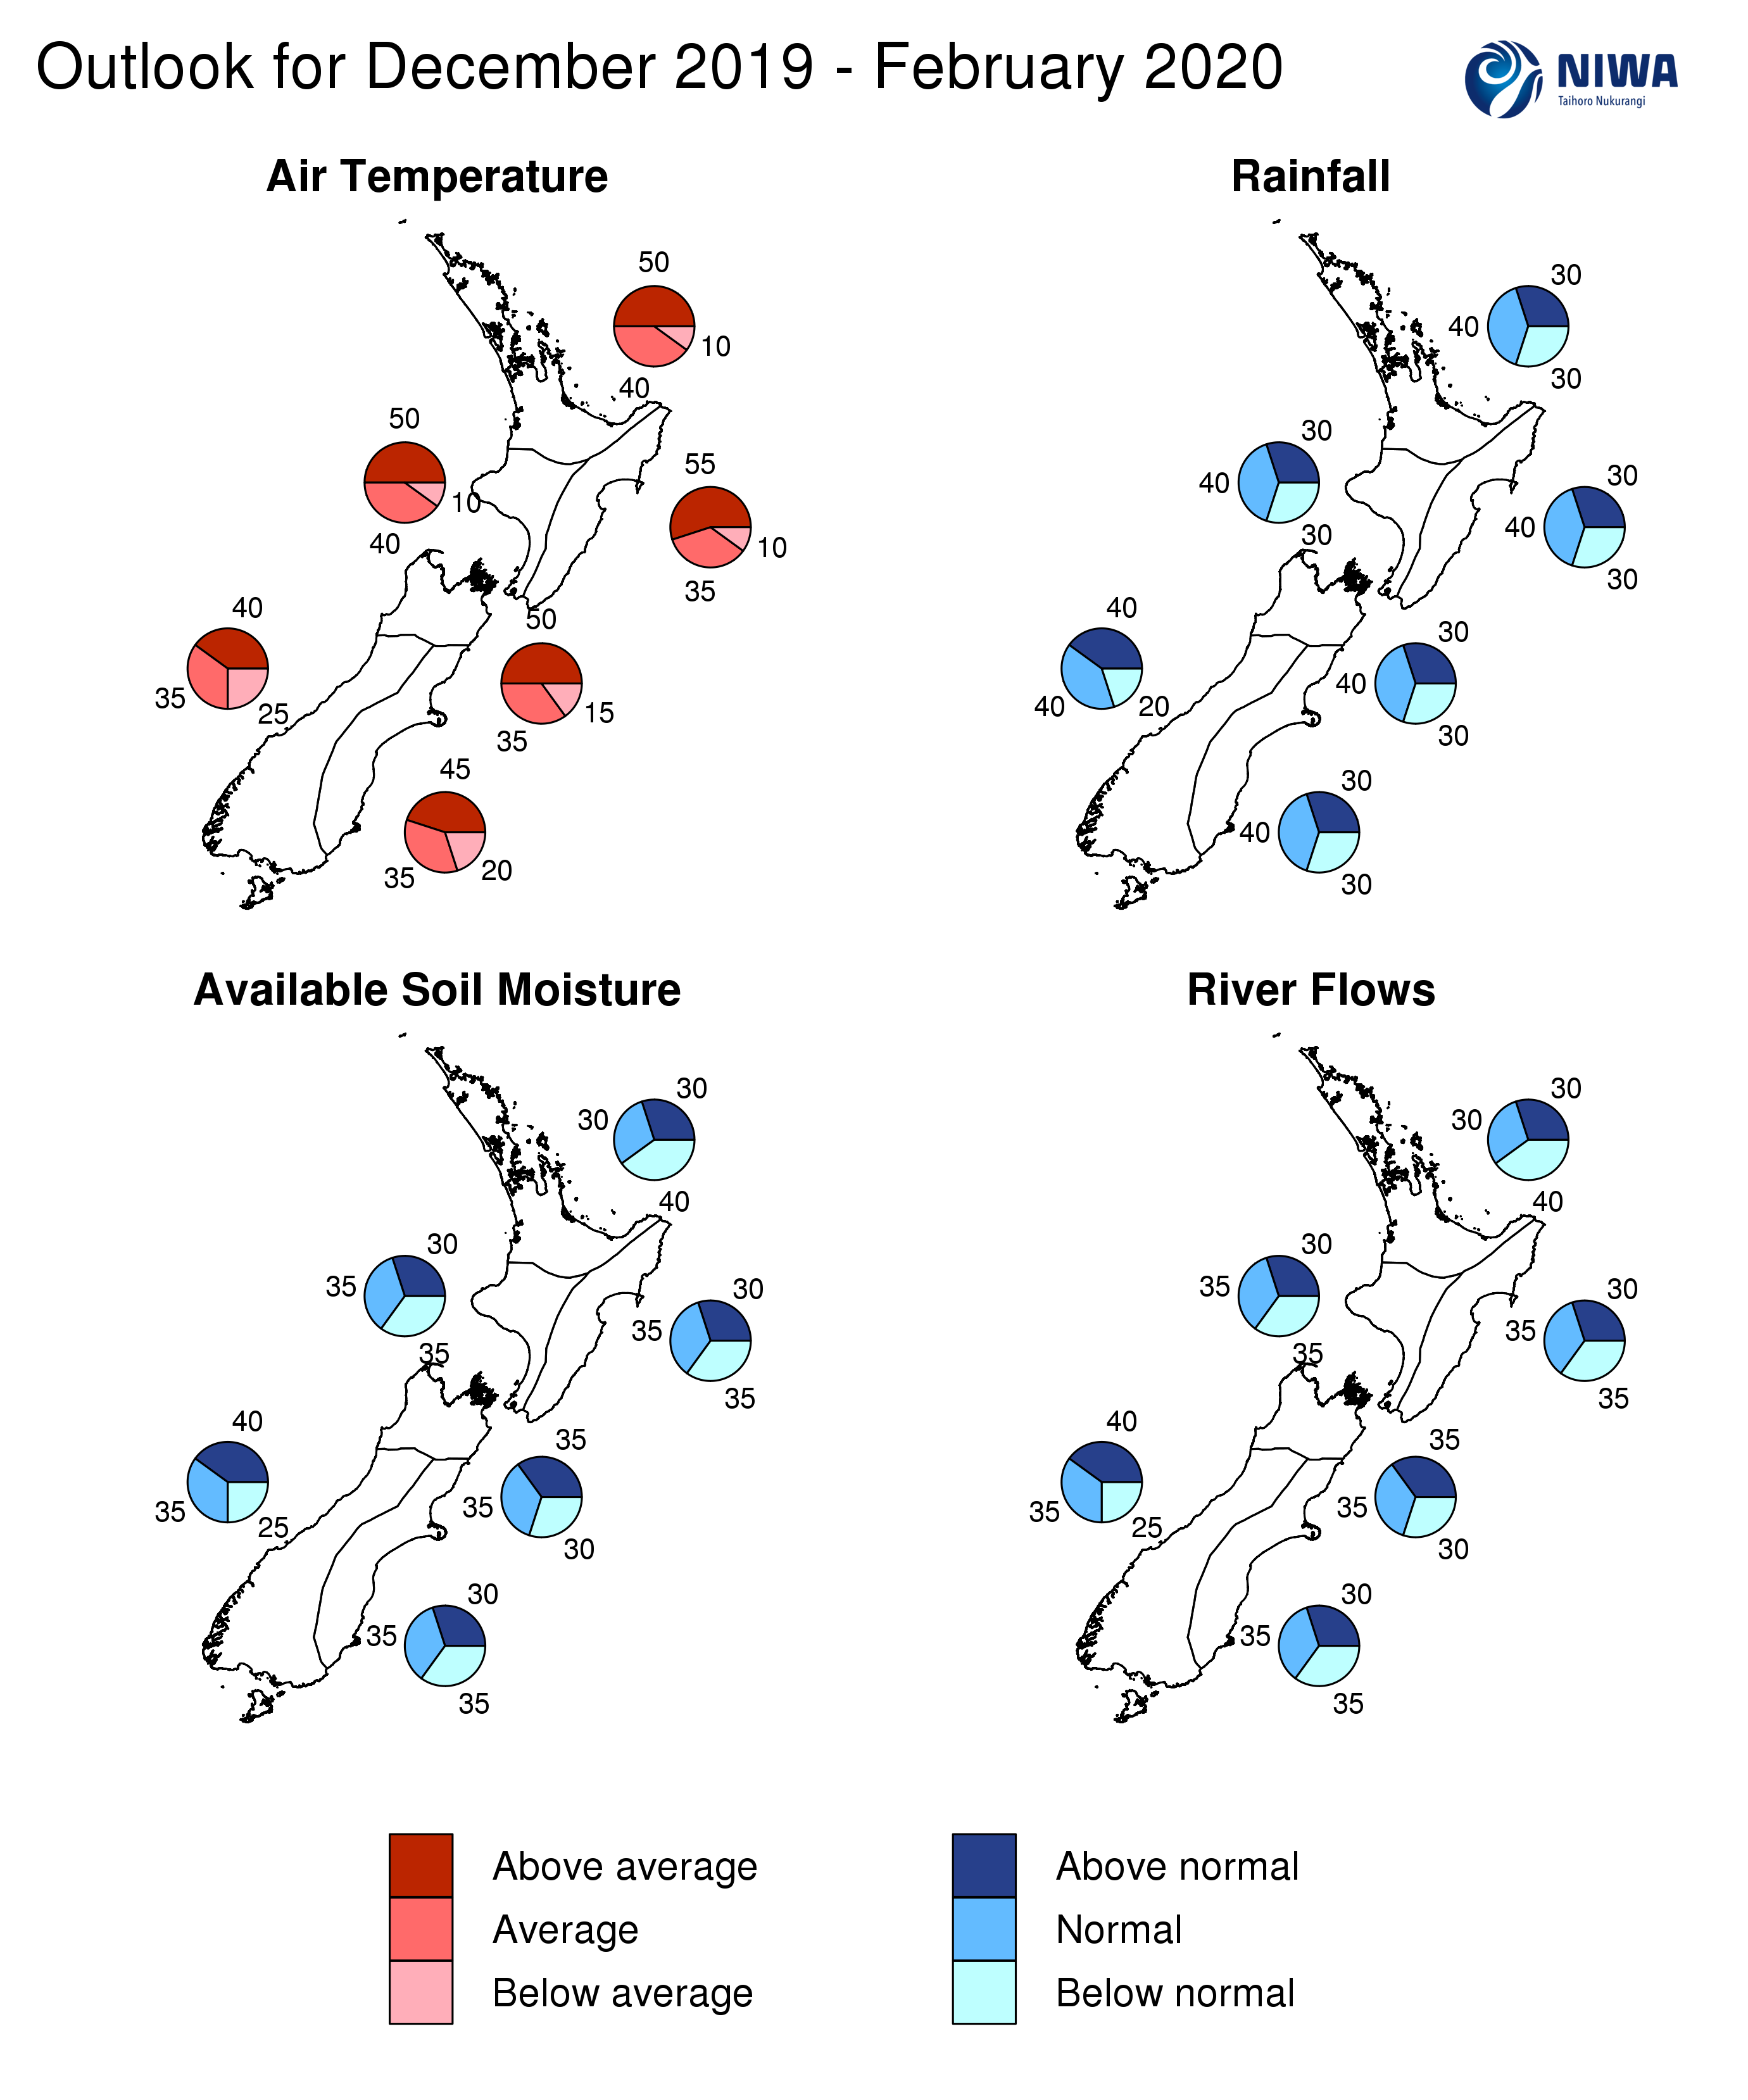
Soil Moisture December 2019 – February 2020 soil moisture levels and river flows are most likely to be below normal (40% chance) for the north of the North Island and about equally likely to be near normal (35% chance) or above normal (40% chance) in the west of the South Island. For all other regions of New Zealand, there is no decisive indication for a particular outcome.
Regional predictions for the December 2019 – February 2020 season
Northland, Auckland, Waikato, Bay of Plenty
The table below shows the probabilities (or percent chances) for each of three categories: above average, near average, and below average. In the absence of any forecast guidance there would be an equal likelihood (33% chance) of the outcome being in any one of the three categories. Forecast information from local and global guidance models is used to indicate the deviation from equal chance expected for the coming three-month period, with the following outcomes the most likely (but not certain) for this region:
- Temperatures are likely to be above average (50% chance).
- Rainfall totals are most likely to be near normal (40% chance).
- Soil moisture levels and river flows are most likely to be below normal (40% chance).
The full probability breakdown is:
|
Temperature |
Rainfall |
Soil moisture |
River flows |
|
|
Above average |
50 |
30 |
30 |
30 |
|
Near average |
40 |
40 |
30 |
30 |
|
Below average |
10 |
30 |
40 |
40 |
Central North Island, Taranaki, Whanganui, Manawatu, Wellington
Probabilities are assigned in three categories: above average, near average, and below average.
- Temperatures are likely to be above average (50% chance).
- Rainfall totals are most likely to be near normal (40% chance).
- Soil moisture levels and river flows will likely reflect climatology as there are no favoured outcomes (30-35% chance).
The full probability breakdown is:
|
Temperature |
Rainfall |
Soil moisture |
River flows |
|
|
Above average |
50 |
30 |
30 |
30 |
|
Near average |
40 |
40 |
35 |
35 |
|
Below average |
10 |
30 |
35 |
35 |
Gisborne, Hawke’s Bay, Wairarapa
Probabilities are assigned in three categories: above average, near average, and below average.
- Temperatures are likely to be above average (55% chance).
- Rainfall totals are most likely to be near normal (40% chance).
- Soil moisture levels and river flows will most likely reflect climatology as there are no favoured outcomes (30-35% chance).
The full probability breakdown is:
|
Temperature |
Rainfall |
Soil moisture |
River flows |
|
|
Above average |
55 |
30 |
30 |
30 |
|
Near average |
35 |
40 |
35 |
35 |
|
Below average |
10 |
30 |
35 |
35 |
Tasman, Nelson, Marlborough, Buller
Probabilities are assigned in three categories: above average, near average, and below average.
- Temperatures are likely to be above average (50% chance).
- Rainfall totals are most likely to be near normal (40% chance).
- Soil moisture levels and river flows will most likely reflect climatology as there are no favoured outcomes (30-35% chance).
The full probability breakdown is:
|
Temperature |
Rainfall |
Soil moisture |
River flows |
|
|
Above average |
50 |
30 |
35 |
35 |
|
Near average |
40 |
40 |
35 |
35 |
|
Below average |
10 |
30 |
30 |
30 |
West Coast, Alps and foothills, inland Otago, Southland
Probabilities are assigned in three categories: above average, near average, and below average.
- Temperatures are about equally likely to be near average (35% chance) or above average (40% chance).
- Rainfall totals are equally likely to be near normal (40% chance) or above normal range (40% chance).
- Soil moisture levels and river flows are about equally likely to be near normal (35% chance) or above normal (40% chance).
The full probability breakdown is:
|
Temperature |
Rainfall |
Soil moisture |
River flows |
|
|
Above average |
40 |
40 |
40 |
40 |
|
Near average |
35 |
40 |
35 |
35 |
|
Below average |
25 |
20 |
25 |
25 |
Coastal Canterbury, east Otago
Probabilities are assigned in three categories: above average, near average, and below average.
- Temperatures are likely to be above average (45% chance).
- Rainfall totals are most likely to be near normal (40% chance).
- Soil moisture levels and river flows will most likely reflect climatology as there are no favoured outcomes (30-35% chance).
The full probability breakdown is:
|
Temperature |
Rainfall |
Soil moisture |
River flows |
|
|
Above average |
45 |
30 |
30 |
30 |
|
Near average |
35 |
40 |
35 |
35 |
|
Below average |
20 |
30 |
35 |
35 |
Graphical representation of the regional probabilities
Background
The NINO3.4 Index anomaly (in the central Pacific) for the month of November (through the 24th) warmed to +0.64˚C. Warmth was steadfast in the NINO4 region (west-central Pacific) with a monthly value of +0.89˚C.
Upper-oceanic heat content remained above average to the west of the Date Line. East of the Date Line, upper-oceanic heat content decreased to neutral or slightly negative anomalies over the past month. The ENSO status will most likely remain neutral over the next season; however, the atmosphere may respond to warmer than average SSTs in the tropical western Pacific Ocean. During November, above normal rainfall occurred across the tropical western Pacific, along and west of the Date Line. Well below normal rainfall occurred across Indonesia. This remained broadly consistent with El Niño Modoki-like conditions.
Trade winds were stronger than normal in early November before weakening in the second half of the month. During the first 10 days of December, weaker than normal trade winds are forecast in the vicinity of the NINO3 and NINO3.4 regions. Stronger than normal trade winds are then forecast across much of the basin from mid-December.
According to the consensus from international models, ENSO-neutral conditions are most likely (70% chance) for the December 2019 – February 2020 period. For the March – May 2020 period, the probability for ENSO-neutral conditions is 63% and 55% for the June – August 2020 period.
New Zealand’s coastal waters warmed during November 2019. The most anomalously warm waters are near the eastern South Island. More broadly, SSTs both west and east of New Zealand are above average. Near or slightly below average SSTs are located well north of New Zealand. The presence of above average regional SSTs will likely have some influence on New Zealand’s air temperatures during the summer season, either modifying any cooler air attempting to arrive from the southwest or enhancing warmth around the country.
New Zealand Coastal Sea Surface Temperatures during November 2019
|
North NI |
West NI |
East NI |
North SI |
West SI |
East SI |
|
+0.03˚C |
+0.25˚C |
+0.25C |
+0.39˚C |
+0.26˚C |
+0.78˚C |
The Southern Annular Mode (SAM) was decidedly negative for the month of November (in spite of this, temperatures for New Zealand were unusually warm). The SAM is forecast to remain negative into the second week of December. This supports westerly quarter winds along with an increased chance for wet conditions in the west of both islands, particularly the west of the South Island.
The Madden Julian Oscillation’s was most active during November in the Pacific Ocean and Africa (phases 6-8). To start December, phases 1-2-3 are favoured before a possible re-emergence in phases 6-7 later in December, continuing to phases 8-1-2 in early January.
Historically, these phases were associated with above average temperatures for most of New Zealand during the month of December.
The IOD remains strongly positive. The latest weekly value from the Australian Bureau of Meteorology (BoM) is 1.36˚C, down from 1.67˚C last week. The latest discussion from the BoM indicates that because the IOD was so unusually strong (near-record levels earlier in the spring), it is expected to remain a climate driver for several more weeks. For New Zealand, this means a propensity for stronger and/or more persistent westerly quarter winds and subsequently wetter conditions in western areas. However, eastern areas are more likely to experience drier conditions to start summer. The IOD may give way to warm water in the tropical western Pacific as a climate driver later in summer. For New Zealand, this may come with a reduction in westerlies and the potential for more northeasterlies.
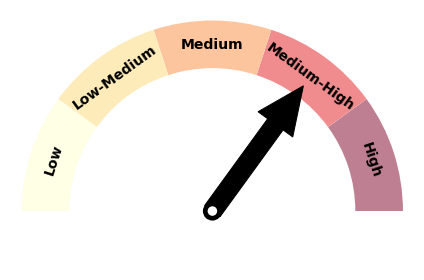
Forecast Confidence
Temperature
|
Forecast confidence for temperature is medium to high due to the expectation for westerly quarter air flows during the first half of the season. Warm, Australian air masses may frequently cross the Tasman Sea, leading to spells of heat for New Zealand. Surrounding ocean temperatures are likely to be above average as well. Collectively, this provides somewhat higher than normal confidence that summer temperatures will be above average for most of New Zealand. |
Rainfall
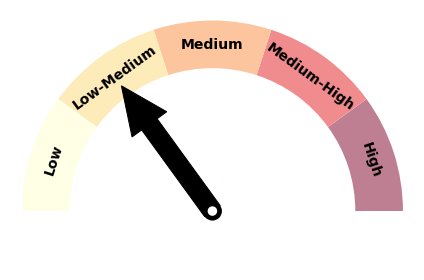
|
Forecast confidence for summer rainfall is, overall, low-medium. While the presence of a strong positive IOD gives higher than average confidence for rainfall patterns early in the season, the uncertainty surrounding an expected transition away from this climate driver later in the season provides uncertainty. Additionally, model guidance is inconsistent with identifying a ‘theme’ for most of the country. Collectively, this provides a somewhat lower than average confidence level for summer rainfall. |
Download
Seasonal Climate Outlook for December 2019 - February 2020
