Overview
La Niña conditions are present in the tropical Pacific, as several conventional thresholds have been reached or are being approached. As of earlier this month, NOAA declared that weak La Niña conditions have emerged, while the Australian Bureau of Meteorology escalated their ENSO tracker to the “La Niña Alert” category. Sea surface temperatures (SSTs) in the eastern Equatorial Pacific Ocean have continued to cool with the most anomalously cool temperatures from about 140°W east to the South American coast. The NIWA Southern Oscillation Index has been positive since July 2017 and is currently at +0.9. Enhanced trade winds persist in the western equatorial Pacific Ocean and cooler than normal subsurface ocean waters present in the central Equatorial Pacific (at about 100m depth) have cooled further.
The consensus from international models is that the tropical Pacific Ocean will cool further for a portion of the next 3 months (December 2017 – February 2018), with La Niña conditions expected to continue over the same period (75% chance). However, the models indicate that La Niña is most likely (72% chance) to transition to ENSO neutral conditions over the March – May 2018 period. While this particular event is expected to remain in the weak category, it should be noted that the impacts of La Niña are not always proportional to its intensity.
For December 2017 – February 2018, the atmospheric circulation around New Zealand is forecast to be characterised by higher pressure than normal to the south and southeast of the country, and lower pressure than normal to the north. This pressure pattern is expected to be associated with easterly to northeasterly flow anomalies, a pattern which is consistent with regional conditions typically observed during La Niña events.
For the coming tropical cyclone season (November 2017 to April 2018), NIWA's Southwest Pacific Tropical Cyclone Outlook indicates that the risk for New Zealand is normal or above normal. On average, at least one ex-tropical cyclone passes within 550km of New Zealand each year. If an ex-tropical cyclone comes close to the country, it has equal probability of passing east or west of Auckland and the North Island. Significant rainfall, damaging winds and coastal damage can occur leading up to and during these events.
Outlook Summary
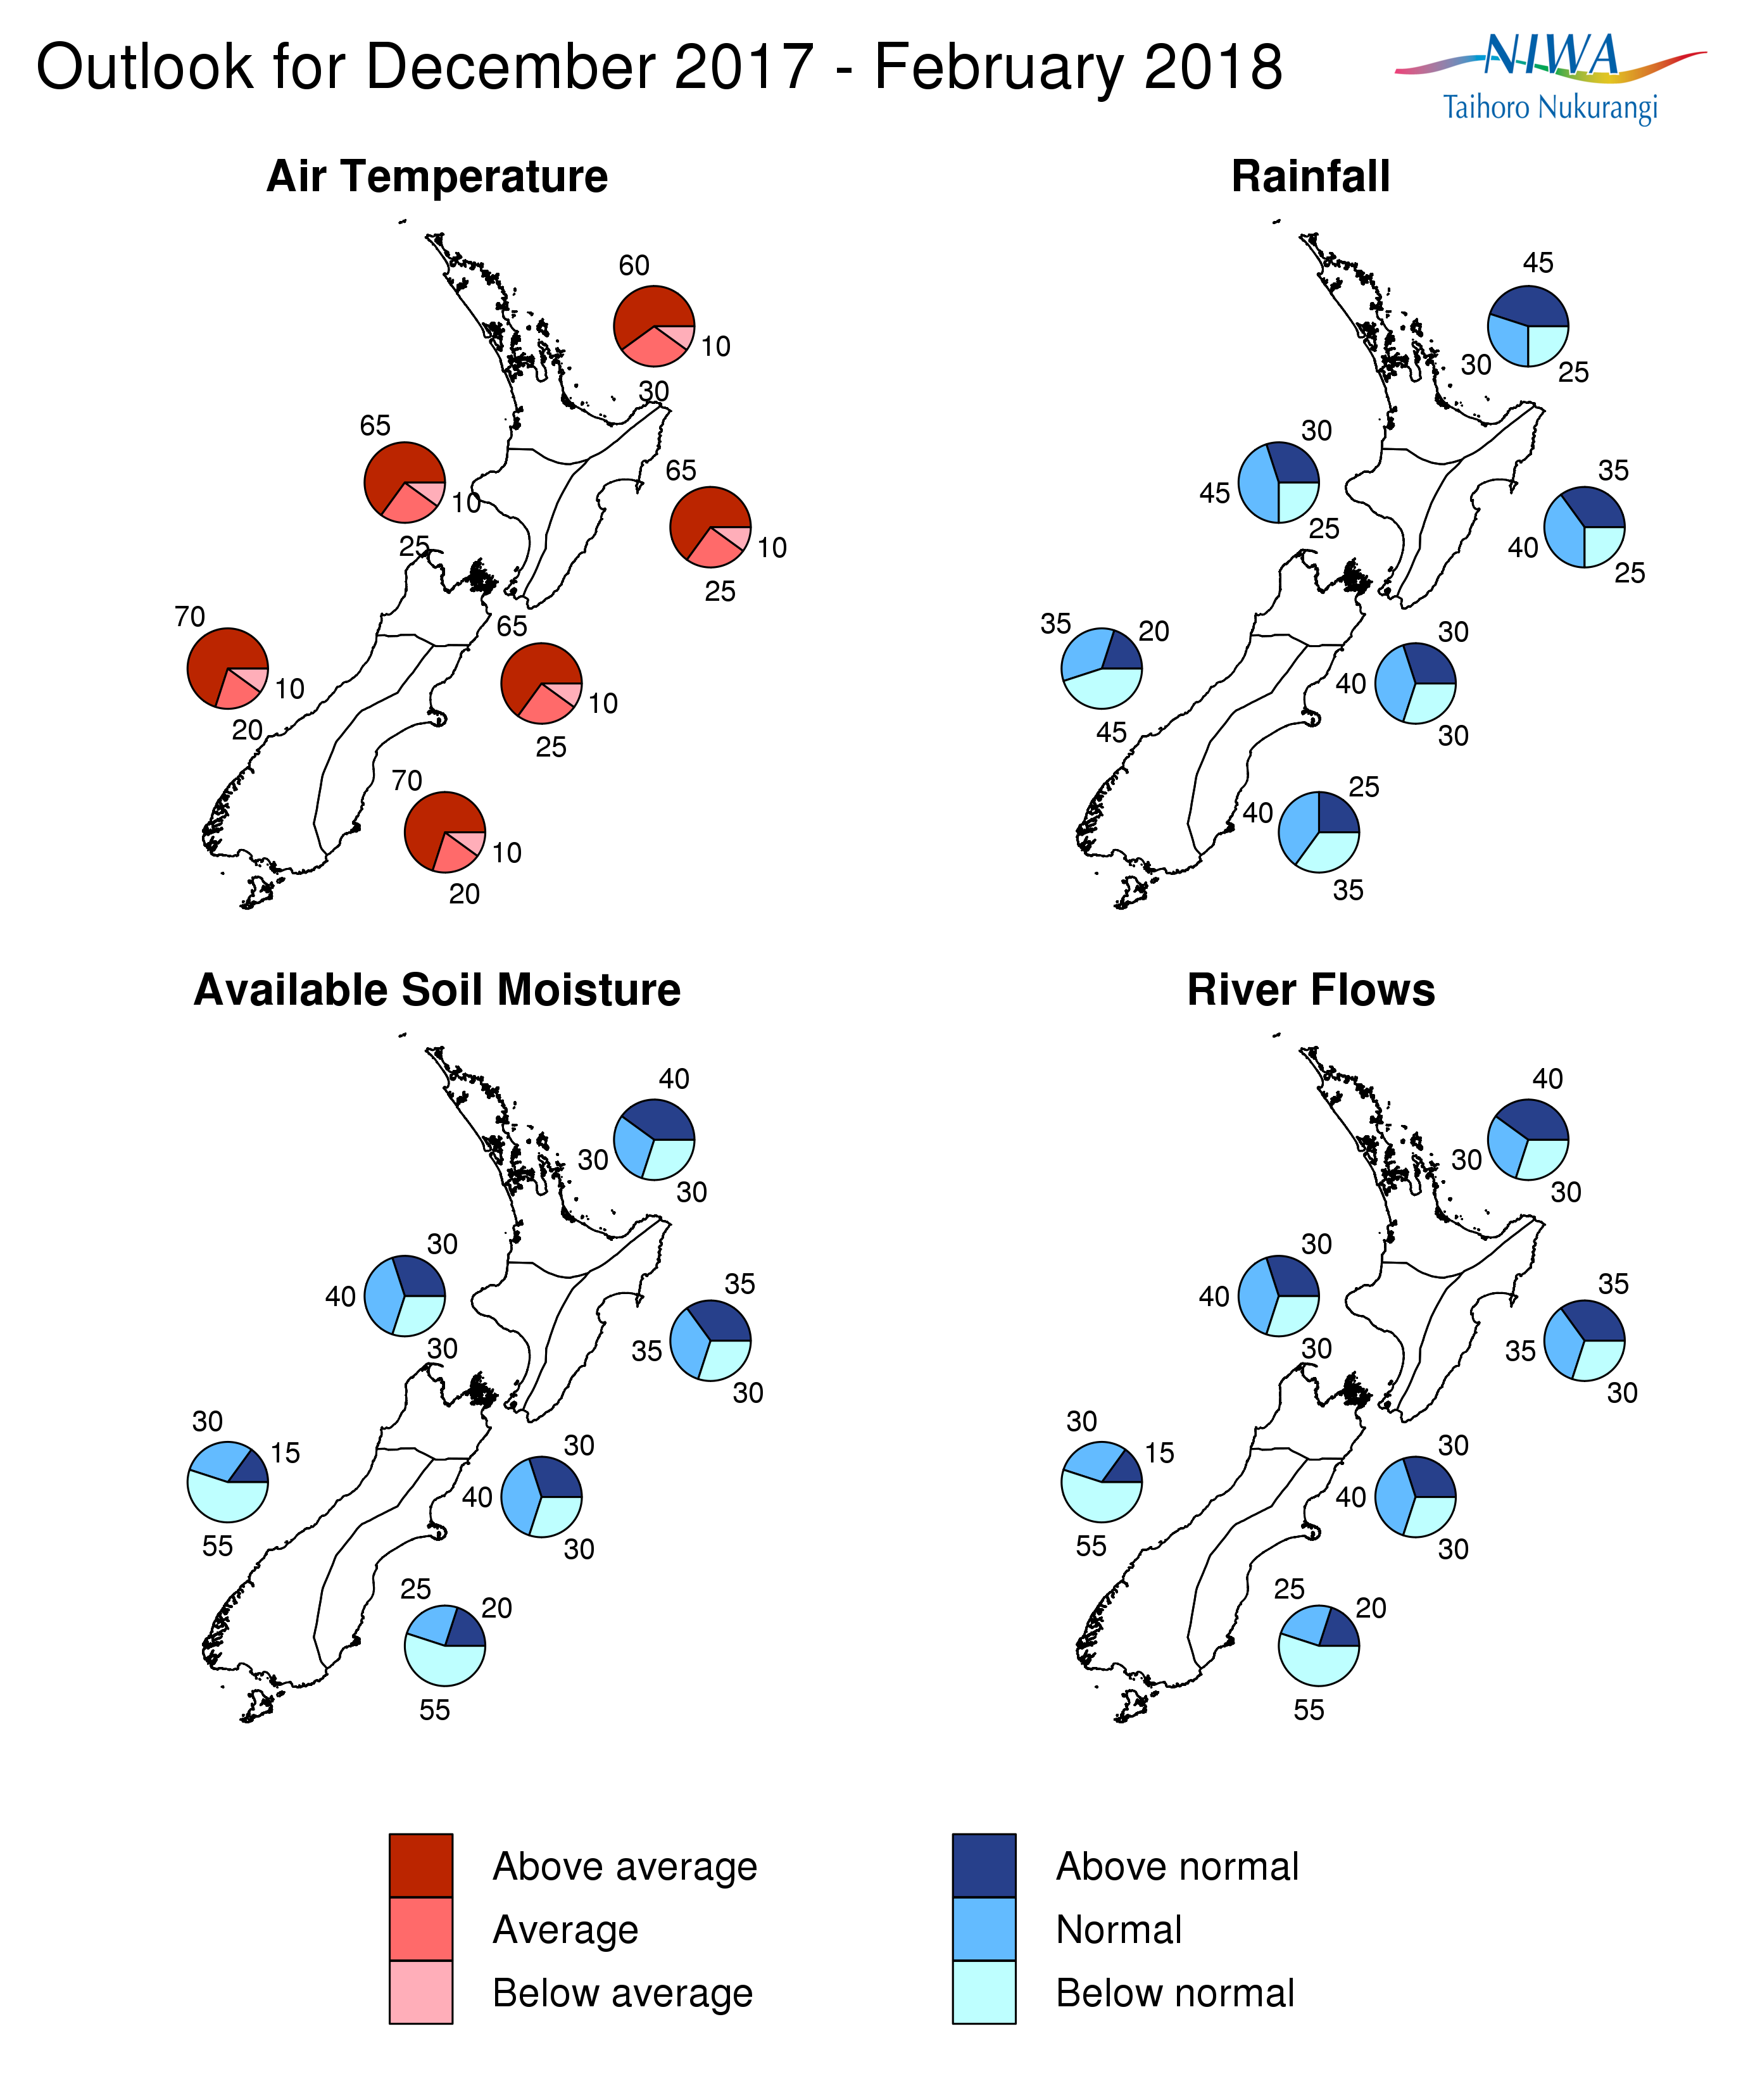
December 2017 – February 2018 temperatures are forecast to be above average, with high confidence, for all regions of New Zealand (60% to 70% chance). Coastal water temperatures around New Zealand are forecast to remain above average over the next three-months period.
For December 2017 – February 2018 rainfall totals are most likely (45% chance) to be above normal in the north of the North Island. Summer rainfall is about equally likely to be near normal (35% chance) or above normal (40% chance) for the east of the North Island. For the west of the North island, December 2017 – February 2018 rainfall amounts are most likely to be in the near normal range (45% chance). Near normal rainfall amounts are most likely for the north of the South Island (40% chance). Below normal rainfall is most likely for the west of the South Island (45% chance). Rainfall totals for the next three months are about equally likely to be below normal (35% chance) or near normal (40% chance) for the east of the South Island.
December 2017 – February 2018 soil moisture levels and river flows are most likely to be above normal (40% chance) in the north of the North Island and most likely (40% chance) to be near normal in the west of the North Island. Soil moisture levels and river flows are equally likely to be near normal (35% chance) or above normal (35% chance) in the east of the North Island. In the north of the South Island, soil moisture levels and river flows are most likely to be in the near normal range (40% chance) with below normal soil moisture levels and river flows most likely (55% chance) for the east and west of the South Island.
Regional predictions for the December 2017 – February 2018 season
Northland, Auckland, Waikato, Bay of Plenty
The table below shows the probabilities (or percent chances) for each of three categories: above average, near average, and below average. In the absence of any forecast guidance there would be an equal likelihood (33% chance) of the outcome being in any one of the three categories. Forecast information from local and global guidance models is used to indicate the deviation from equal chance expected for the coming three-month period, with the following outcomes the most likely (but not certain) for this region:
- Temperatures are very likely to be above average (60% chance).
- Rainfall totals are most likely to be in the above normal range (45% chance).
- Soil moisture levels and river flows are most likely to be above normal (40% chance).
The full probability breakdown is:
|
Temperature |
Rainfall |
Soil moisture |
River flows |
|
|
Above average |
60 |
45 |
40 |
40 |
|
Near average |
30 |
30 |
30 |
30 |
|
Below average |
10 |
25 |
30 |
30 |
Central North Island, Taranaki, Whanganui, Manawatu, Wellington
Probabilities are assigned in three categories: above average, near average, and below average.
- Temperatures are very likely to be above average (65% chance).
- Rainfall totals are likely to be in the near normal range (45% chance).
- Soil moisture levels and river flows are most likely to be in the near normal range (40% chance).
The full probability breakdown is:
|
Temperature |
Rainfall |
Soil moisture |
River flows |
|
|
Above average |
65 |
30 |
30 |
30 |
|
Near average |
25 |
45 |
40 |
40 |
|
Below average |
10 |
25 |
30 |
30 |
Gisborne, Hawke’s Bay, Wairarapa
Probabilities are assigned in three categories: above average, near average, and below average.
- Temperatures are very likely to be above average (65% chance).
- Rainfall totals are about equally likely to be near normal (40% chance) or above normal (35% chance). NB: rainfall amounts may be elevated for northern areas (e.g. Gisborne) and reduced for southern areas (e.g. Wairarapa).
- Soil moisture levels and river flows are equally likely to be in the near normal or above normal range (35% chance).
The full probability breakdown is:
|
Temperature |
Rainfall |
Soil moisture |
River flows |
|
|
Above average |
65 |
35 |
35 |
35 |
|
Near average |
25 |
40 |
35 |
35 |
|
Below average |
10 |
25 |
30 |
30 |
Tasman, Nelson, Marlborough, Buller
Probabilities are assigned in three categories: above average, near average, and below average.
- Temperatures are very likely to be above average (65% chance).
- Rainfall totals, soil moisture levels and river flows are all most likely to be near normal (40% chance).
The full probability breakdown is:
|
Temperature |
Rainfall |
Soil moisture |
River flows |
|
|
Above average |
65 |
30 |
30 |
30 |
|
Near average |
25 |
40 |
40 |
40 |
|
Below average |
10 |
30 |
30 |
30 |
West Coast, Alps and foothills, inland Otago, Southland
Probabilities are assigned in three categories: above average, near average, and below average.
- Temperatures are very likely to be above average (70% chance).
- Rainfall totals are most likely to be below normal (45% chance).
- Soil moisture levels and river flows are most likely to be in the below normal range (55% chance).
The full probability breakdown is:
|
Temperature |
Rainfall |
Soil moisture |
River flows |
|
|
Above average |
70 |
20 |
15 |
15 |
|
Near average |
20 |
35 |
30 |
30 |
|
Below average |
10 |
45 |
55 |
55 |
Coastal Canterbury, east Otago
Probabilities are assigned in three categories: above average, near average, and below average.
- Temperatures are very likely to be above average (70% chance).
- Rainfall totals are about equally likely to be in the near normal range (40% chance) or below normal range (35% chance).
- Soil moisture levels and river flows are most likely to be in the below normal range (55% chance).
The full probability breakdown is:
|
Temperature |
Rainfall |
Soil moisture |
River flows |
|
|
Above average |
70 |
25 |
20 |
20 |
|
Near average |
20 |
40 |
25 |
25 |
|
Below average |
10 |
35 |
55 |
55 |
Graphical representation of the regional probabilities
Background
La Niña conditions are currently present in the tropical Pacific, as several conventional thresholds have been reached or are being approached. As of earlier this month, NOAA declared that weak La Niña conditions have emerged, while the Australian Bureau of Meteorology escalated their ENSO tracker to the “La Niña Alert” category. Sea surface temperatures (SSTs) in the central and eastern equatorial Pacific Ocean have continued to cool during the month of November. Pockets of SST anomalies of more than -2.0oC are present east of about 100°. The latest monthly SST anomalies (as of 19 November) reach -0.5 oC in the NINO3.4 index region (with the latest weekly anomalies also at -0.5 oC). The NINO3 region is also negative at -0.6oC, and the NINO4 index (in the western Pacific) is close to zero.
During the month of November, colder than normal subsurface ocean waters (within the first 150 meters of the ocean) in the central and eastern equatorial Pacific (east of about 150°W) have persisted and intensified with month-to-date anomalies greater than -3.0oC present near 140°W and five day subsurface anomalies indicating -3.0oC farther east near 110°W. The heat content anomalies integrated over the first 300m of the ocean have persistently been negative since late September, while continuing to cool and expand eastward. Heat content anomalies now exceed -1.0oC from about 145°W to 90°W. Additionally, positive upper oceanic heat content anomalies have developed west of about 170°E. This upper oceanic heat gradient across the equatorial Pacific Ocean is consistent with La Niña.
The Southern Oscillation Index (SOI) for the month of November 2017 (value estimated using data to the 29th of November) is positive at +0.9 i.e. just short of the La Niña threshold utilized by NIWA (+1 standard deviation).
Zonal wind anomalies along the equator have remained negative in the western equatorial Pacific during November, in keeping with a positive SOI. Rainfall and convection anomalies in the tropical Pacific were enhanced over the Maritime Continent as well as from near Fiji east to near the Southern Cook Islands. Reduced convection was evident along the equator from east of Papua New Guinea to the Date Line. The ENSO Precipitation Index (ESPI) has become more negative, going from -0.94 last month to -1.36 for November, reflecting La Niña.
In summary, the tropical Pacific Ocean is currently in a La Niña state, which is most likely to continue for the summer season, with 75% chance for La Niña conditions to persist over the next three-month period (December 2017 – February 2018). International agencies have either declared La Niña thresholds have been met (NOAA/CPC) or have elevated their ENSO status to indicate La Niña is imminent. This event is not expected to persist beyond the first quarter of 2018 and a return to ENSO neutral conditions is most likely in the second quarter of 2018 (72% chance for neutral conditions over the March-May 2018 period).
Coastal waters remain warmer than average around New Zealand, especially off the coast of the South Island, where the anomaly for the month of November (estimated using data to the 28th November) exceed +1oC. As a whole, warm anomalies have recently intensified, notably around the coasts of the South Island of the country. It can be noted that warmer than normal surface ocean waters around NZ and in the Tasman Sea are often associated with La Niña conditions.
Contact
Chris Brandolino, Principal Scientist – Forecasting, NIWA National Climate Centre
Tel (09) 375 6335, Mobile (027) 886 0014
Dr Brett Mullan, Principal Scientist, NIWA National Climate Centre
Tel (04) 386 0508, Mobile (027) 294 1169
Notes to reporters and editors
- NIWA’s outlooks indicate the likelihood of climate conditions being at, above, or below average for the season as a whole. They are not ‘weather forecasts’. It is not possible to forecast precise weather conditions three months ahead of time.
- The outlooks are the result of the expert judgment of NIWA’s climate scientists. They take into account observations of atmospheric and ocean conditions and output from global and local climate models. The presence of El Niño or La Niña conditions and the sea surface temperatures around New Zealand can be a useful indicator of likely overall climate conditions for a season.
- The outlooks state the probability for above average conditions, near average conditions, and below average conditions for rainfall, temperature, soil moisture, and river flows. For example, for winter (June–July–August) 2007, for all the North Island, we assigned the following probabilities for temperature: · Above average: 60 per cent · Near average: 30 per cent · Below average: 10 per cent We therefore concluded that above average temperatures were very likely.
- This three-way probability means that a random choice would be correct only 33 per cent (or one-third) of the time. It would be like randomly throwing a dart at a board divided into three equal parts, or throwing a dice with three numbers on it. An analogy with coin tossing (a two-way probability) is not correct.
- A 50 per cent ‘hit rate’ is substantially better than guesswork, and comparable with the skill level of the best overseas climate outlooks. See, for example, analysis of global outlooks issued by the International Research Institute for Climate and Society based in the US published in the Bulletin of the American Meteorological Society (Goddard, L., A. G. Barnston, and S. J. Mason, 2003: Evaluation of the IRI’s “net assessment” seasonal climate forecasts 1997–2001. Bull. Amer. Meteor. Soc., 84, 1761–1781).
- Each month, NIWA publishes an analysis of how well its outlooks perform. This is available online and is sent to about 3500 recipients of NIWA’s newsletters, including many farmers.
- All outlooks are for the three months as a whole. There will inevitably be wet and dry days, and hot and cold days, within a season. The exact range in temperature and rainfall within each of the three categories varies with location and season. However, as a guide, the “near average” or middle category for the temperature predictions includes deviations up to ±0.5°C for the long-term mean, whereas for rainfall the “near normal” category lies between approximately 80 per cent and 115 per cent of the long-term mean.
- The seasonal climate outlooks are an output of a scientific research programme, supplemented by NIWA’s Capability Funding. NIWA does not have a government contract to produce these outlooks.
- Where probabilities are within 5% of one another, the term “about equally” is used.