Outlook Summary
- Sea surface temperatures (SSTs) in the central equatorial Pacific were 0.5˚C above average in July, down from +0.7˚C during June, suggesting that the El Niño event is weakening.
- The Southern Oscillation Index remained on the El Niño side of neutral during July at -0.9.
- Oceanic El Niño conditions are forecast to fade to neutral (55% chance) over the next three months and its influence on the climate system is expected to gradually decline.
- For the August to October period, air pressure is forecast to be lower than normal in the New Zealand region. Initially, low pressure systems are forecast to move toward the country from the Southern Ocean and Tasman Sea. As the season progresses, low pressure systems may become favoured to the northeast. This is expected to be associated with more westerly quarter winds than normal to start the season with mixed flow patterns, including easterlies, later on. September has a chance to be particularly unsettled.
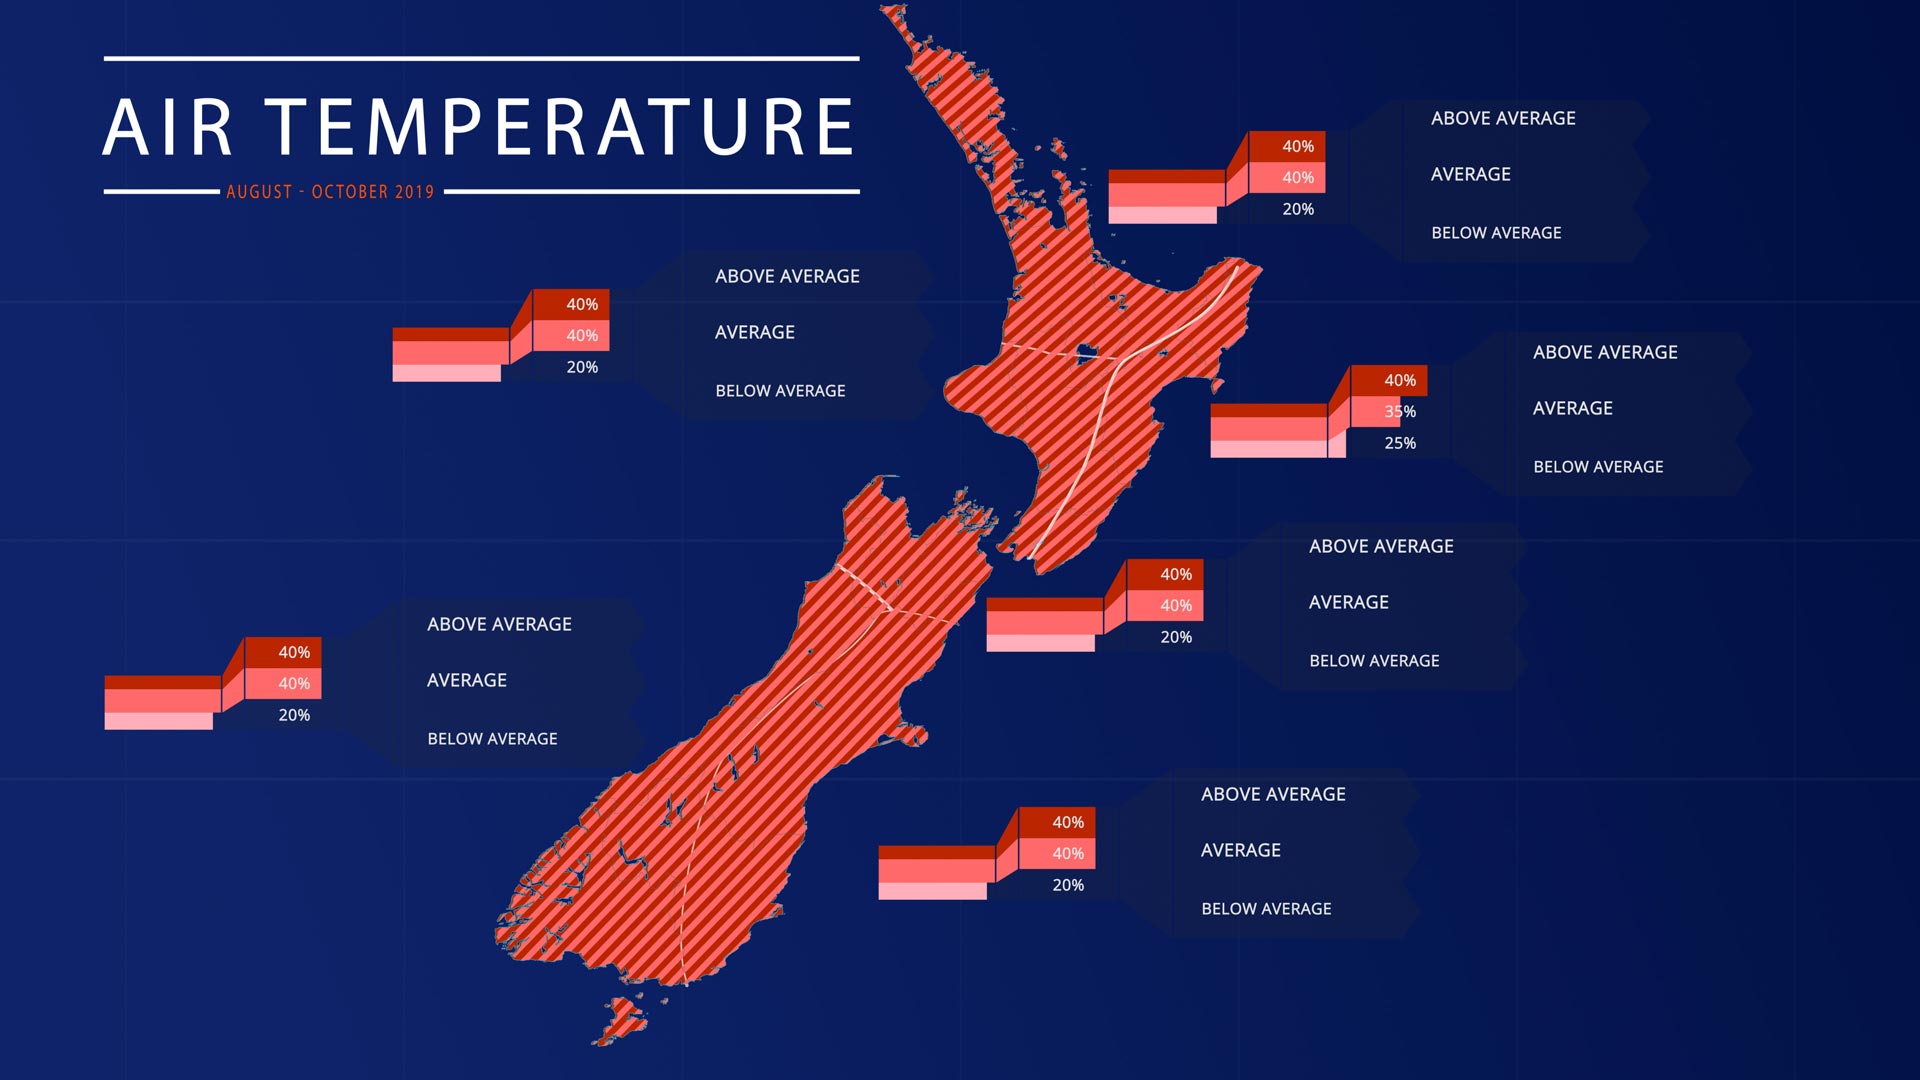
- Despite a sharp cold snap in early August, seasonal temperatures are forecast to be near average or above average for all regions of New Zealand, owing to warmer than average coastal and regional sea surface temperatures.
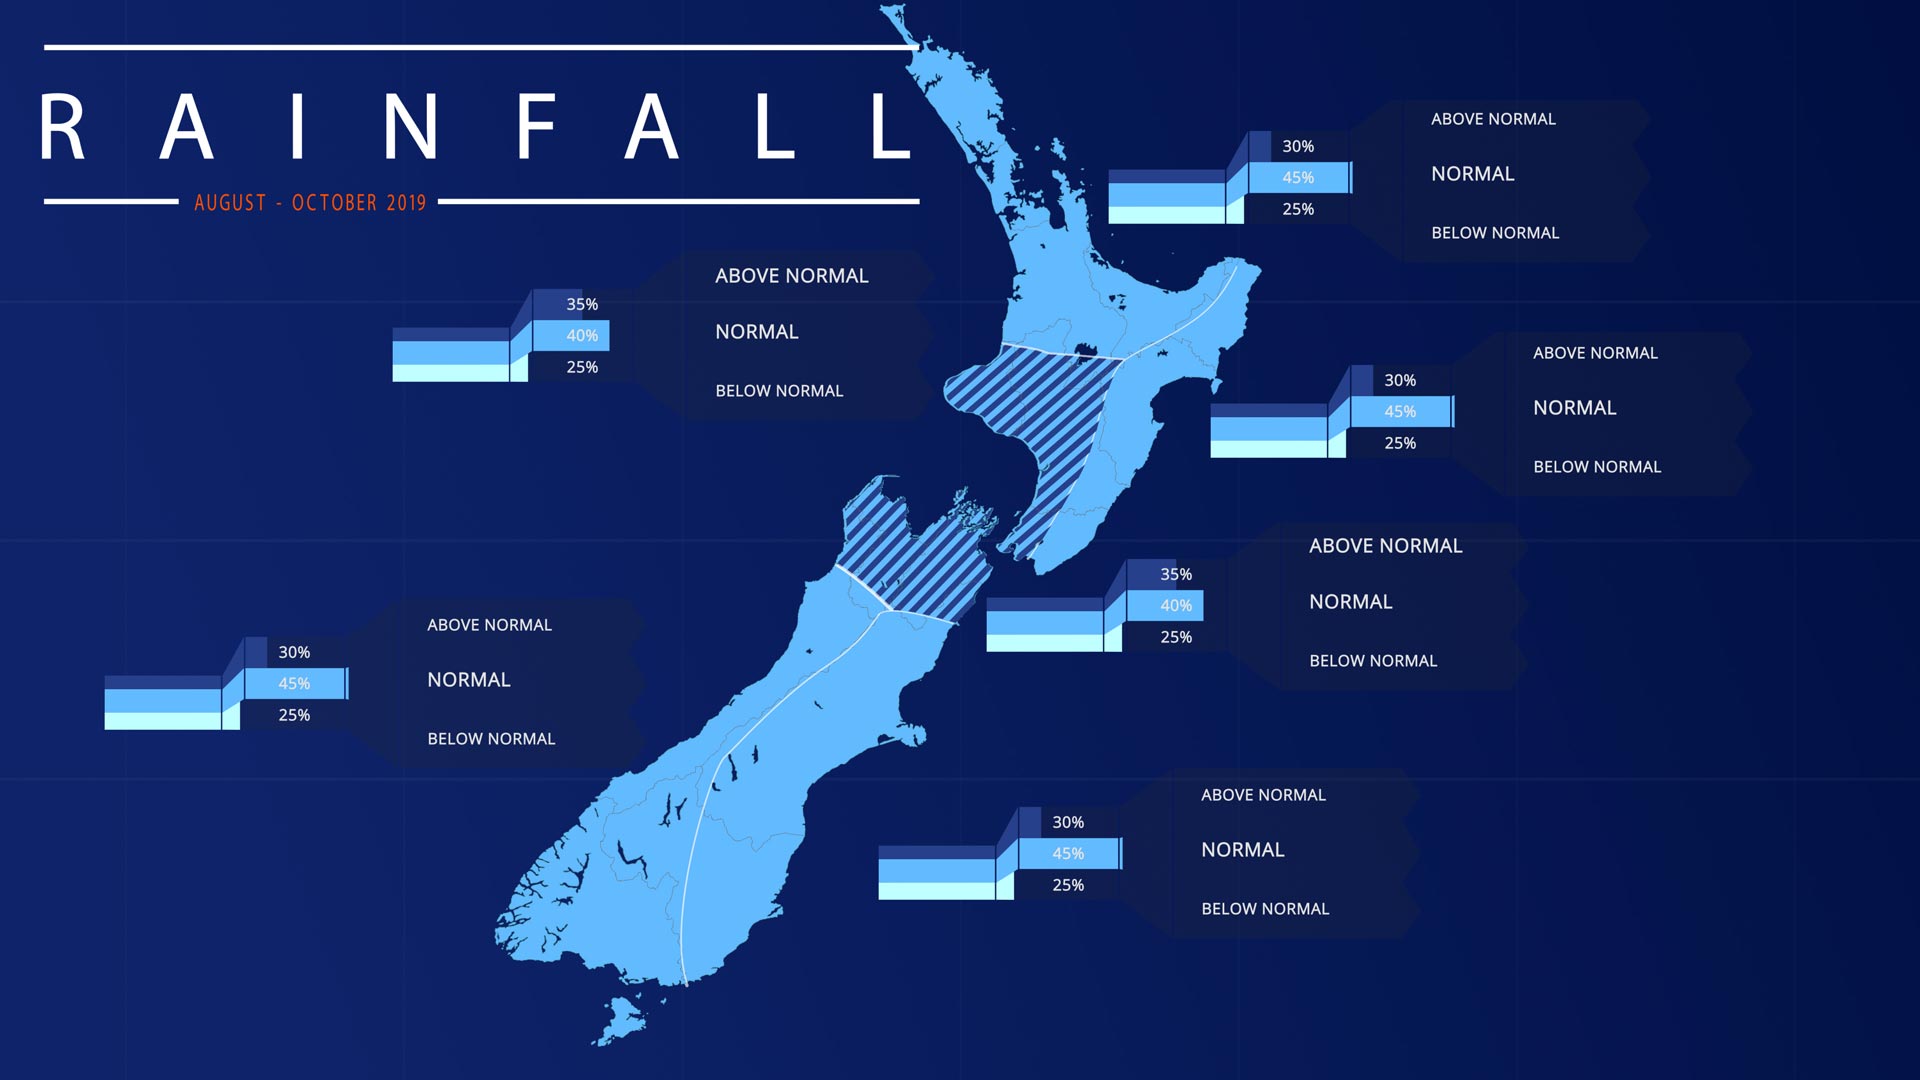
- Rainfall is forecast to near normal or above normal in the west of the North Island and north of the South Island with near normal rainfall forecast for all remaining regions.
- Frequent cyclonic air flows may promote regular rainfall events in the New Zealand region.
NIWA Climate Scientist Nava Fedaeff and Meteorologist Ben Noll host New Zealand's climate outlook for August - October 2019.
August – October 2019 temperatures have about equal chances of being near average (35-40% chance) or above average (40% chance) for all regions of New Zealand. Despite a low chance for below average seasonal temperatures, an abnormally cold period is expected in early August.
August – October 2019 rainfall is about equally likely to be near normal (40% chance) or above normal (35% chance) for the west of the North Island and north of the South Island. Near normal rainfall (45% chance) is forecast for all remaining regions of New Zealand.
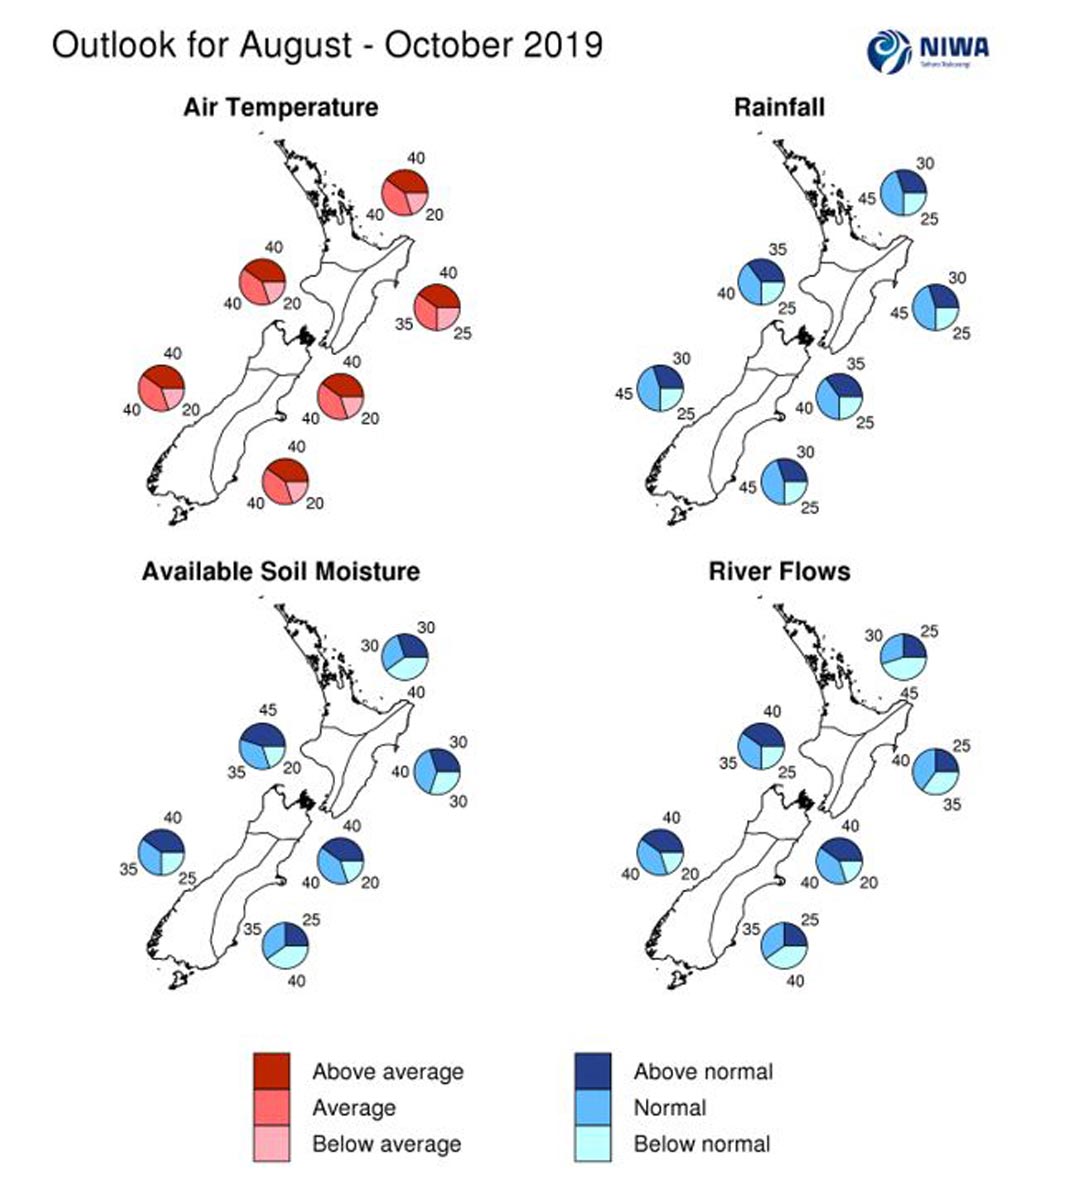
August – October 2019 soil moisture levels and river flows are most likely to be below normal (40-45% chance) in the north of the North Island. For the west of the North Island, soil moisture levels are most likely to be in the above normal range (45% chance) and river flows are about equally likely to be near normal (35% chance) or above normal (40% chance). For the east of the North Island, soil moisture levels are most likely to be in the near normal range (40% chance). River flows in the east of the North Island and river flows and soil moisture levels in the east of the South Island are about equally likely to be normal (35-40% chance) or below normal (35-40% chance). For the north and west of the South Island, soil moisture levels and river flows are about equally likely to be near normal (35-40% chance) or above normal (40% chance).
Regional predictions for the August – October 2019 season
Northland, Auckland, Waikato, Bay of Plenty
The table below shows the probabilities (or percent chances) for each of three categories: above average, near average, and below average. In the absence of any forecast guidance there would be an equal likelihood (33% chance) of the outcome being in any one of the three categories. Forecast information from local and global guidance models is used to indicate the deviation from equal chance expected for the coming three-month period, with the following outcomes the most likely (but not certain) for this region:
- Temperatures are equally likely to be near average (40% chance) or above average (40% chance).
- Rainfall totals are most likely to be in the near normal range (45% chance).
- Soil moisture levels and river flows are most likely to be below normal (40-45% chance).
The full probability breakdown is:
|
Temperature |
Rainfall |
Soil moisture |
River flows |
|
|
Above average |
40 |
30 |
30 |
25 |
|
Near average |
40 |
45 |
30 |
30 |
|
Below average |
20 |
25 |
40 |
45 |
Central North Island, Taranaki, Whanganui, Manawatu, Wellington
Probabilities are assigned in three categories: above average, near average, and below average.
- Temperatures are equally likely to be near average (40% chance) or above average (40% chance).
- Rainfall totals and river flows are about equally likely to be in the near normal (35-40% chance) or above normal range (35-40% chance).
- Soil moisture levels are most likely to be above normal (45% chance).
The full probability breakdown is:
|
Temperature |
Rainfall |
Soil moisture |
River flows |
|
|
Above average |
40 |
35 |
45 |
40 |
|
Near average |
40 |
40 |
35 |
35 |
|
Below average |
20 |
25 |
20 |
25 |
Gisborne, Hawke’s Bay, Wairarapa
Probabilities are assigned in three categories: above average, near average, and below average.
- Temperatures are about equally likely to be above average (40% chance) or near average (35% chance).
- Rainfall totals and soil moisture levels are most likely to be in the near normal range (40-45% chance).
- River flows are about equally likely to be near normal (40% chance) or below normal (35% chance).
The full probability breakdown is:
|
Temperature |
Rainfall |
Soil moisture |
River flows |
|
|
Above average |
40 |
30 |
30 |
25 |
|
Near average |
35 |
45 |
40 |
40 |
|
Below average |
25 |
25 |
30 |
35 |
Tasman, Nelson, Marlborough, Buller
Probabilities are assigned in three categories: above average, near average, and below average.
- Temperatures are equally likely to be near average (40% chance) or above average (40% chance).
- Rainfall totals, soil moisture levels, and river flows are about equally likely to be near normal (35-40% chance) or above normal (35-40% chance).
The full probability breakdown is:
|
Temperature |
Rainfall |
Soil moisture |
River flows |
|
|
Above average |
40 |
35 |
40 |
40 |
|
Near average |
40 |
40 |
40 |
40 |
|
Below average |
20 |
25 |
20 |
20 |
West Coast, Alps and foothills, inland Otago, Southland
Probabilities are assigned in three categories: above average, near average, and below average.
- Temperatures are equally likely to be near average (40% chance) or above average (40% chance).
- Rainfall totals are most likely to be in the near normal range (45% chance).
- Soil moisture levels and river flows are about equally likely to be near normal (35-40% chance) or above normal (40%).
The full probability breakdown is:
|
Temperature |
Rainfall |
Soil moisture |
River flows |
|
|
Above average |
40 |
30 |
40 |
40 |
|
Near average |
40 |
45 |
35 |
40 |
|
Below average |
20 |
25 |
25 |
20 |
Coastal Canterbury, east Otago
Probabilities are assigned in three categories: above average, near average, and below average.
- Temperatures are equally likely to be near average (40% chance) or above average (40% chance).
- Rainfall totals are most likely to be in the near normal range (45% chance).
- Soil moisture levels and river flows are about equally likely to be near normal (35% chance) or below normal (40% chance).
The full probability breakdown is:
|
Temperature |
Rainfall |
Soil moisture |
River flows |
|
|
Above average |
40 |
30 |
25 |
25 |
|
Near average |
40 |
45 |
35 |
35 |
|
Below average |
20 |
25 |
40 |
40 |
Graphical representation of the regional probabilities
Background
During July 2019, SSTs dipped below El Niño thresholds (i.e. +0.70˚C) in the central Pacific for the first time in 5 months. The NINO3.4 Index anomaly (in the central Pacific) for the month of July (to the 28th) was +0.54˚C. Warmth was steadfast in the NINO4 region with a monthly value of +0.79˚C.
Upper-oceanic heat content anomalies remain slightly above average in the west-central equatorial Pacific, but have decreased compared to June. In the eastern part of the basin, heat content was below normal for the time of year. The distribution of ocean heat content across the Pacific reflects ongoing but weak El Niño-Modoki conditions.
Across the global tropics, rainfall patterns remained broadly consistent with a weak, central Pacific El Niño. Rainfall was enhanced just west of the international Dateline as well as between 10-20˚N and 10-20˚S. A convectively coupled Kelvin wave traversed the far eastern Pacific and South America during the month, which constructively interfered with the base state (i.e. El Niño). This may have contributed to the Southern Oscillation Index holding on the El Niño side of neutral (-0.9).
Trade winds were slightly weaker than normal in the western and central Pacific during July, similar to June. To the contrary, trade winds were stronger than normal in the eastern Pacific and led to the decrease of SSTs in the NINO 1+2 and NINO3 regions.
During August, enhanced trade winds are forecast to progress a bit farther west, extending to near the International Dateline. This could lead to additional cooling of SSTs in the central and eastern equatorial Pacific.
The probability for oceanic El Niño conditions, according to the consensus from international models, is 38% for the August – October period with a 56% chance for the development of ENSO-neutral conditions. This is the first time since July 2018 that ENSO neutral is the most likely outcome. For the November 2019 – January 2020 period, the probability for El Niño is 47% and neutral 42%. For the February – April 2020 period, the probability for El Niño is 51% and neutral 46%.
New Zealand’s coastal water temperatures for July 2019 remained above average for five out of the six climate regions. Sea surface temperatures (SSTs) in the Tasman Sea and Southwest Pacific remain above average for the time of year, reflective of a lack of cold southerly outbreaks so far this winter. These warm seas may continue to prevent long-lasting cold spells from late winter into early spring.
New Zealand Coastal Sea Surface Temperatures during July 2019
|
North NI |
West NI |
East NI |
North SI |
West SI |
East SI |
|
+0.55˚C |
+0.66˚C |
-0.06˚C |
+0.60˚C |
+0.50˚C |
+0.98˚C |
The Southern Annular Mode (SAM) was briefly positive to start July, followed by a significant mid-month dip. After recovering to near neutral late in July, significant negative values are forecast for the first half of August. This will be associated with a cold and stormy start to the month.
The Madden Julian Oscillation’s weak signature during July is expected to continue into August.
Download
Seasonal Climate Outlook August - October 2019
Contacts
Chris Brandolino, Principal Scientist – Forecasting, NIWA National Climate Centre Tel (09) 375 6335, Mobile (027) 886 0014
Ben Noll, Meteorologist/Forecaster, NIWA National Climate Centre Tel (09) 375 6334, Mobile (027) 405 3052
Notes to reporters and editors
- NIWA’s outlooks indicate the likelihood of climate conditions being at, above, or below average for the season as a whole. They are not ‘weather forecasts’. It is not possible to forecast precise weather conditions three months ahead of time.
- The outlooks are the result of the expert judgment of NIWA’s climate scientists. They take into account observations of atmospheric and ocean conditions and output from global and local climate models. The presence of El Niño or La Niña conditions and the sea surface temperatures around New Zealand can be a useful indicator of likely overall climate conditions for a season.
- The outlooks state the probability for above average conditions, near average conditions, and below average conditions for rainfall, temperature, soil moisture, and river flows. For example, for winter (June–July–August) 2007, for all the North Island, we assigned the following probabilities for temperature: · Above average: 60 per cent · Near average: 30 per cent · Below average: 10 per cent We therefore concluded that above average temperatures were very likely.
- This three-way probability means that a random choice would be correct only 33 per cent (or one-third) of the time. It would be like randomly throwing a dart at a board divided into three equal parts, or throwing a dice with three numbers on it. An analogy with coin tossing (a two-way probability) is not correct.
- A 50 per cent ‘hit rate’ is substantially better than guesswork, and comparable with the skill level of the best overseas climate outlooks. See, for example, analysis of global outlooks issued by the International Research Institute for Climate and Society based in the US published in the Bulletin of the American Meteorological Society (Goddard, L., A. G. Barnston, and S. J. Mason, 2003: Evaluation of the IRI’s “net assessment” seasonal climate forecasts 1997–2001. Bull. Amer. Meteor. Soc., 84, 1761–1781).
- Each month, NIWA publishes an analysis of how well its outlooks perform. This is available online and is sent to about 3500 recipients of NIWA’s newsletters, including many farmers. See www.niwa.co.nz/our-science/climate/publications/all/cu
- All outlooks are for the three months as a whole. There will inevitably be wet and dry days, and hot and cold days, within a season. The exact range in temperature and rainfall within each of the three categories varies with location and season. However, as a guide, the “near average” or middle category for the temperature predictions includes deviations up to ±0.5°C for the long-term mean, whereas for rainfall the “near normal” category lies between approximately 80 per cent and 115 per cent of the long-term mean.
- The seasonal climate outlooks are an output of a scientific research programme, supplemented by NIWA’s Capability Funding. NIWA does not have a government contract to produce these outlooks.
- Where probabilities are within 5% of one another, the term “about equally” is used.