Overview
ENSO-neutral conditions continued across the tropical Pacific during July 2018. The Southern Oscillation Index (SOI) was in the neutral range, with a preliminary value of +0.2 for July 2018. Surface ocean waters in the central and eastern equatorial Pacific continued to warm during July but remained in the neutral range. The subsurface ocean remained warmer than average in the eastern equatorial Pacific during July, but anomalies weakened slightly compared to June. Waters remained 2.0°C above average between approximately 20m and 100m depth east of about 130oW.
The consensus from international models is for the tropical Pacific to transition toward El Niño over the next three-month period (55% chance over August – October 2018). The probability for El Niño conditions increases as we reach into and beyond the Southern Hemisphere summer, with a 78% chance for El Niño conditions over the February – April 2019 period. The strength and characteristics of this event – if it eventuates – remain uncertain at this point, but indications so far are that it is unlikely to be in the strong category.
Principal Scientist - forecasting - Chris Brandolino and meteorologist - Ben Noll - talk through the Seasonal Climate Outlook for August - October 2018.
Since the climate system remains ENSO-neutral, the atmospheric circulation around New Zealand for August – October 2018 is forecast to be characterized by mixed air flow patterns. The emergence of El Niño conditions, especially during the second half of the season, may influence periods of enhanced southwesterly wind flows. As a result, warmer than average conditions during the first part of the season may give way to spells of cooler conditions later on.
Outlook Summary
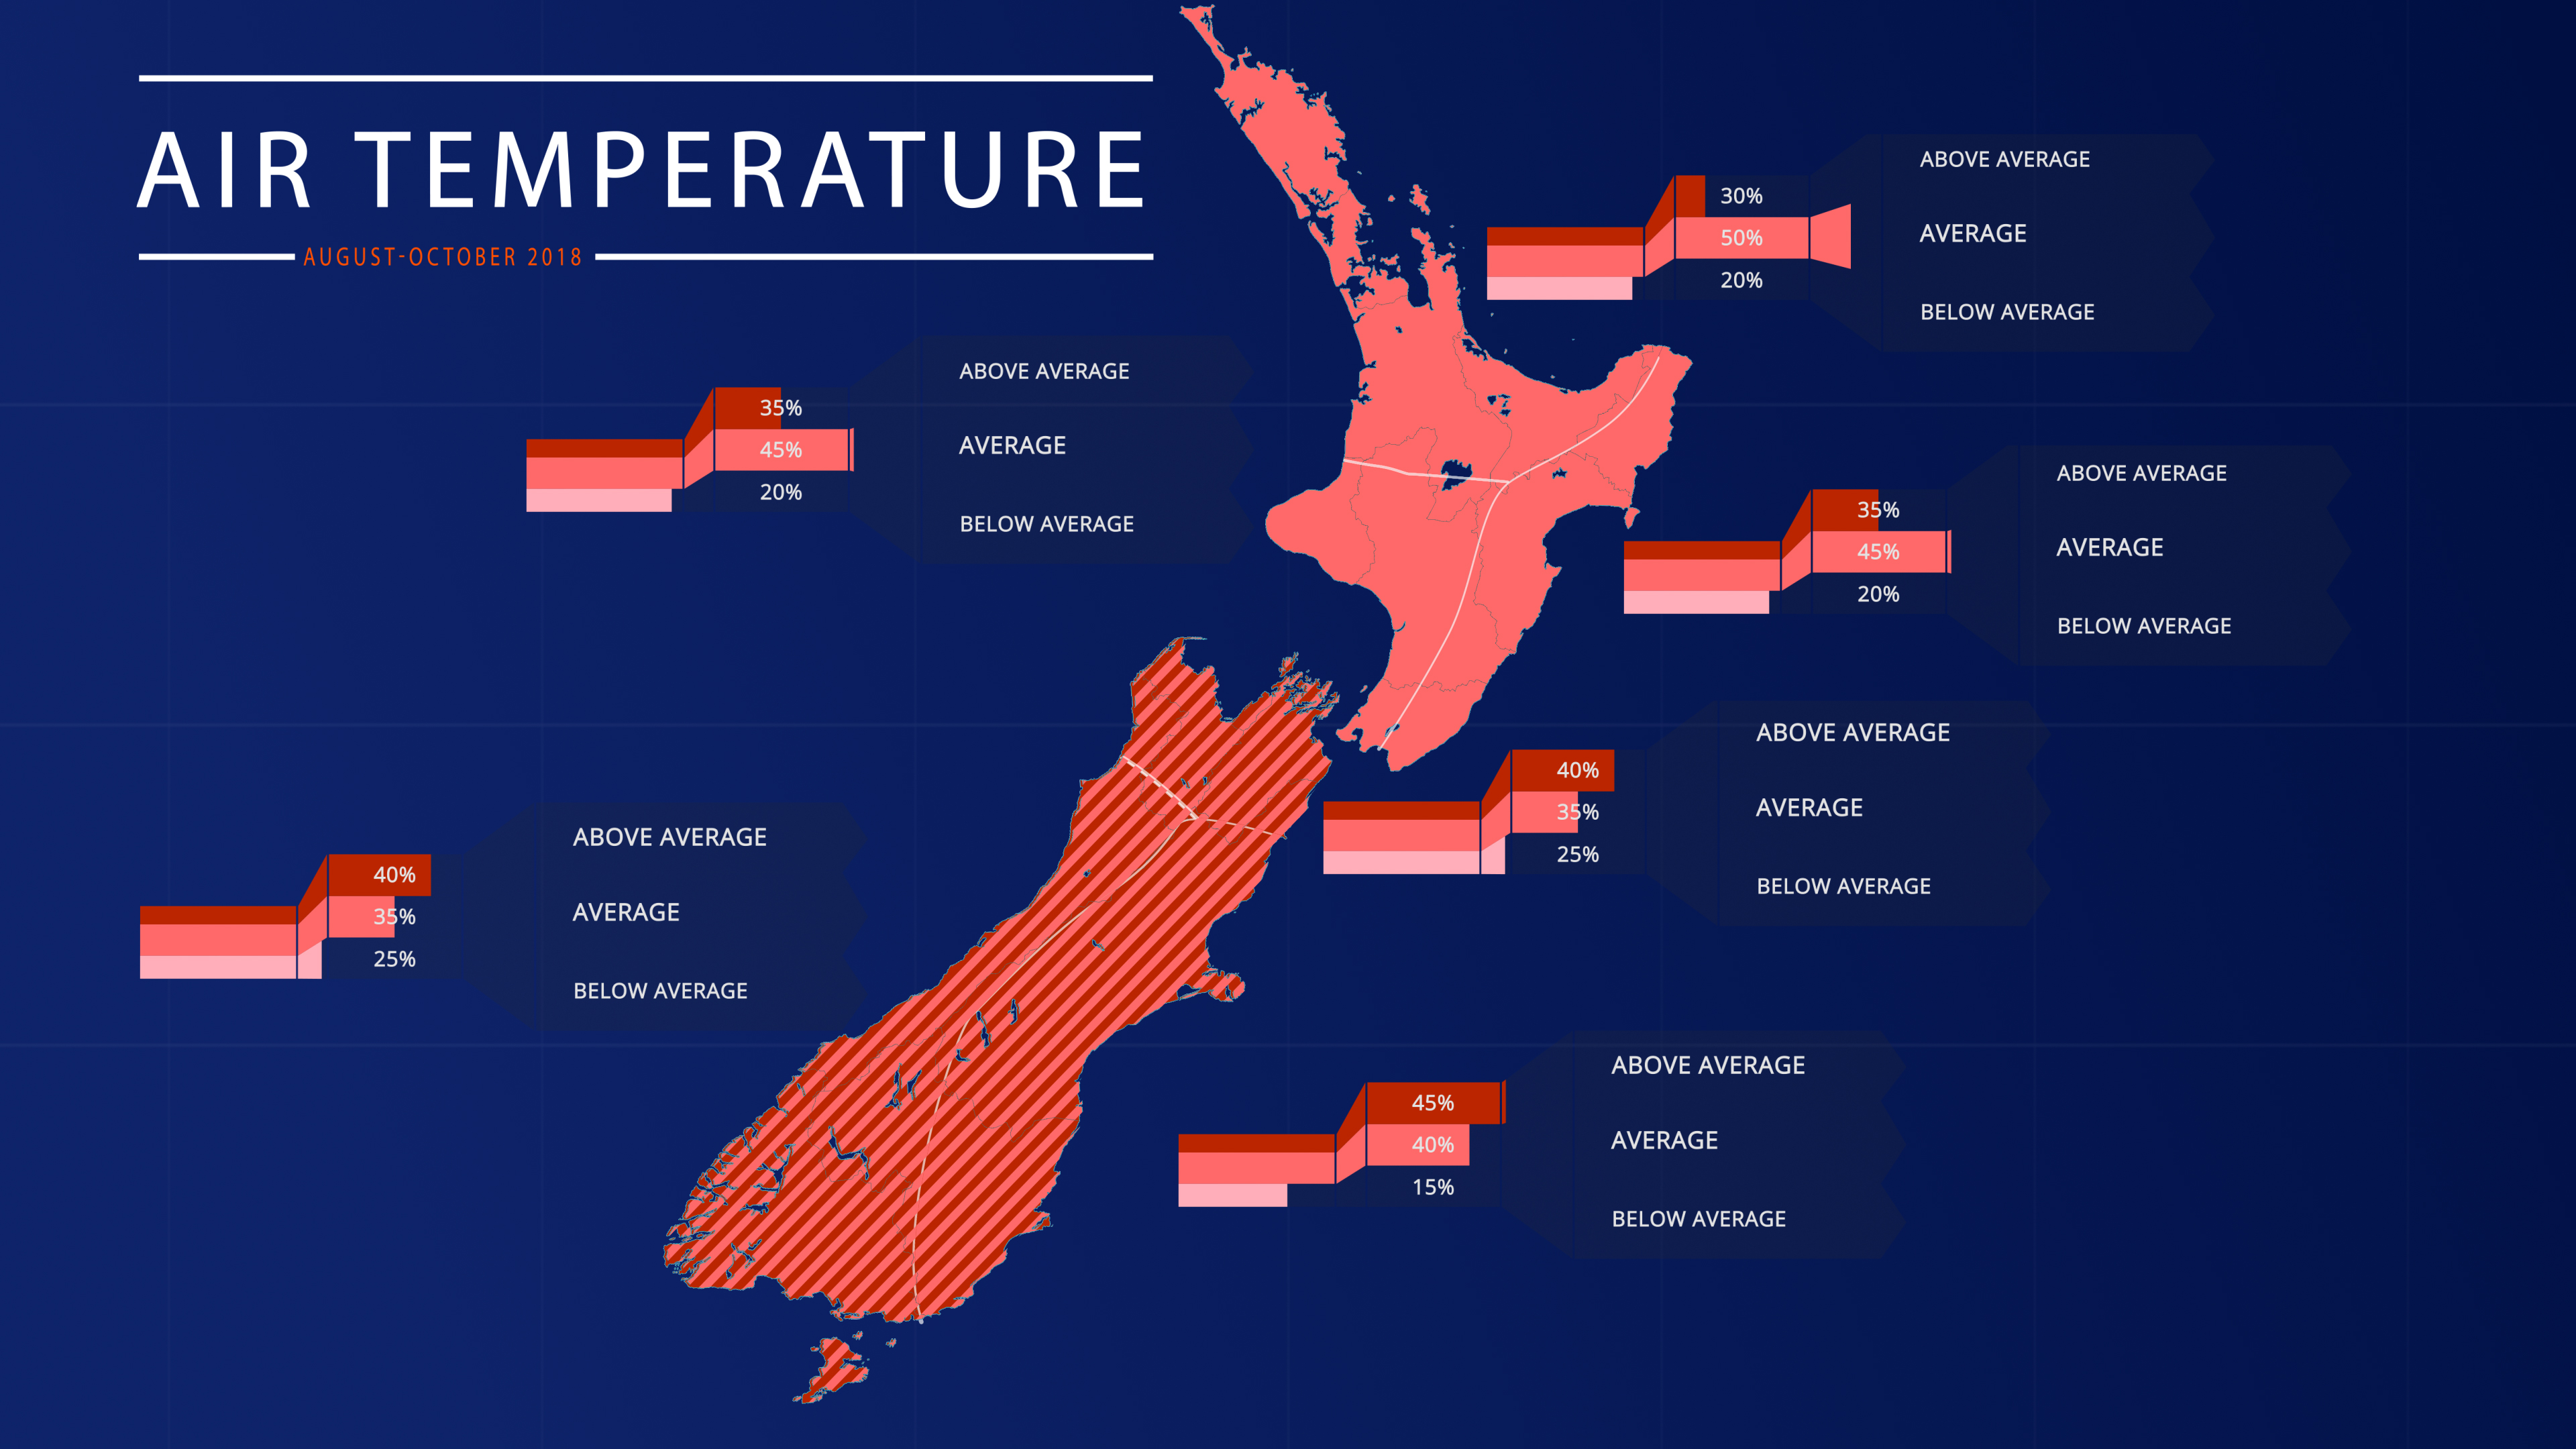
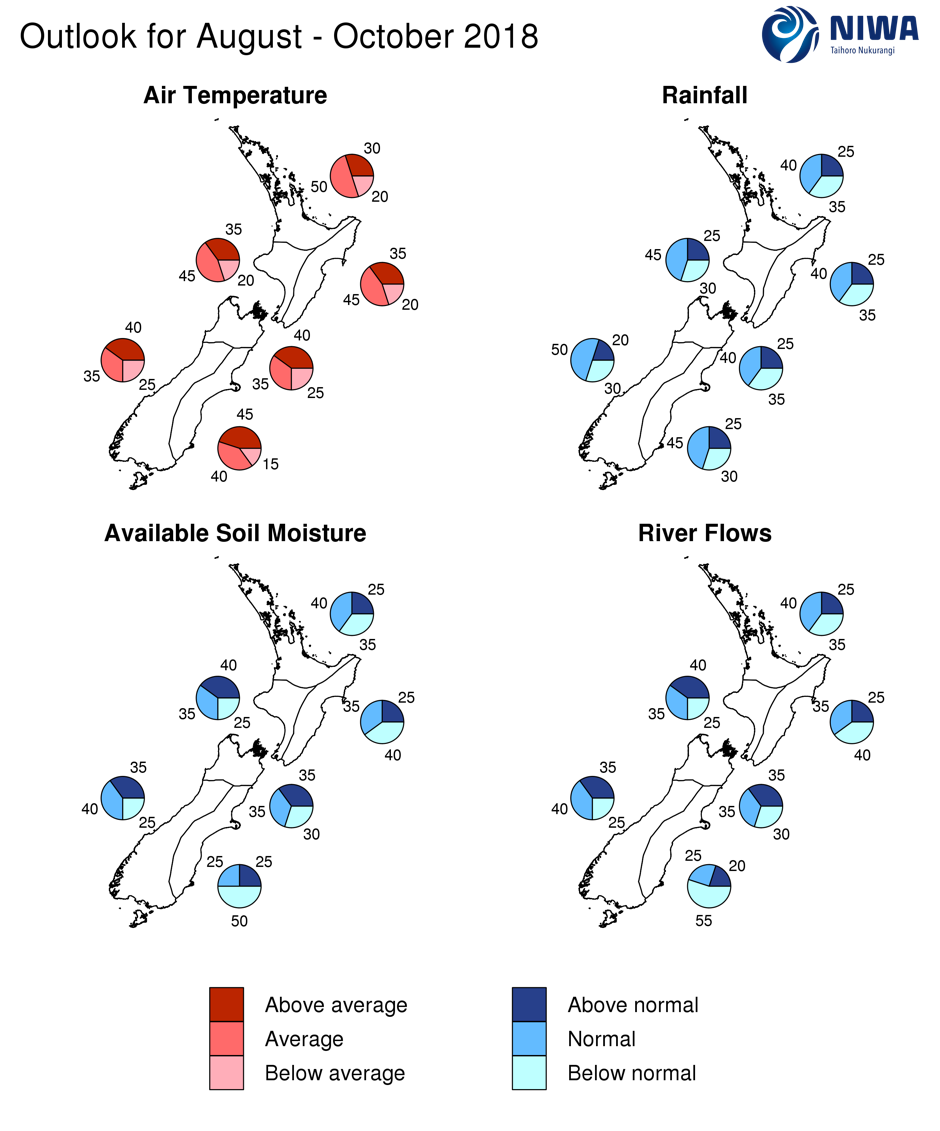
August – October 2018 temperatures are forecast to be near average (40% chance) in the North Island. For all regions of the South Island, seasonal temperatures are expected to be above average (40%) or near average (35% chance).
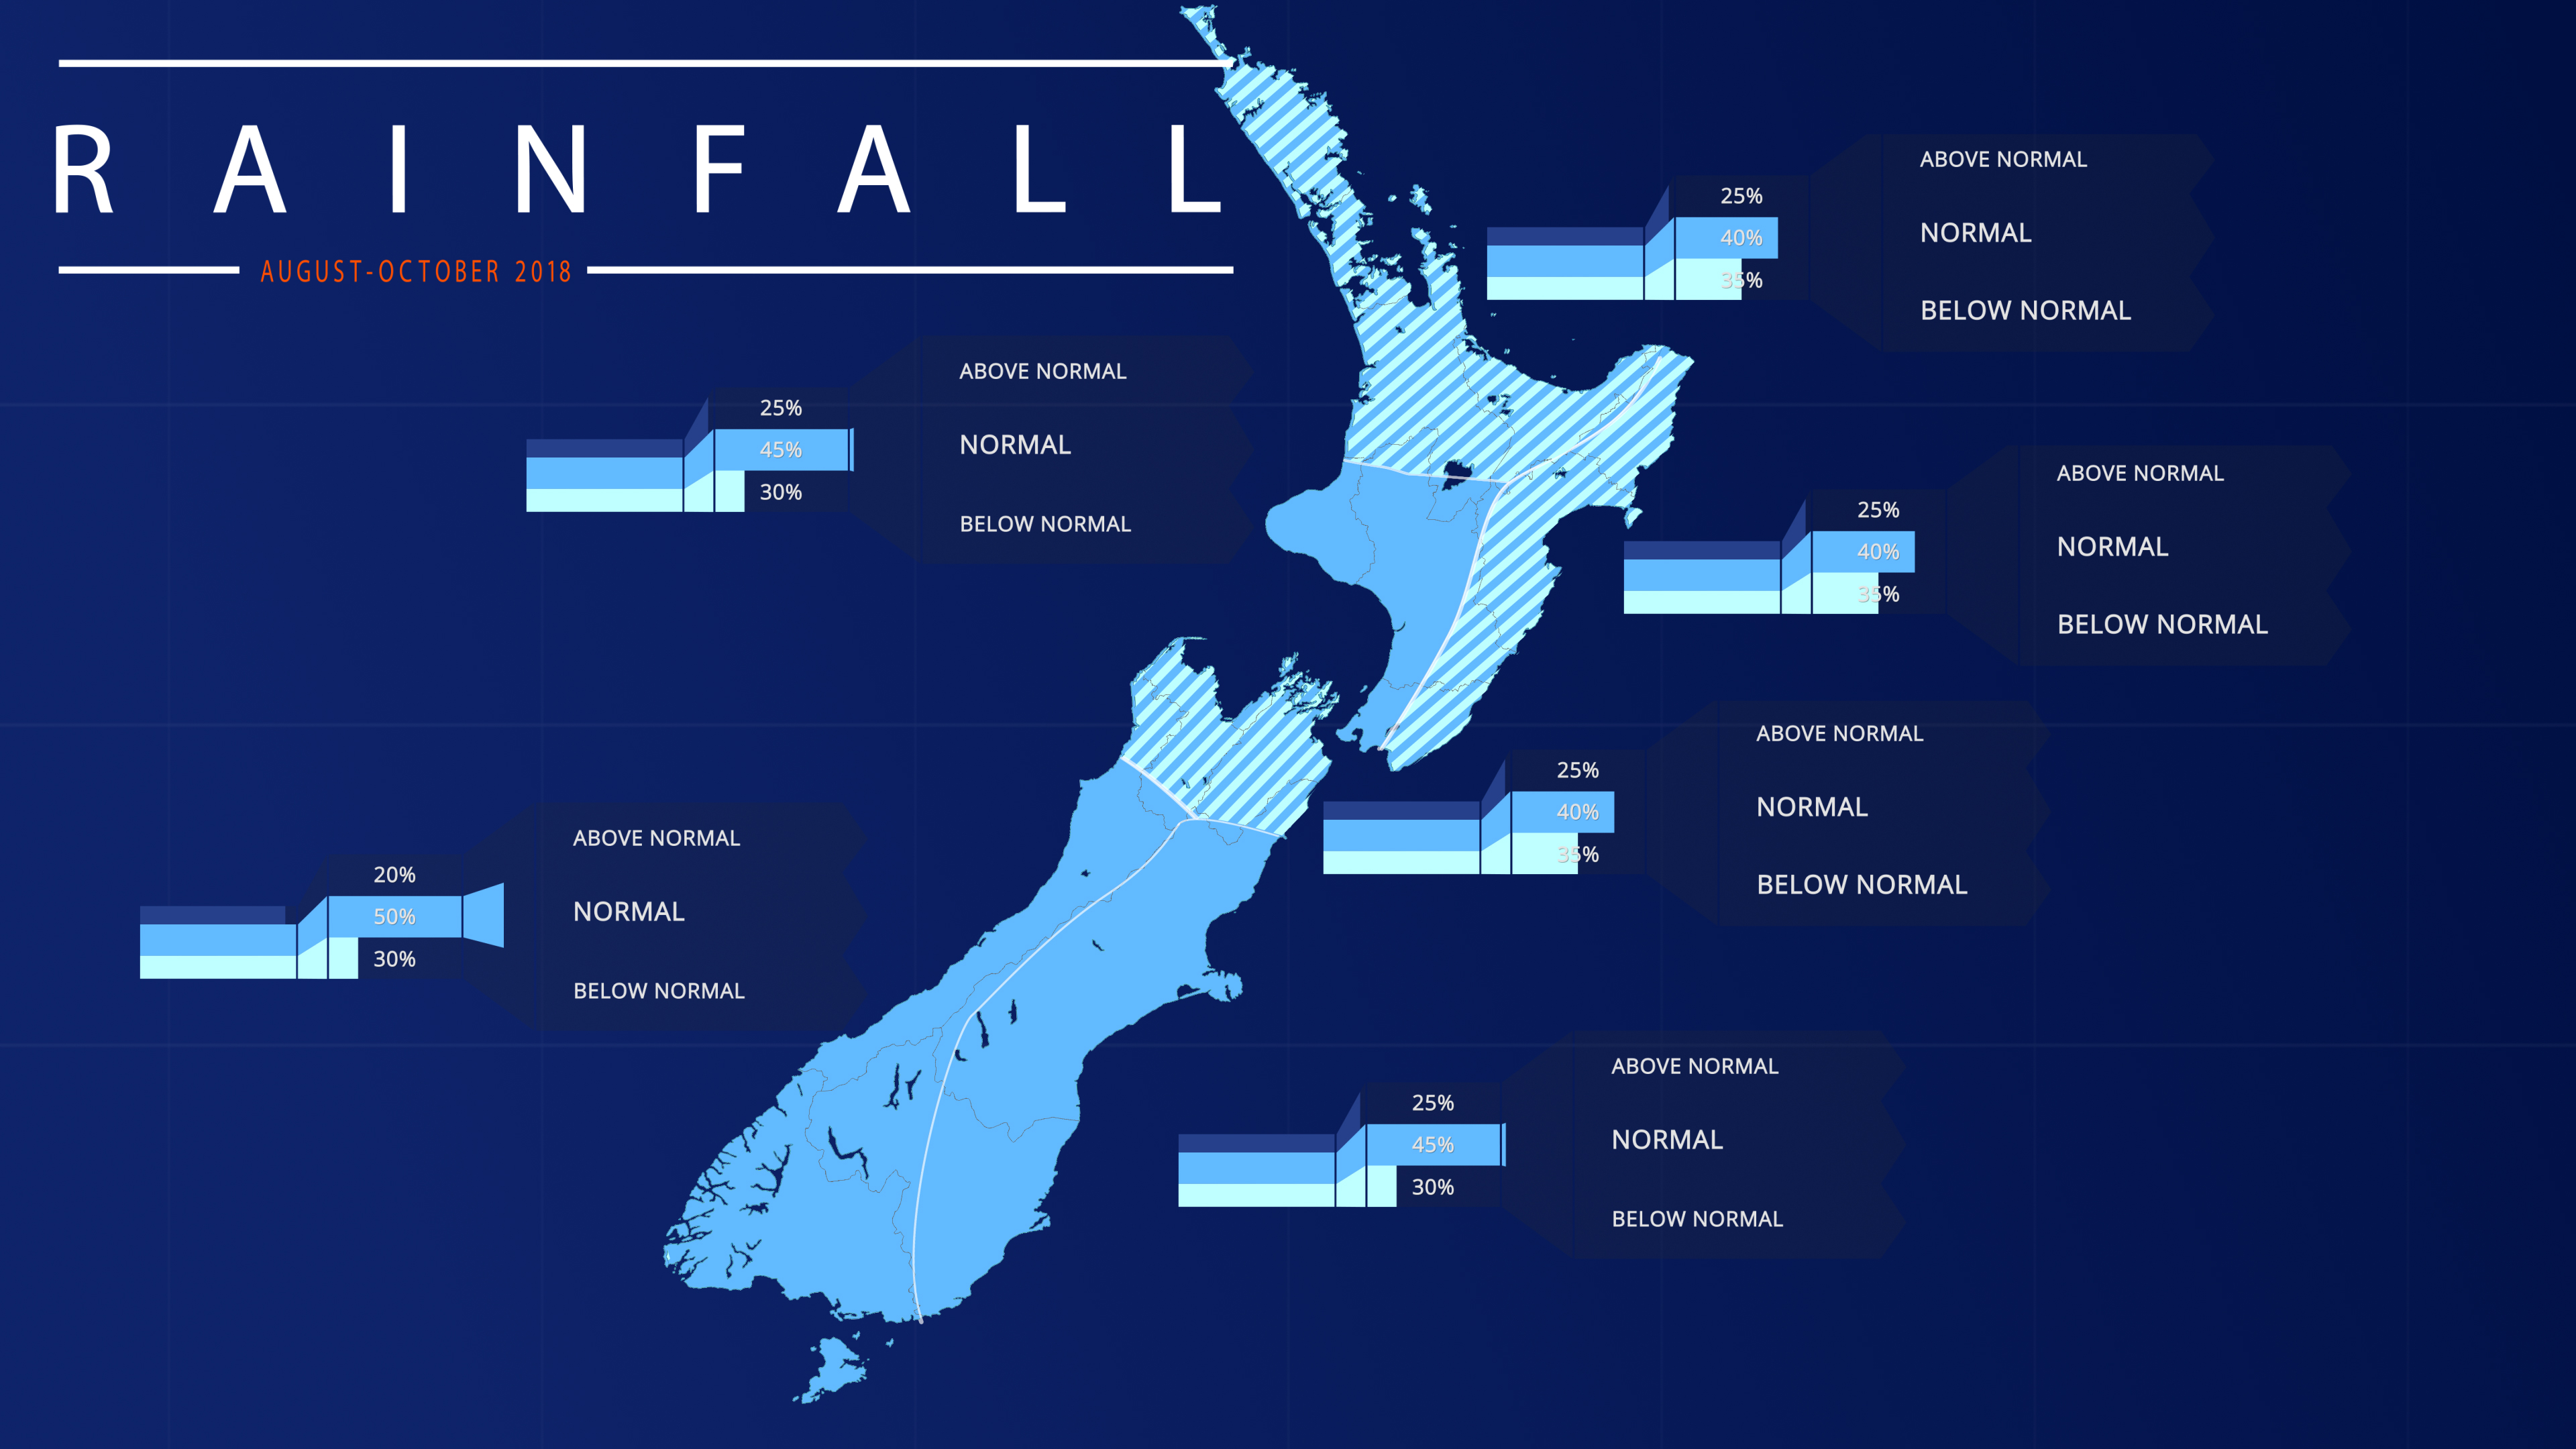
August – October 2018 rainfall totals are forecast to be near normal (40% chance) or below normal (35 – 40% chance) in the north and east of the North Island and the north of the South Island. For the west of the North Island and the west and east of the South Island, near normal rainfall totals for the season as a whole are forecast (45 – 50% chance).
August – October 2018 soil moisture levels and river flows are forecast to be near normal (35 – 40% chance) or below normal (35 – 40% chance) in the north and east of the North Island. Below normal soil moisture levels and river flows are forecast in the east of the South Island (50 – 55% chance). In the west of the North Island and the north and west of the South Island, soil moisture levels and river flows are forecast to be in the near normal (35% chance) or above normal (35 – 40% chance) range.
Regional predictions for the August – October 2018 season
Northland, Auckland, Waikato, Bay of Plenty
The table below shows the probabilities (or percent chances) for each of three categories: above average, near average, and below average. In the absence of any forecast guidance there would be an equal likelihood (33% chance) of the outcome being in any one of the three categories. Forecast information from local and global guidance models is used to indicate the deviation from equal chance expected for the coming three-month period, with the following outcomes the most likely (but not certain) for this region:
- Temperatures are most likely to be near average (50% chance).
- Rainfall totals, soil moisture levels and river flows are all about equally likely to be near normal (40% chance) or below normal (35% chance).
The full probability breakdown is:
|
Temperature |
Rainfall |
Soil moisture |
River flows |
|
|
Above average |
30 |
25 |
25 |
25 |
|
Near average |
50 |
40 |
40 |
40 |
|
Below average |
20 |
35 |
35 |
35 |
Central North Island, Taranaki, Whanganui, Manawatu, Wellington
Probabilities are assigned in three categories: above average, near average, and below average.
- Temperatures are most likely to be near average (45% chance).
- Rainfall totals are most likely to be near normal (45% chance).
- Soil moisture levels and river flows are about equally likely to be in the above normal (40% chance) or near normal range (35% chance).
The full probability breakdown is:
|
Temperature |
Rainfall |
Soil moisture |
River flows |
|
|
Above average |
35 |
25 |
40 |
40 |
|
Near average |
45 |
45 |
35 |
35 |
|
Below average |
20 |
30 |
25 |
25 |
Gisborne, Hawke’s Bay, Wairarapa
Probabilities are assigned in three categories: above average, near average, and below average.
- Temperatures are most likely to be near average (45% chance).
- Rainfall totals are about equally likely to be near normal (40% chance) or below normal (35% chance).
- Soil moisture levels and river flows are about equally likely to be in the below normal (40% chance) or near normal range (35% chance).
The full probability breakdown is:
|
Temperature |
Rainfall |
Soil moisture |
River flows |
|
|
Above average |
35 |
25 |
25 |
25 |
|
Near average |
45 |
40 |
35 |
35 |
|
Below average |
20 |
35 |
40 |
40 |
Tasman, Nelson, Marlborough, Buller
Probabilities are assigned in three categories: above average, near average, and below average.
- Temperatures are about equally likely to be above average (40% chance) or near average (35%).
- Rainfall totals are about equally likely to be near normal (40% chance) or below normal (35% chance).
- Soil moisture levels and river flows are most likely to be in the climatological range (i.e. near the long-term normal).
The full probability breakdown is:
|
Temperature |
Rainfall |
Soil moisture |
River flows |
|
|
Above average |
40 |
25 |
35 |
35 |
|
Near average |
35 |
40 |
35 |
35 |
|
Below average |
25 |
35 |
30 |
30 |
West Coast, Alps and foothills, inland Otago, Southland
Probabilities are assigned in three categories: above average, near average, and below average.
- Temperatures are about equally likely to be above average (40% chance) or near average (35% chance).
- Rainfall totals are most likely to be near normal (50% chance).
- Soil moisture levels and river flows are about equally likely to be in the near normal (40% chance) or above normal range (35% chance).
The full probability breakdown is:
|
Temperature |
Rainfall |
Soil moisture |
River flows |
|
|
Above average |
40 |
20 |
35 |
35 |
|
Near average |
35 |
50 |
40 |
40 |
|
Below average |
25 |
30 |
25 |
25 |
Coastal Canterbury, east Otago
Probabilities are assigned in three categories: above average, near average, and below average.
- Temperatures are about equally likely to be above average (45% chance) or near average (40% chance).
- Rainfall totals are most likely to be in the near normal range (45% chance).
- Soil moisture levels and river flows are most likely to be below normal (50 – 55% chance).
The full probability breakdown is:
|
Temperature |
Rainfall |
Soil moisture |
River flows |
|
|
Above average |
45 |
25 |
25 |
20 |
|
Near average |
40 |
45 |
25 |
25 |
|
Below average |
15 |
30 |
50 |
55 |
Graphical representation of the regional probabilities
Background
Surface ocean waters in the central equatorial Pacific Ocean continued to warm during July 2018 but remained in the neutral range. The preliminary monthly value for July 2018 for the NINO3.4 index was +0.47°C (was +0.27°C last month), the monthly NINO3 index was +0.52°C (+0.38°C last month), and the monthly NINO4 index was +0.45°C (+0.31°C last month). The NINO1+2 Index (in the far eastern Pacific near South America) remained cooler than average during July.
In the subsurface ocean (within the first 150 metres of the ocean), the warm anomalies present in the eastern equatorial Pacific (between about 20m and 100m depth east of 130oW) weakened slightly since June 2018, but remained more than 2.0°C above average for the month of July 2018, and the latest weekly value suggest that they are on the rise again.
Trade winds were very close to normal over most of the tropical Pacific, in contrast with the strong positive anomalies (i.e. weaker trade winds) that were present around the International Dateline during June. In the far western Pacific however (west of 160oE) a significant zonal wind slackening has appeared since about mid-July, it may be signalling the development of a “Westerly Wind Burst” which is often associated with a downwelling Kelvin wave, and might push back the system towards a more El Niño-like state during August.
The Southern Oscillation Index (SOI) was slightly positive (i.e. on the La Niña side of Neutral) with a preliminary value of +0.2 for July 2018. This is consistent with a general weakening of the El Niño-like signals that emerged over during June 2018. Along with the current state of the SOI and zonal wind anomalies, enhanced convective forcing and positive rainfall anomalies were favoured over the tropics and the northern subtropics in the western Pacific. Meanwhile, convection and rainfall was slightly reduced compared to normal in the central equatorial Pacific. The South Pacific Convergence Zone was more intense than normal and the Intertropical convergence zone was north of its climatological position in the central and eastern Pacific. The ENSO Precipitation Index (ESPI) posted a value of -0.40 for July 2018 (down from -0.35 in June).
In summary, despite a continued slow warming of ocean surface temperatures in the central and eastern equatorial Pacific, July 2018 witnessed a slight weakening of the El Niño-like signals that previously emerged in June 2018, notably in the subsurface ocean and in the atmosphere. However, intra-seasonal activity that recently developed in the far western Pacific might tip the system back to a more El Niño-like state in the next few weeks.
This is consistent with the consensus from international models, which forecast the tropical Pacific to transition toward El Niño over the next three-month period (55% chance over August – October 2018). The probability for El Niño conditions being established increases as we reach into the Southern Hemisphere summer, with 78% chance for El Niño conditions over the February – April 2019 period. The strength and characteristics of this event remain uncertain, but indications so far are that it is unlikely to be in the strong category.
Contact
Chris Brandolino, Principal Scientist – Forecasting, NIWA National Climate Centre Tel (09) 375 6335, Mobile (027) 886 0014
Ben Noll, Meteorologist, NIWA National Climate Centre Tel (09) 375 6334, Mobile (027) 405 3052
Notes to reporters and editors
- NIWA’s outlooks indicate the likelihood of climate conditions being at, above, or below average for the season as a whole. They are not ‘weather forecasts’. It is not possible to forecast precise weather conditions three months ahead of time.
- The outlooks are the result of the expert judgment of NIWA’s climate scientists. They take into account observations of atmospheric and ocean conditions and output from global and local climate models. The presence of El Niño or La Niña conditions and the sea surface temperatures around New Zealand can be a useful indicator of likely overall climate conditions for a season.
- The outlooks state the probability for above average conditions, near average conditions, and below average conditions for rainfall, temperature, soil moisture, and river flows. For example, for winter (June–July–August) 2007, for all the North Island, we assigned the following probabilities for temperature: · Above average: 60 per cent · Near average: 30 per cent · Below average: 10 per cent We therefore concluded that above average temperatures were very likely.
- This three-way probability means that a random choice would be correct only 33 per cent (or one-third) of the time. It would be like randomly throwing a dart at a board divided into three equal parts, or throwing a dice with three numbers on it. An analogy with coin tossing (a two-way probability) is not correct.
- A 50 per cent ‘hit rate’ is substantially better than guesswork, and comparable with the skill level of the best overseas climate outlooks. See, for example, analysis of global outlooks issued by the International Research Institute for Climate and Society based in the US published in the Bulletin of the American Meteorological Society (Goddard, L., A. G. Barnston, and S. J. Mason, 2003: Evaluation of the IRI’s “net assessment” seasonal climate forecasts 1997–2001. Bull. Amer. Meteor. Soc., 84, 1761–1781).
- Each month, NIWA publishes an analysis of how well its outlooks perform. This is available online and is sent to about 3500 recipients of NIWA’s newsletters, including many farmers.
- All outlooks are for the three months as a whole. There will inevitably be wet and dry days, and hot and cold days, within a season. The exact range in temperature and rainfall within each of the three categories varies with location and season. However, as a guide, the “near average” or middle category for the temperature predictions includes deviations up to ±0.5°C for the long-term mean, whereas for rainfall the “near normal” category lies between approximately 80 per cent and 115 per cent of the long-term mean.
- The seasonal climate outlooks are an output of a scientific research programme, supplemented by NIWA’s Capability Funding. NIWA does not have a government contract to produce these outlooks.
- Where probabilities are within 5% of one another, the term “about equally” is used.