Strong El Niño conditions continued in the tropical Pacific during February 2016.
Sea surface temperature anomalies still exceed +2oC in the central and eastern Pacific, but have cooled by 0.5°C or more from the peak values in November 2015. The sub-surface ocean temperature anomalies in the eastern Pacific have decreased further since January, and anomalies of about +3°C are now confined to a layer above 75m east of 120oW. However, the Southern Oscillation Index has remained strong (near -2.0) during February.
International guidance indicates that El Niño conditions will continue (99% probability) over the next three months (March – May 2016) as a whole, but weaken towards neutral conditions by the end of autumn. During winter (June – August), neutral conditions are likely to prevail (56%), whereas La Niña conditions are most likely to establish in spring (49%).
For March – May 2016, above normal pressure is forecast to the north and northeast of New Zealand, while below normal pressure is expected to the south of the country. This circulation pattern is likely to be accompanied by anomalous northerly and north-westerly wind flows.
Outlook Summary
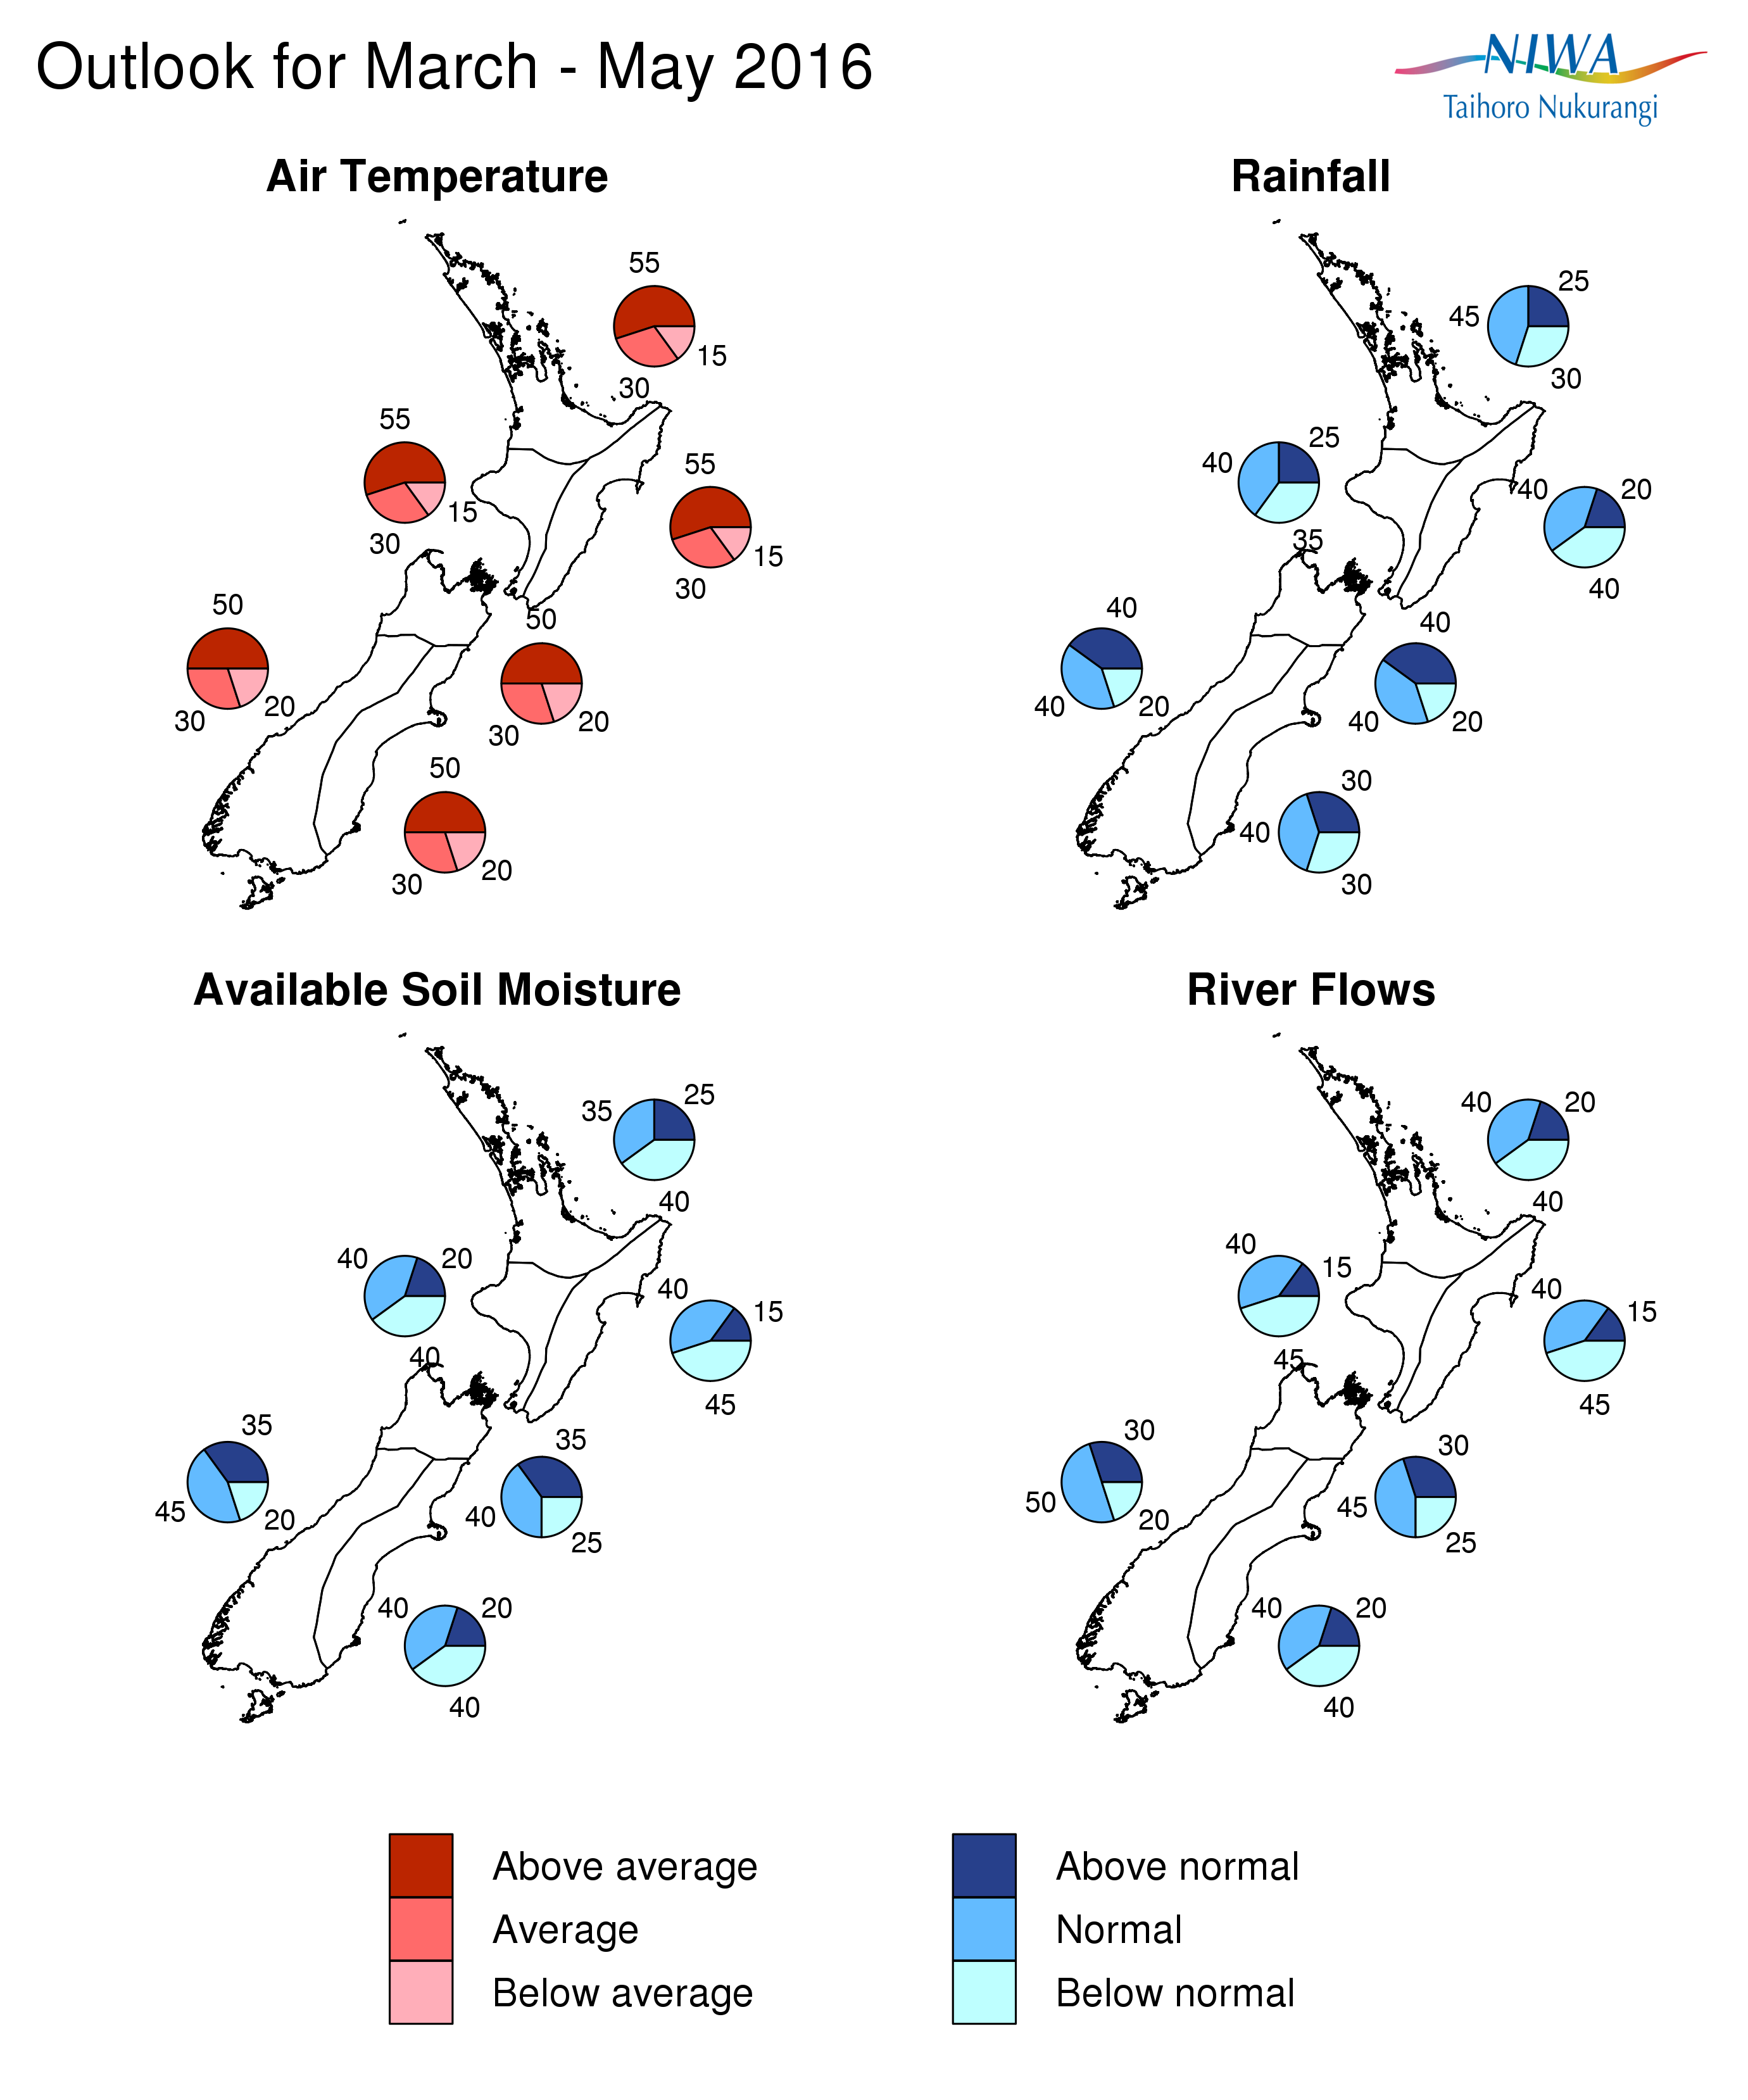
March – May 2016 temperatures are forecast to be above average for all regions of the country. Nevertheless, as autumn progresses, frosts may occur from time to time in cooler locations. Sea surface temperatures around New Zealand are forecast to be above average, particularly to the west of the country.
March – May 2016 rainfall is forecast to be near normal for the north of the North Island and east of the South Island. Normal or below normal rainfall totals are likely for the west and east of the North Island, whereas normal or above normal is likely for the north and west of the South Island.
March – May 2016 soil moisture levels and river flows are forecast to be below normal or normal for all North Island regions and also for the east of the South Island. For the north of the South Island, soil moisture levels are forecast to be normal or above normal, and river flows near normal. Normal soil moisture levels and river flows are expected for the west of the South Island.
Regional predictions for the March - May 2016 season
Northland, Auckland, Waikato, Bay of Plenty
The table below shows the probabilities (or percent chances) for each of three categories: above average, near average, and below average. In the absence of any forecast guidance there would be an equal likelihood (33% chance) of the outcome being in any one of the three categories. Forecast information from local and global guidance models is used to indicate the deviation from equal chance expected for the coming three month period, with the following outcomes the most likely (but not certain) for this region:
- Temperatures are most likely to be above average (55% chance).
- Rainfall totals are most likely to be in the normal range (45% chance).
- Soil moisture levels and river flows are about equally likely to be below normal (40% chance) or near normal (35-40% chance).
The full probability breakdown is:
|
Temperature |
Rainfall |
Soil moisture |
River flows |
|
|
Above average |
55 |
25 |
25 |
20 |
|
Near average |
30 |
45 |
35 |
40 |
|
Below average |
15 |
30 |
40 |
40 |
Central North Island, Taranaki, Wanganui, Manawatu, Wellington
Probabilities are assigned in three categories: above average, near average, and below average.
- Temperatures are most likely to be above average (55% chance).
- Rainfall totals are about equally likely to be near normal (40% chance) or below normal (35% chance).
- Soil moisture levels and river flows are about equally likely to be near normal (40% chance) or below normal (40-45% chance).
The full probability breakdown is:
|
Temperature |
Rainfall |
Soil moisture |
River flows |
|
|
Above average |
55 |
25 |
20 |
15 |
|
Near average |
30 |
40 |
40 |
40 |
|
Below average |
15 |
35 |
40 |
45 |
Gisborne, Hawke’s Bay, Wairarapa
Probabilities are assigned in three categories: above average, near average, and below average.
- Temperatures are most likely to be above average (55% chance).
- Rainfall is equally likely to be below normal (40% chance) or near normal (40% chance).
- Soil moisture levels and river flows are about equally likely to be below normal (45% chance) or near normal (40% chance).
The full probability breakdown is:
|
Temperature |
Rainfall |
Soil moisture |
River flows |
|
|
Above average |
55 |
20 |
15 |
15 |
|
Near average |
30 |
40 |
40 |
40 |
|
Below average |
15 |
40 |
45 |
45 |
Nelson, Marlborough, Buller
Probabilities are assigned in three categories: above average, near average, and below average.
- Temperatures are most likely to be above average (50% chance).
- Rainfall totals and soil moisture levels are about equally likely to be normal (40% chance) or above normal (35-40% chance).
- River flows are most likely to be normal (45% chance).
The full probability breakdown is:
|
Temperature |
Rainfall |
Soil moisture |
River flows |
|
|
Above average |
50 |
40 |
35 |
30 |
|
Near average |
30 |
40 |
40 |
45 |
|
Below average |
20 |
20 |
25 |
25 |
West Coast, Alps and foothills, inland Otago, Southland
Probabilities are assigned in three categories: above average, near average, and below average.
- Temperatures are most likely to be above average (50% chance).
- Rainfall is equally likely to be normal (40% chance) or above normal (40% chance).
- Soil moisture levels and river flows are most likely to be near normal (45-50% chance).
The full probability breakdown is:
|
Temperature |
Rainfall |
Soil moisture |
River flows |
|
|
Above average |
50 |
40 |
35 |
30 |
|
Near average |
30 |
40 |
45 |
50 |
|
Below average |
20 |
20 |
20 |
20 |
Coastal Canterbury, east Otago
Probabilities are assigned in three categories: above average, near average, and below average.
- Temperatures are most likely to be above average (50% chance).
- Rainfall is likely to be near normal (40% chance).
- Soil moisture levels and river flows are equally likely to be near normal (40% chance) or below normal (40% chance).
The full probability breakdown is:
|
Temperature |
Rainfall |
Soil moisture |
River flows |
|
|
Above average |
50 |
30 |
20 |
20 |
|
Near average |
30 |
40 |
40 |
40 |
|
Below average |
20 |
30 |
40 |
40 |
Graphical representation of the regional probabilities
Background
Strong El Niño conditions continued in the tropical Pacific during February 2016. Sea surface temperature anomalies still exceed +2oC in the central and eastern Pacific, but have cooled by 0.5°C or more from the peak values in November 2015. Sub-surface ocean temperatures anomalies in the eastern Pacific also cooled further in February 2016, and retreated to east of 120oW. More significantly, the warm sub-surface anomaly is now confined above 75m depth, with a cool anomaly undercutting it at about 100-150m across almost the entire width of the Pacific. The warm surface layer could thus dissipate quickly.
The Southern Oscillation Index (SOI) remained strongly negative during February, with a value similar to that of January at about -2.0. Westerly wind anomalies virtually disappeared west of the Dateline, but were still evident around 180-150°W during the month. The Intertropical Convergence Zone (ITCZ) was clearly displaced towards the Equator in the central and eastern Pacific, and the South Pacific Convergence Zone (SPCZ) was shifted to the north and east of its climatological position, both signals being consistent with El Niño.
International guidance indicates that El Niño conditions will continue (99% chance) over the next three month period (March – May 2016) as a whole. However, there is expected to be a weakening in all El Niño indices during this time (autumn). In winter (June – August 2016), the suite of ENSO prediction models indicate neutral conditions are most likely (56% chance), with only a 15% chance of El Niño conditions persisting through this season. For the September – November season, the models forecasts a 49% chance of La Niña conditions and 36% for neutral conditions.
During February 2016, there was unusually persistent northerly and northeasterly airflow onto the North Island, and northwesterly airflow onto the South Island, resulting in extremely warm conditions – a near tie with February 1998 as the warmest February in the New Zealand land temperature record. Waters surrounding New Zealand also warmed markedly during this time under the predominant northerly quarter airflow, and are about 1°C warmer (relative to climatology) in February compared to January. Vertical profiles from the Argo floats in the Tasman suggest the surface warming is not present at depth, but only in a shallow surface layer, and could therefore dissipate quickly. Nevertheless, the current warm conditions, and the forecast continuation of more northwesterly airflow than usual for a typical autumn El Niño, form the basis of our March – May climate outlook.
To find out more about normal conditions for this outlook period, refer to NIWA’s website, where daily updates on climate maps are available.
Download
Download the Seasonal Climate Outlook March - May 2016 [732 KB PDF]
Contact
For comment, please contact
Chris Brandolino, Principal Scientist – Forecasting, NIWA National Climate Centre
Tel (09) 375 6335, Mobile (027) 886 0014
Dr Brett Mullan, Principal Scientist, NIWA National Climate Centre
Tel (04) 386 0508, Mobile (027) 294 1169.
Notes to reporters and editors
- NIWA’s outlooks indicate the likelihood of climate conditions being at, above, or below average for the season as a whole. They are not ‘weather forecasts’. It is not possible to forecast precise weather conditions three months ahead of time.
- The outlooks are the result of the expert judgment of NIWA’s climate scientists. They take into account observations of atmospheric and ocean conditions and output from global and local climate models. The presence of El Niño or La Niña conditions and the sea surface temperatures around New Zealand can be a useful indicator of likely overall climate conditions for a season.
- The outlooks state the probability for above average conditions, near average conditions, and below average conditions for rainfall, temperature, soil moisture, and river flows. For example, for winter (June–July–August) 2007, for all the North Island, we assigned the following probabilities for temperature: · Above average: 60 per cent · Near average: 30 per cent · Below average: 10 per cent We therefore concluded that above average temperatures were very likely.
- This three-way probability means that a random choice would be correct only 33 per cent (or one-third) of the time. It would be like randomly throwing a dart at a board divided into three equal parts, or throwing a dice with three numbers on it. An analogy with coin tossing (a two-way probability) is not correct.
- A 50 per cent ‘hit rate’ is substantially better than guesswork, and comparable with the skill level of the best overseas climate outlooks. See, for example, analysis of global outlooks issued by the International Research Institute for Climate and Society based in the US published in the Bulletin of the American Meteorological Society (Goddard, L., A. G. Barnston, and S. J. Mason, 2003: Evaluation of the IRI’s “net assessment” seasonal climate forecasts 1997–2001. Bull. Amer. Meteor. Soc., 84, 1761–1781).
- Each month, NIWA publishes an analysis of how well its outlooks perform. This is available online and is sent to about 3500 recipients of NIWA’s newsletters, including many farmers. See www.niwa.co.nz/our-science/climate/publications/all/cu
- All outlooks are for the three months as a whole. There will inevitably be wet and dry days, and hot and cold days, within a season. The exact range in temperature and rainfall within each of the three categories varies with location and season. However, as a guide, the “near average” or middle category for the temperature predictions includes deviations up to ±0.5°C for the long-term mean, whereas for rainfall the “near normal” category lies between approximately 80 per cent and 115 per cent of the long-term mean.
- The seasonal climate outlooks are an output of a scientific research programme, supplemented by NIWA’s Capability Funding. NIWA does not have a government contract to produce these outlooks.
- Where probabilities are within 5% of one another, the term “about equally” is used.
Visit our media centre at: www.niwa.co.nz/news-publications/media-centre