Outlook Summary
- Moderate La Niña conditions continued during September and a marine heatwave strengthened in Aotearoa New Zealand’s coastal waters. Both are expected to influence the climate over the next three months. See the background for more information.
- Air pressure is forecast to be higher than normal around New Zealand, especially near the South Island and east of the country. This will likely be associated with less frequent westerly winds, more northeasterly winds, and the potential for longer dry spells in western areas.
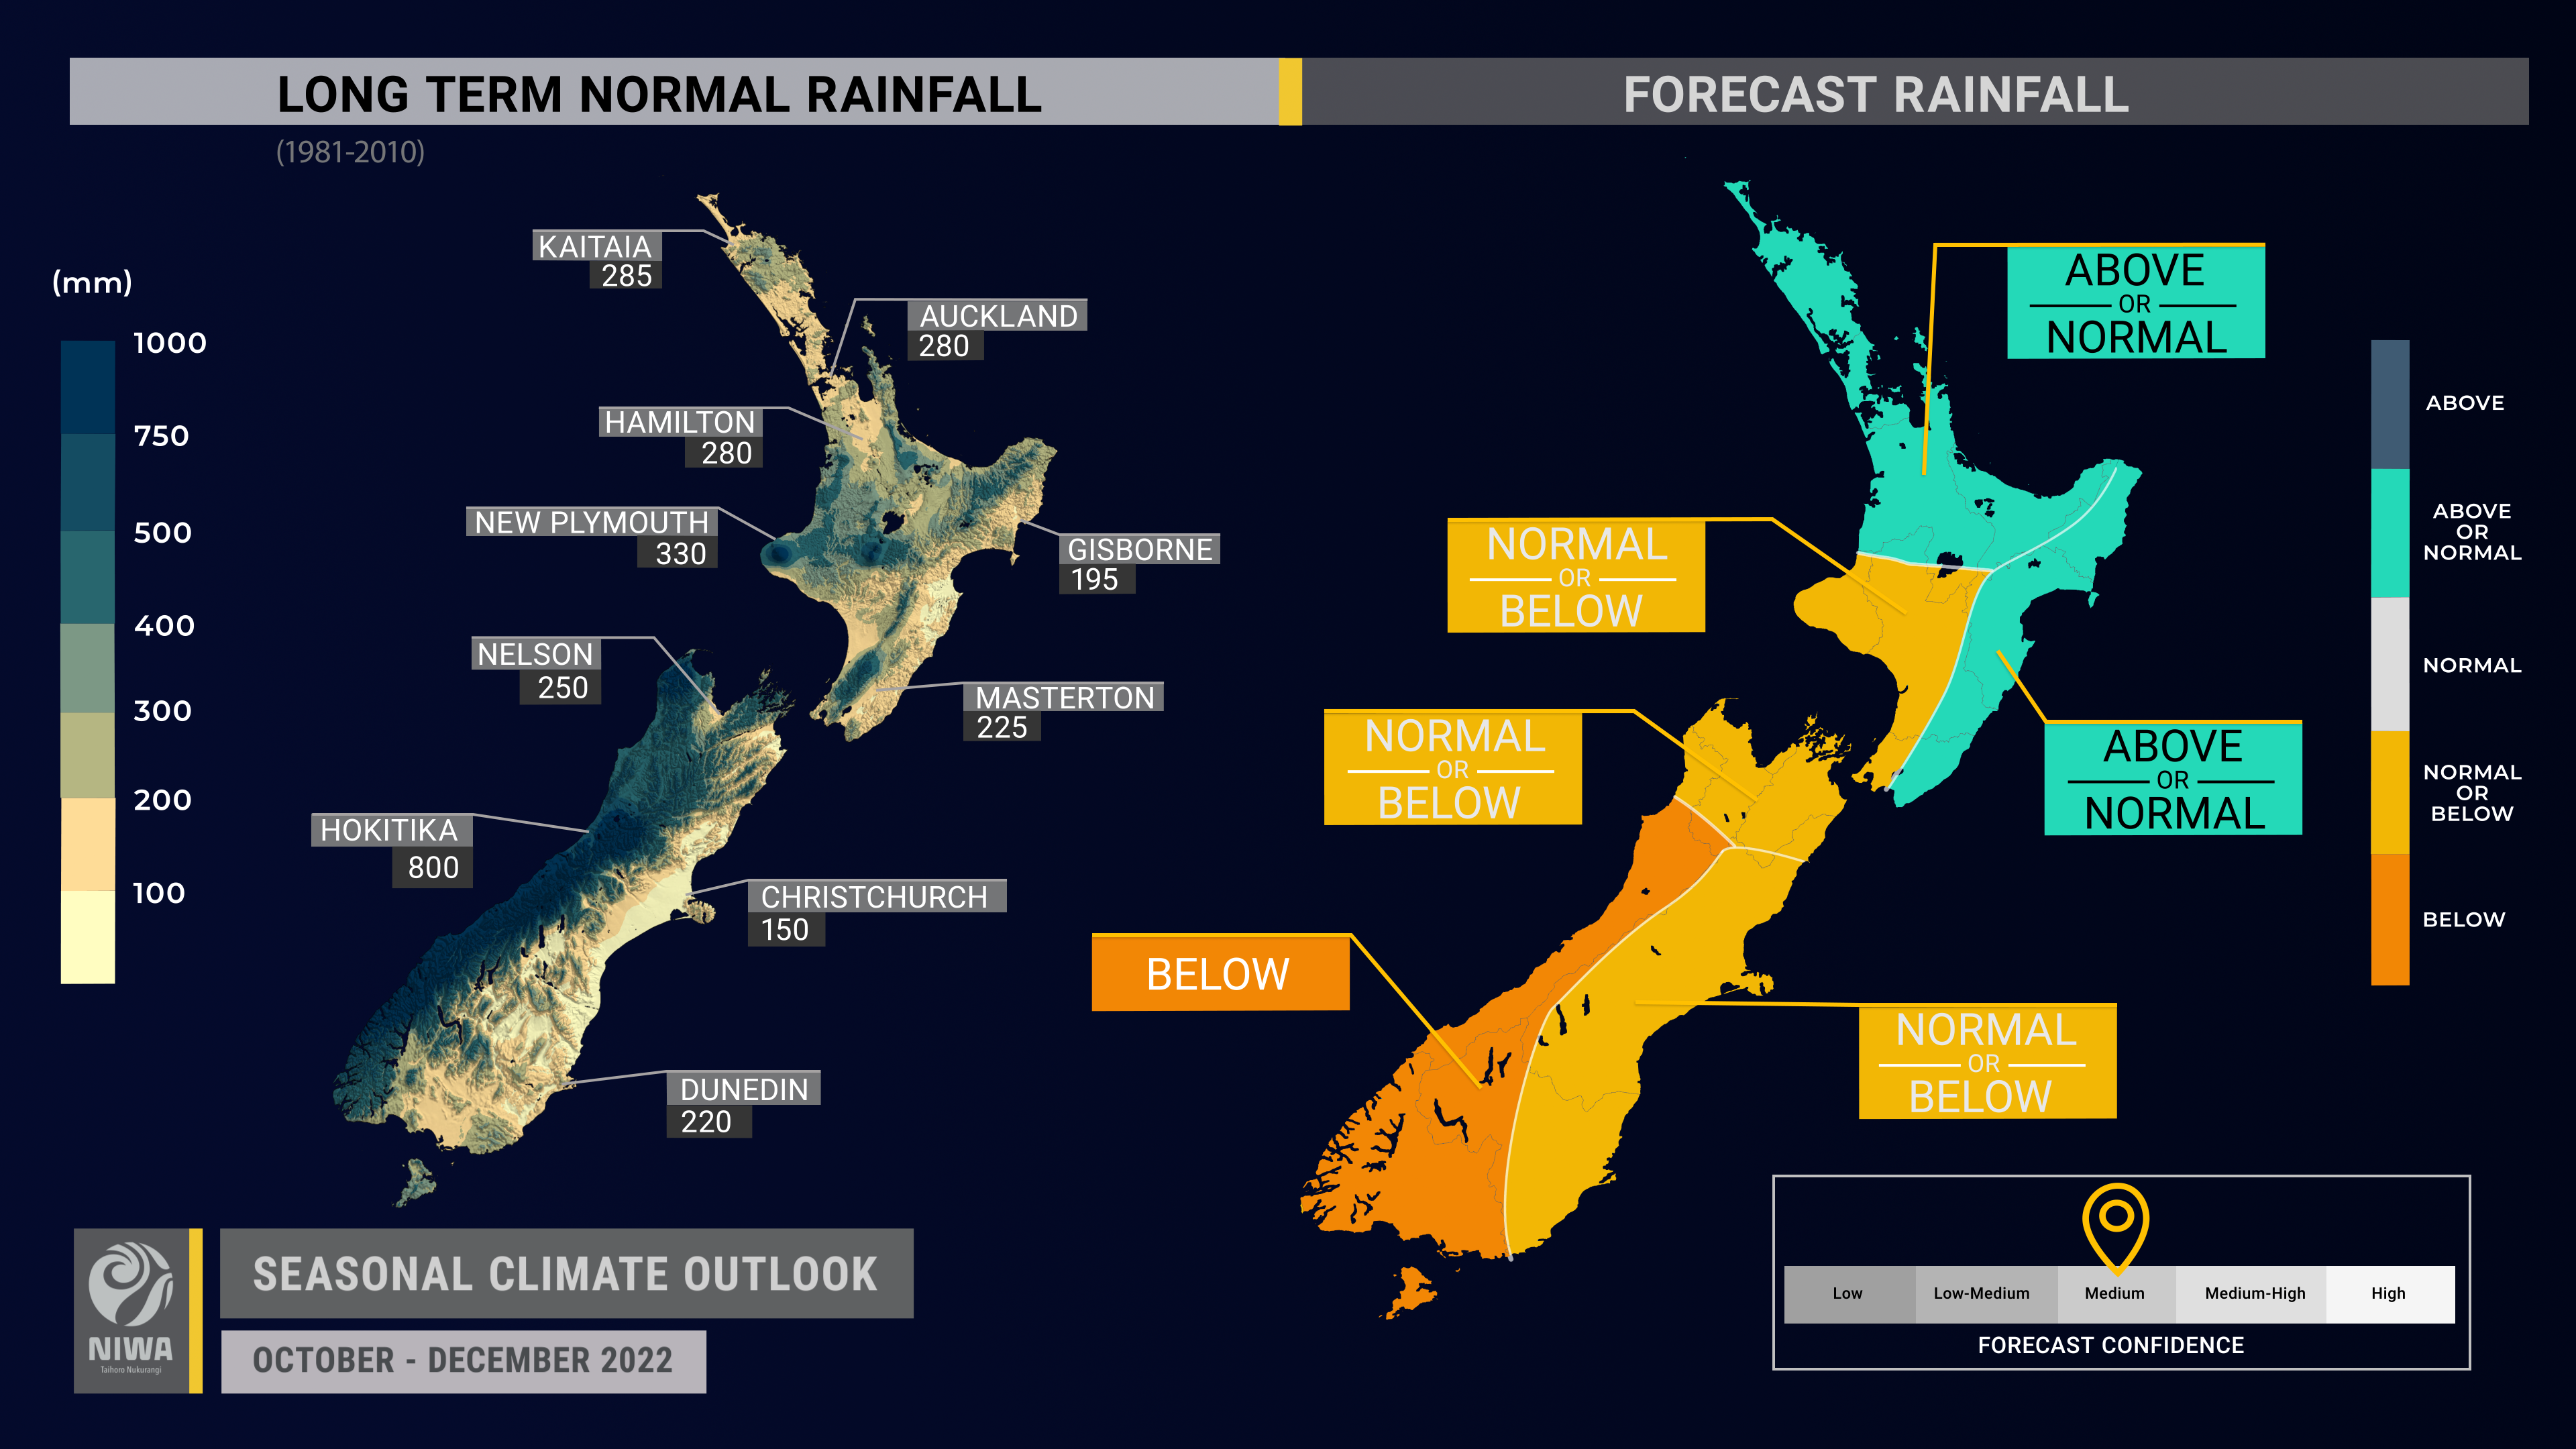
- Rainfall is most likely to be below normal in the west of the South Island, about equally likely to be near normal or above normal in the north and east of the North Island, and about equally likely to be near normal or below normal in all other regions. Occasional sub-tropical lows are expected, elevating the risk for heavy rain in the north and east of the North Island.
- There is an increased risk for early-season tropical cyclone activity in the Southwest Pacific during November and December, however it is not possible to predict where they might form or track months in advance. The tropical cyclone outlook will be released in October.
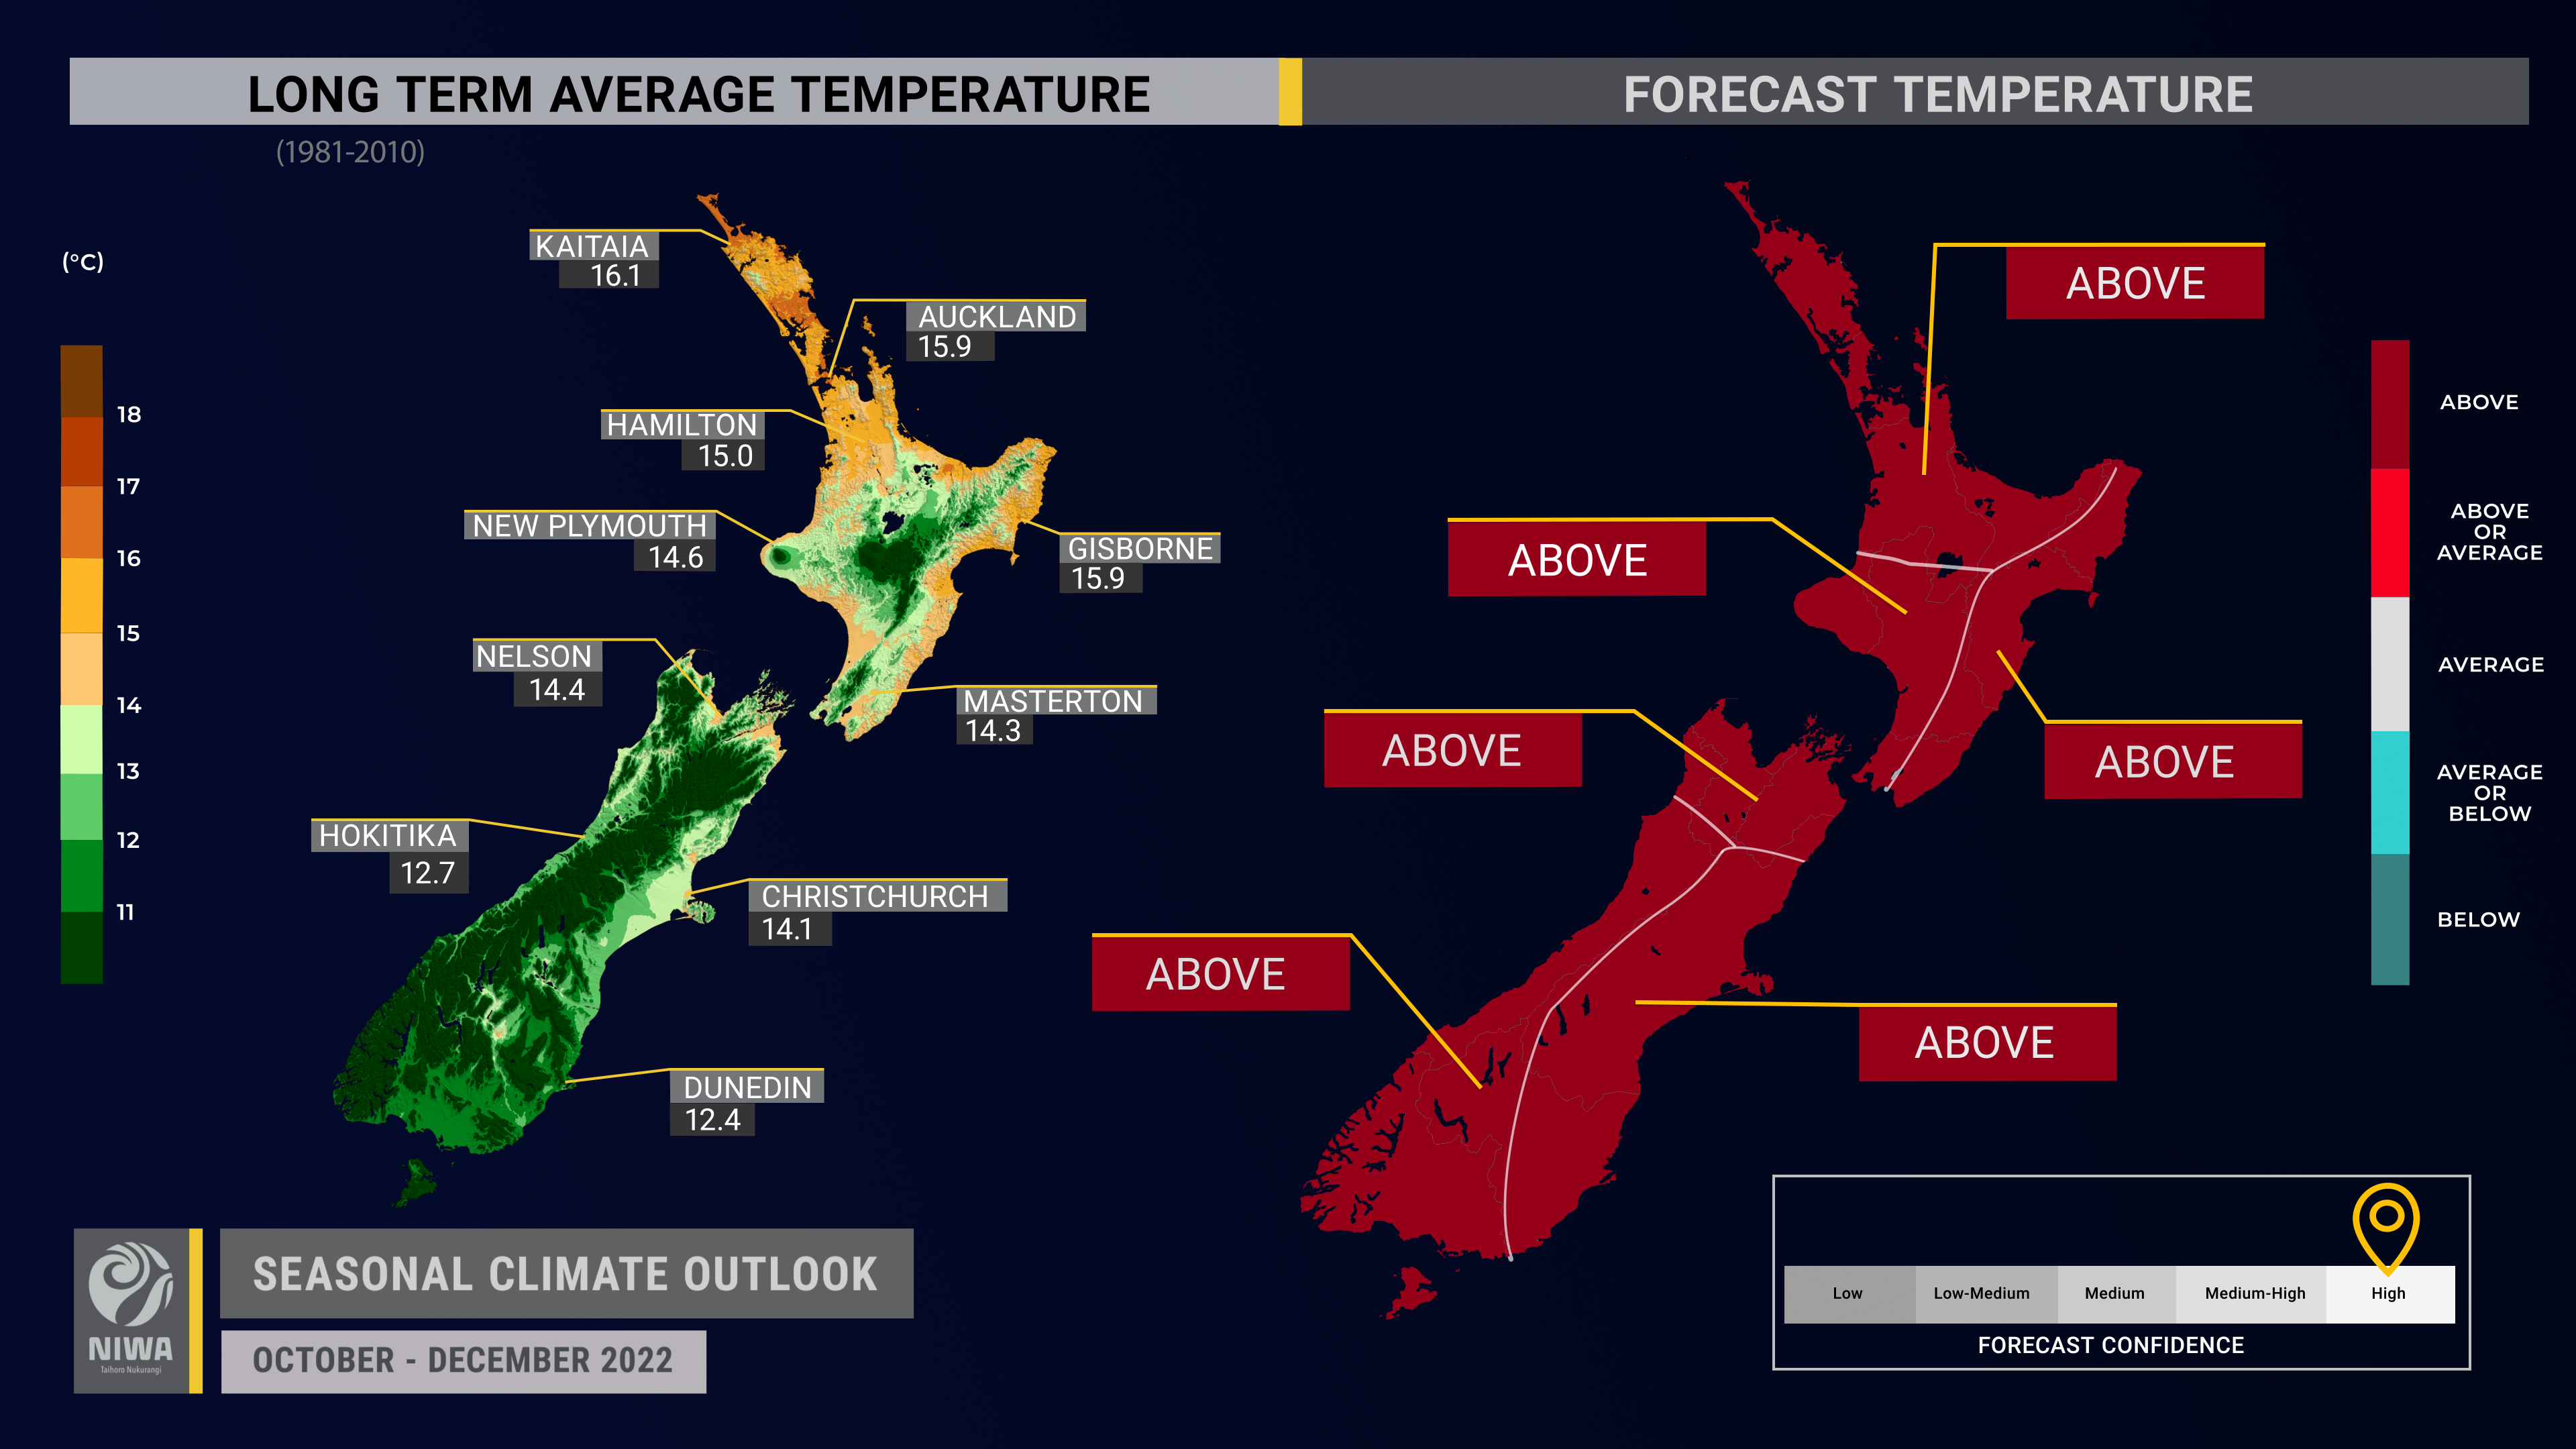
- Temperatures are very likely to be warmer than average in the North Island and north and west of the South Island, and most likely to be warmer than average in the east of the South Island. October may have variable temperatures before a more marked rise in November and December, along with an increase in humidity.
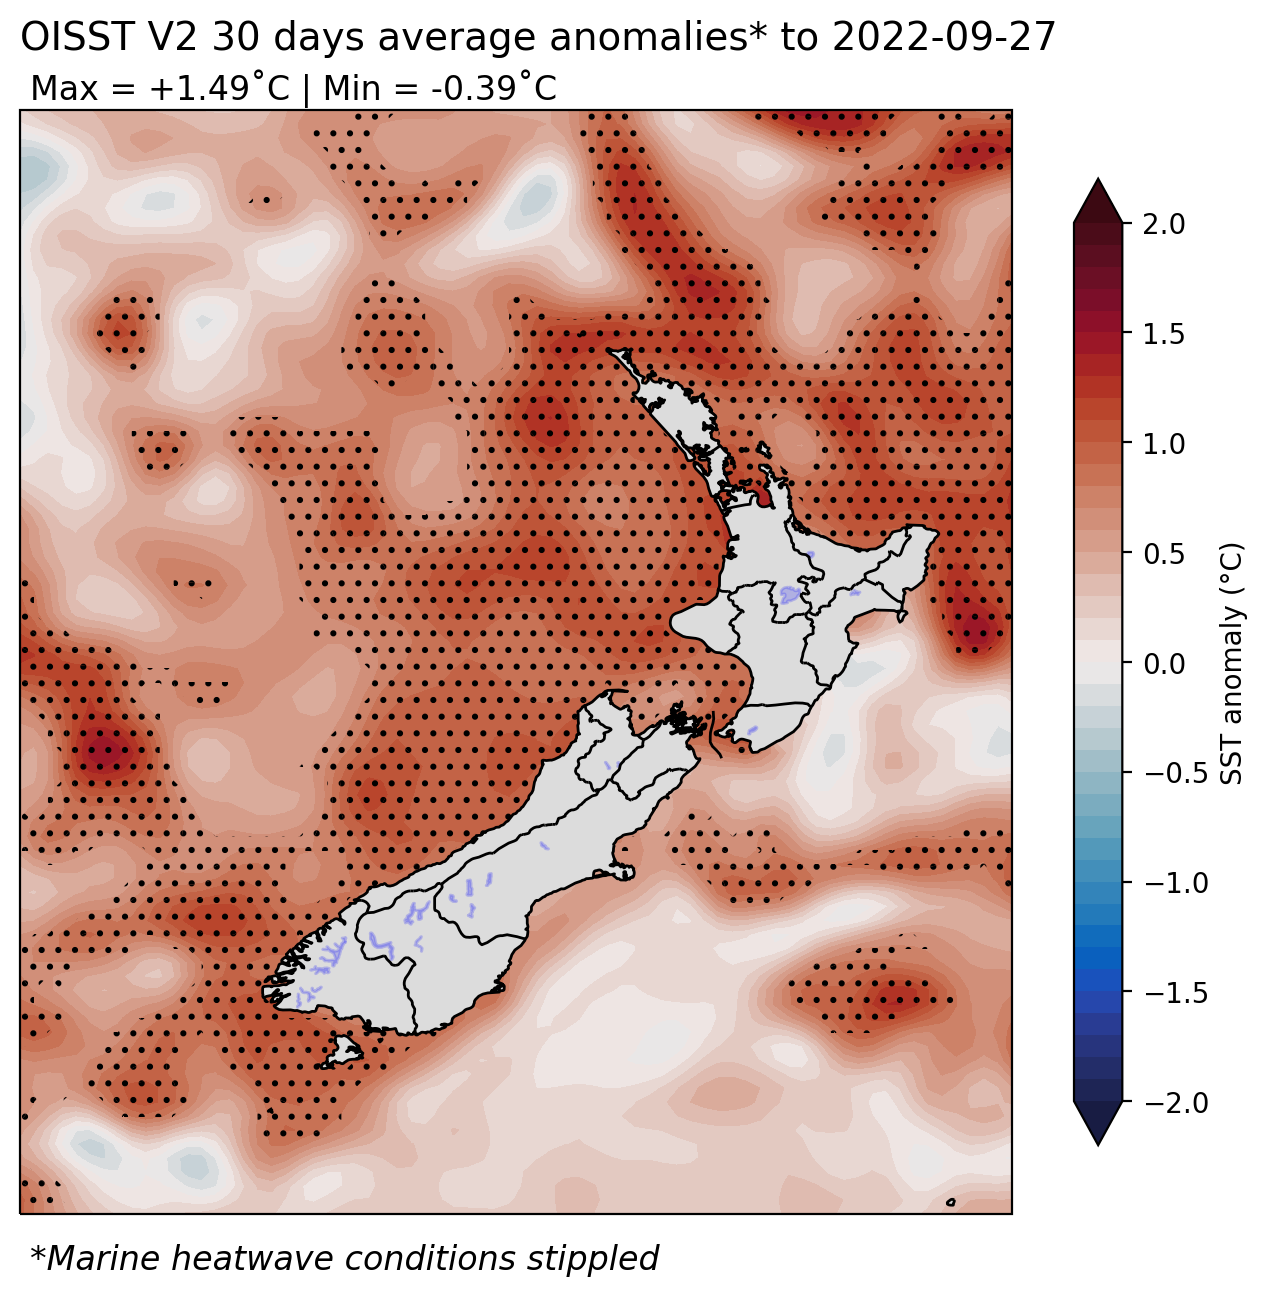
- Coastal sea surface temperatures (SSTs) ranged from 0.6˚C to 1.0˚C above average during September with marine heatwave conditions continuing offshore of many regions. Many climate models show an increase in SST anomalies (difference from average) during the October-December period. For more information, see the NIWA SST Update.
- Soil moisture levels and river flows are about equally likely to be near normal or below normal in all regions except the north and east of the North Island, where they may be higher due to more frequent rainfall events.
Regional predictions for October – December 2022
Northland, Auckland, Waikato, Bay of Plenty
The table below shows the probabilities (or percent chances) for each of three categories: above average, near average, and below average. In the absence of any forecast guidance there would be an equal likelihood (33% chance) of the outcome being in any one of the three categories. Forecast information from local and global guidance models is used to indicate the deviation from equal chance expected for the coming three-month period, with the following outcomes the most likely (but not certain) for this region:
- Temperatures are very likely to be above average (70% chance). More northeasterly winds and marine heatwave conditions will result in unseasonable warmth and humidity at times.
- Rainfall totals are about equally likely to be near normal (40% chance) or above normal (35% chance). Sub-tropical low pressure systems will occasionally track toward the region, such as during the first and third week of October, increasing the risk for heavy rain.
- Conversely, more northeasterly winds could lead to dry spells, particularly in the south-west of the region, such as Waikato.
- Soil moisture levels and river flows are most likely to be near normal (45% chance).
The full probability breakdown is:
|
Temperature |
Rainfall |
Soil moisture |
River flows |
|
|
Above average |
70 |
35 |
35 |
35 |
|
Near average |
25 |
40 |
45 |
45 |
|
Below average |
05 |
25 |
20 |
20 |
Central North Island, Taranaki, Whanganui, Manawatu, Wellington
Probabilities are assigned in three categories: above average, near average, and below average.
- Temperatures are very likely to be above average (70% chance). More northeasterly winds and marine heatwave conditions will result in unseasonable warmth and humidity at times.
- Rainfall totals are about equally likely to be near normal (40% chance) or below normal (35% chance). Fewer westerly winds will increase the risk for dry spells.
- Soil moisture levels and river flows are about equally likely to be near normal (40% chance) or below normal (35% chance).
The full probability breakdown is:
|
Temperature |
Rainfall |
Soil moisture |
River flows |
|
|
Above average |
70 |
25 |
25 |
25 |
|
Near average |
25 |
40 |
40 |
40 |
|
Below average |
05 |
35 |
35 |
35 |
Gisborne, Hawke’s Bay, Wairarapa
Probabilities are assigned in three categories: above average, near average, and below average.
- Temperatures are very likely to be above average (65% chance). More northeasterly winds may lead to higher humidity levels, more cloud cover, and warmer overnight temperatures. Fewer northwesterly winds may limit the number of hot days.
- Rainfall totals are about equally likely to be near normal (40% chance) or above normal (35% chance). More frequent onshore winds could lead to more wet days. Sub-tropical low pressure systems will occasionally track toward the region, such as during the first and third week of October, increasing the risk for heavy rain, particularly in northern Hawke’s Bay and Gisborne.
- Soil moisture levels and river flows are about equally likely to be near normal or above normal (40-45% chance).
The full probability breakdown is:
|
Temperature |
Rainfall |
Soil moisture |
River flows |
|
|
Above average |
65 |
35 |
45 |
40 |
|
Near average |
30 |
40 |
40 |
45 |
|
Below average |
05 |
25 |
15 |
15 |
Tasman, Nelson, Marlborough, Buller
Probabilities are assigned in three categories: above average, near average, and below average.
- Temperatures are very likely to be above average (60% chance). More northeasterly winds and marine heatwave conditions will result in unseasonable warmth and humidity at times.
- Rainfall is equally likely to be near normal (40% chance) or below normal (40% chance). Fewer westerly winds may lead to dry spells, particularly in western parts of the region like Tasman and Buller.
- Soil moisture levels and river flows are about equally likely to be near normal or below normal (40-45% chance).
The full probability breakdown is:
|
Temperature |
Rainfall |
Soil moisture |
River flows |
|
|
Above average |
60 |
20 |
15 |
15 |
|
Near average |
35 |
40 |
40 |
40 |
|
Below average |
05 |
40 |
45 |
45 |
West Coast, Alps and foothills, inland Otago, Southland
Probabilities are assigned in three categories: above average, near average, and below average.
- Temperatures are very likely to be above average (65% chance). More northeasterly winds and marine heatwave conditions will cause increased sunshine and warmer temperatures.
- Rainfall totals are most likely to be below normal (50% chance). More offshore winds will likely result in extended dry spells. Low rainfall may also occur around the hydro lakes. However, occasional heavy rainfall events may still occur, such as in the 2nd week of October.
- Soil moisture levels and river flows are about equally likely to be near normal (45% chance) or below normal (50% chance).
The full probability breakdown is:
|
Temperature |
Rainfall |
Soil moisture |
River flows |
|
|
Above average |
65 |
20 |
05 |
05 |
|
Near average |
35 |
30 |
45 |
45 |
|
Below average |
05 |
50 |
50 |
50 |
Coastal Canterbury, east Otago
Probabilities are assigned in three categories: above average, near average, and below average.
- Temperatures are most likely to be above average (55% chance). Fewer northwesterly winds may lead to fewer hot days, although more frequent northeasterly winds may contribute to more cloud cover and warmer overnight temperatures.
- Rainfall totals are about equally likely to be near normal (40% chance) or below normal (35% chance). Frequent anticyclones may contribute to longer dry spells, although these may be interspersed with occasional sub-tropical lows that bring rain from the north, particularly for North Canterbury.
- Soil moisture levels and river flows are about equally likely to be near normal (45% chance) or below normal (40% chance).
The full probability breakdown is:
|
Temperature |
Rainfall |
Soil moisture |
River flows |
|
|
Above average |
55 |
25 |
15 |
15 |
|
Near average |
40 |
40 |
45 |
45 |
|
Below average |
05 |
35 |
40 |
40 |
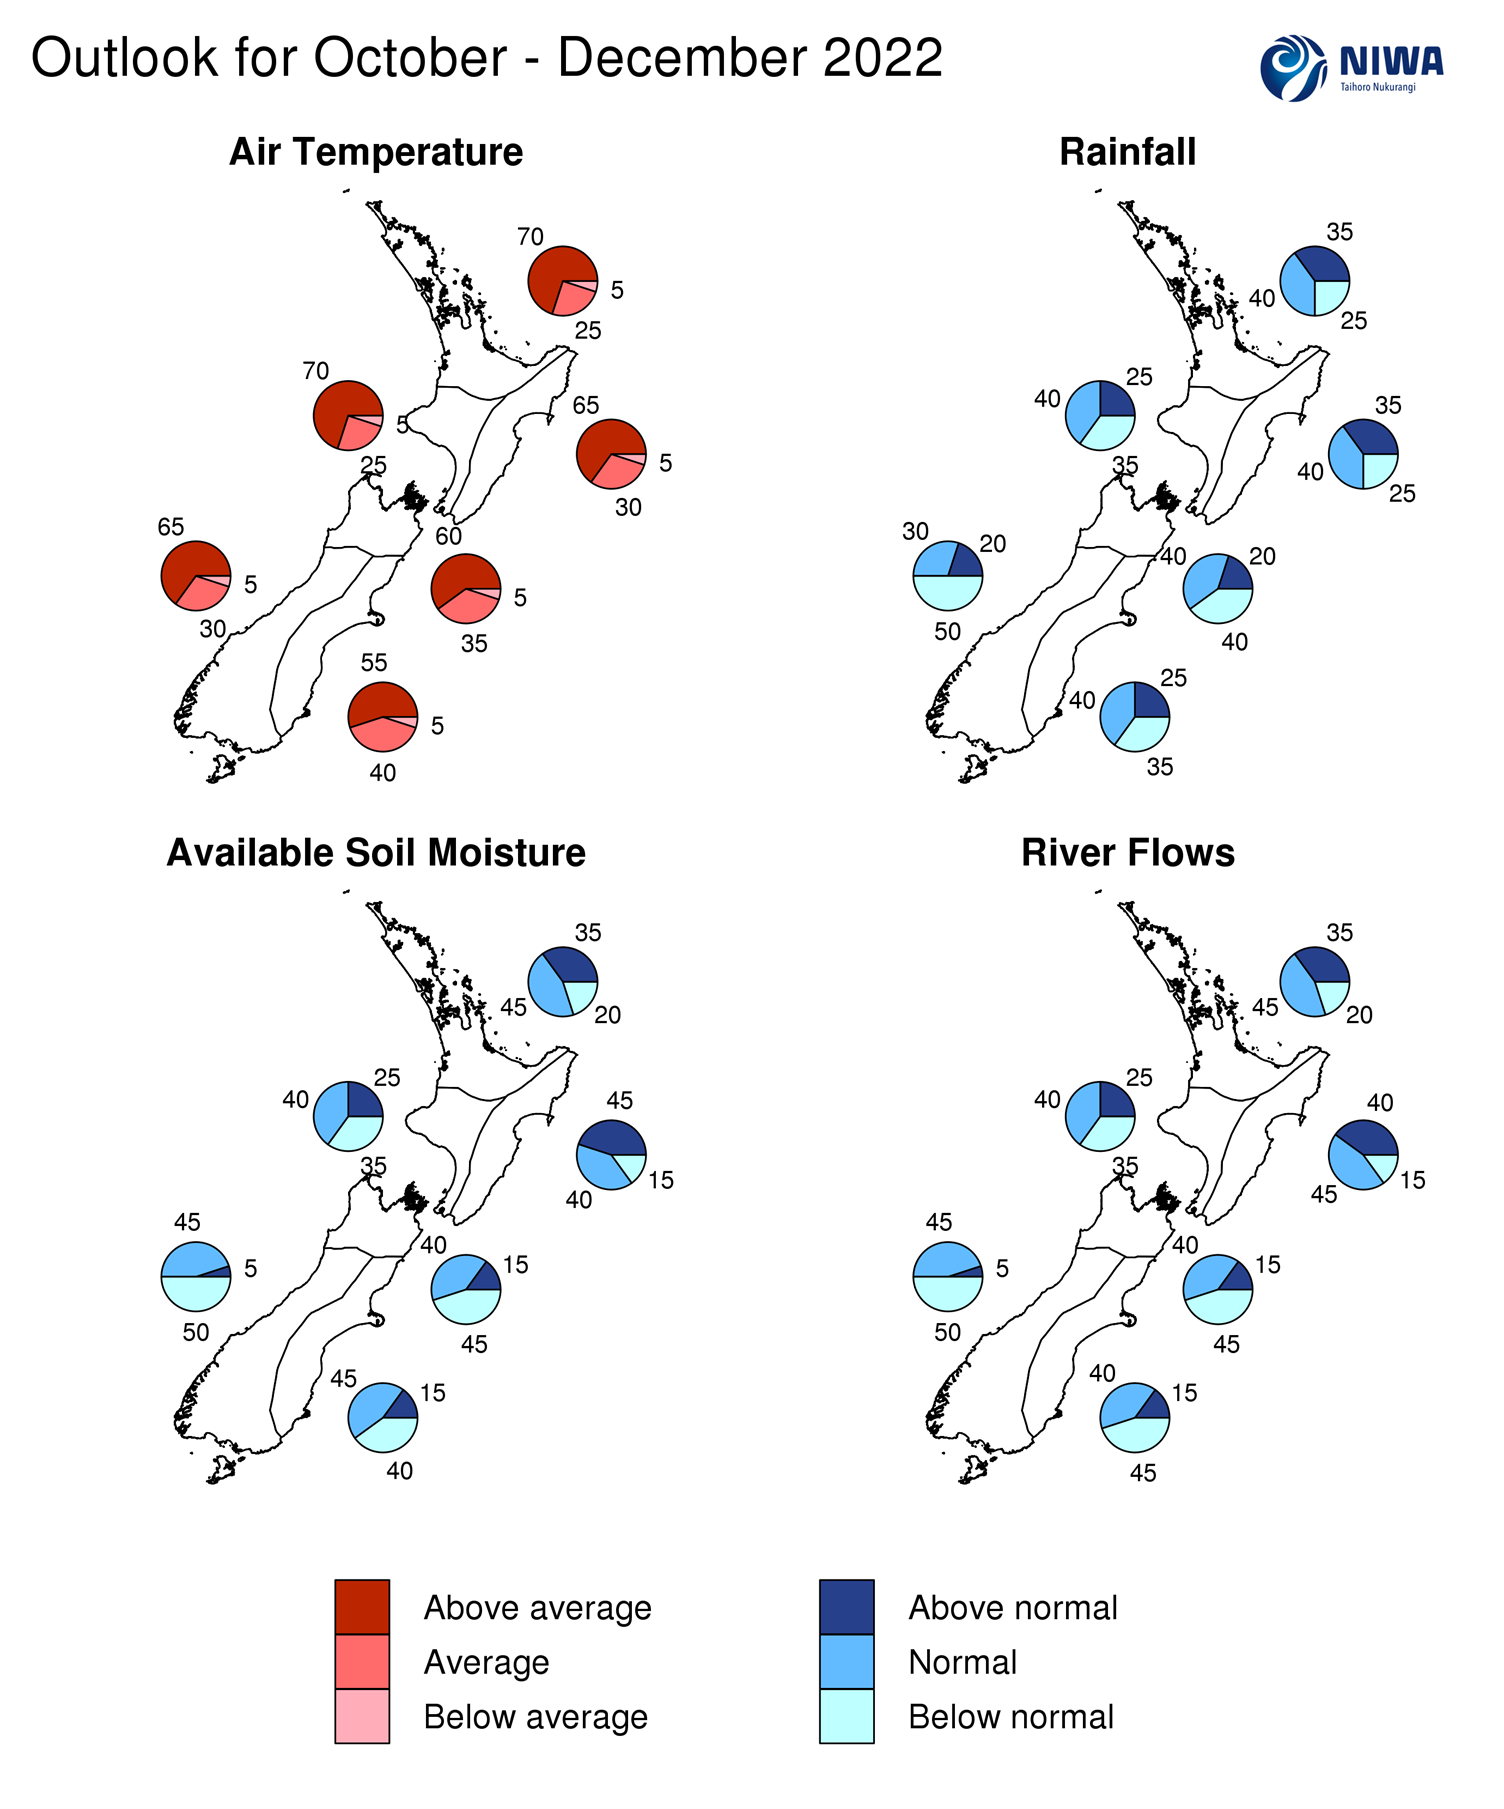
Graphical representation of the regional probabilities
Background
The NINO3.4 Index anomaly (in the central equatorial Pacific) over the last month (through 27 September) was -0.94˚C (climatology: 1991-2020), consistent with what was observed in August.
The provisional September monthly Southern Oscillation Index (SOI) was +1.8 and +1.4 from July-September (climatology: 1991-2020), both well within the La Niña range.
Trade winds were much stronger than normal across the central equatorial Pacific and off-equatorial South Pacific during September, maintaining a moderate La Niña strength.
In the subsurface central equatorial Pacific, cold anomalies intensified during September, particularly east of 160˚W longitude. The thermocline was located near the surface in the eastern part of the basin, consistent with La Niña conditions. Sub-surface anomalies of -3˚C to -5˚C are expected to continue to push toward the surface, likely resulting in further cooling of the NINO indices through November and additional strengthening of La Niña.
Therefore, La Niña conditions are very likely to continue during October-December (80-85% chance). During January-March, La Niña and ENSO neutral are about equally likely (45-50% chance). This will be the first “triple dip” La Niña (three consecutive La Niña events from 2020-2022) since 1998-2000.
A SST seesaw in the Indian Ocean, called the Indian Ocean Dipole (IOD), continued in its negative phase during September. The IOD has been associated with greater moisture availability for low pressure systems in the wider Australasia region, although central and southern parts of New Zealand were shielded by patterns of high pressure during September. A more southerly sub-tropical jet stream pattern may keep the northern and eastern North Island more exposed to moisture-laden low pressure systems in the months to come.
As the negative IOD eases from November-December, La Niña will become the main driver of seasonal climate variability in the tropics, with typical impacts for New Zealand including more easterly to northeasterly winds, warmer temperatures, lower rainfall about inland and western parts of both islands, and less frequent hot days in the east of both islands.
This may also be conducive to early season tropical cyclone activity in the Southwest Pacific. The occurrence or exact track of such systems is not possible to predict months in advance, however it only takes one tropical cyclone to change the complexion of a season. The Southwest Pacific tropical cyclone outlook will be released in October.
During July-September, convective forcing was dominated by the low frequency signal of the negative Indian Ocean Dipole and La Niña, superimposed with pulses of the Madden-Julian Oscillation (MJO). This was associated with anomalous rising air from the eastern tropical Indian Ocean into the Coral Sea. This is forecast to continue into October, with the convectively active phase of the MJO indicated in the Pacific during the middle part of the month. The odds for tropically-influenced rainfall during this time may increase, especially for the northern and eastern North Island but also potentially in the western South Island.
The Southern Annular Mode (SAM) spent much of September in its positive phase, in association with higher than normal air pressure in the New Zealand region and lower than normal pressure across Antarctica. This pattern is favoured to continue over the next season and is expected to cause an increase in the amount of time that the SAM spends in its positive phase.
New Zealand’s coastal water temperatures remained above average during September, with anomaly values increasing in 4 out of 6 climate regions (all but the west of the North Island and north of the South Island). The marine heatwave (MHW) signal was amplified in climate model guidance issued in September, showing a sharp increase in SSTs from October-December. Overall, it implies that MHW strength could rival that which was experienced in 2017-18 and 2021-22. Given the high-impact nature of recent summer marine heatwaves, the marine sector should monitor this situation closely. For more information, see the NIWA Sea Surface Temperature Update.
NZ 30-day coastal SST anomalies (to 27 September)
|
North NI |
+0.99˚C |
|
West NI |
+0.96˚C |
|
East NI |
+0.56˚C |
|
North SI |
+0.81˚C |
|
West SI |
+0.90˚C |
|
East SI |
+0.59˚C |
Forecast Confidence
Temperature
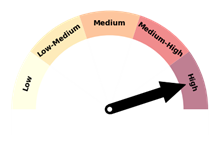
|
Forecast confidence for temperatures is high. Although September featured near average temperatures, warm coastal and regional seas, fewer southerly winds, more high pressure, and the influence of climate change is a recipe for warmer conditions. A vast majority of the climate models that NIWA surveys expect a warmer than average October-December. |
Rainfall
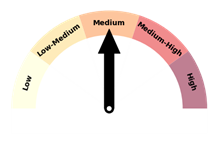
|
Forecast confidence for rainfall is medium. The existence of strong climate drivers like the Indian Ocean Dipole and La Niña is expected to enhance seasonal climate predictability. The climate models that NIWA surveys are in better agreement than normal with their expectations for seasonal rainfall. |