New Zealand’s warmest and wettest winter on record.
|
Temperature |
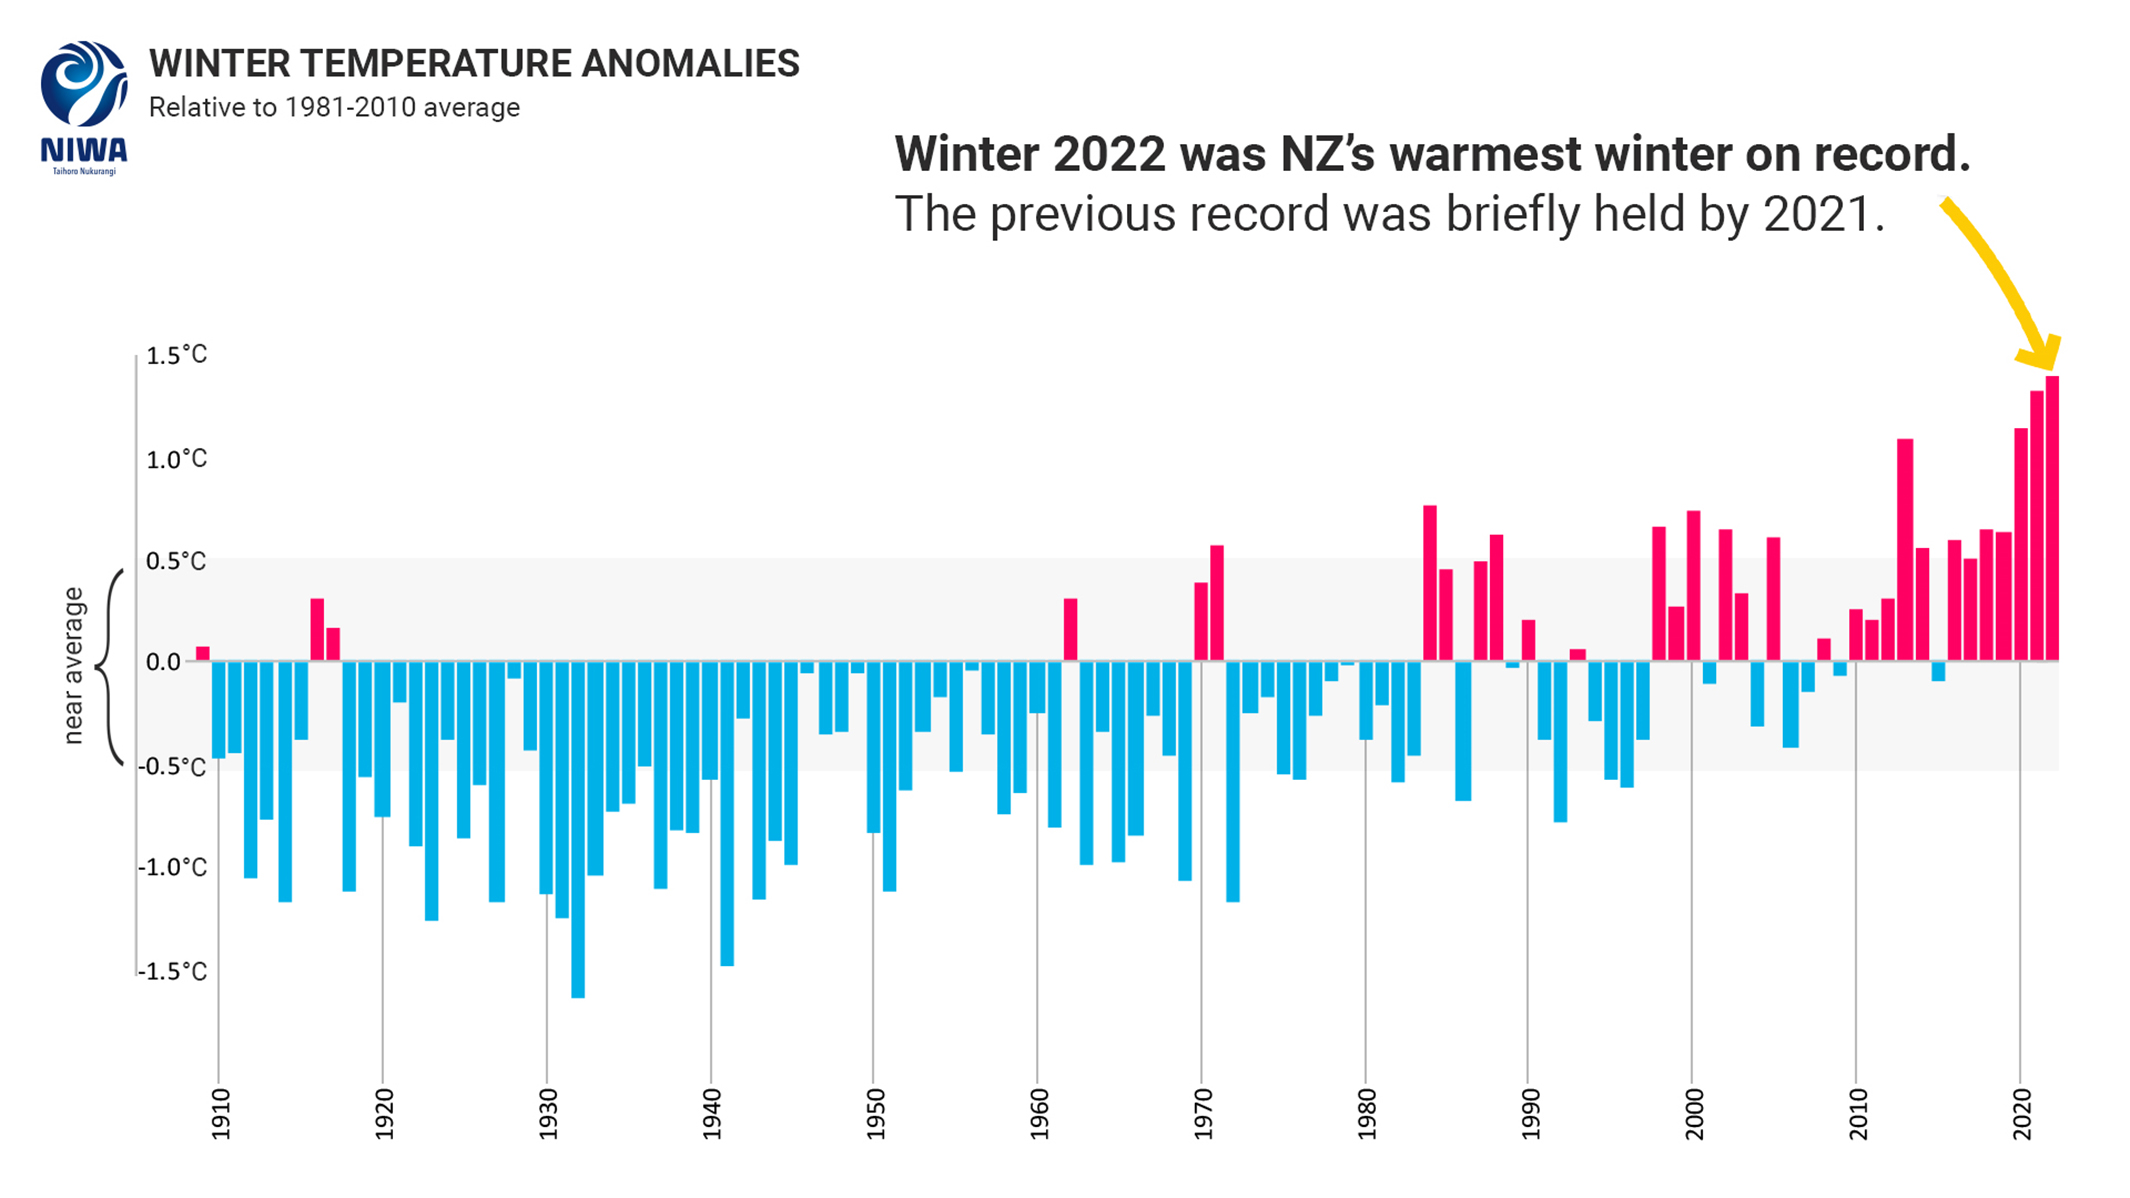
Winter 2022 was the warmest winter on record in Aotearoa New Zealand, surpassing winter 2021 that set the record just last year. Temperatures were well above average (>1.20°C above average) for the North Island as well as parts of the West Coast, Tasman, Nelson, Marlborough and Canterbury. Temperatures were generally above average (+0.51°C to +1.20°C of average) for the remainder of the of the South Island with small pockets of near average temperatures (±0.50°C of average) in Otago and Southland. No areas experienced below average temperatures. |
|
Rainfall |
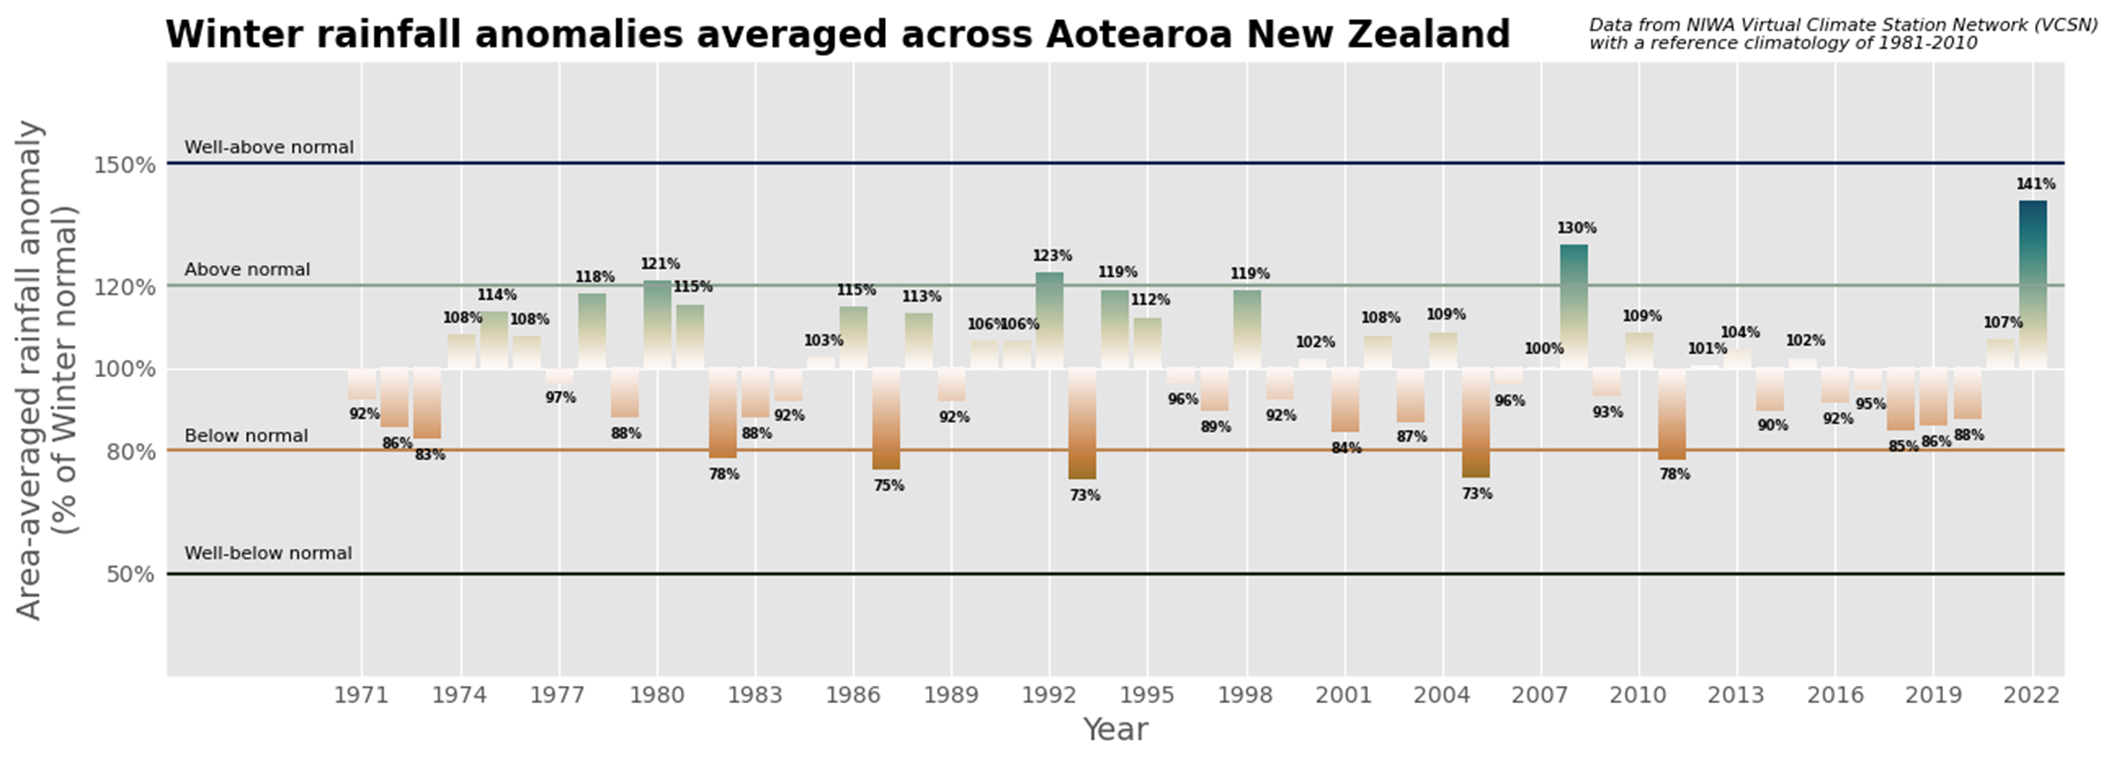
It was an exceptionally wet season with the vast majority of the country observing above normal (120-149% of normal) or well above normal (>149% of normal) rainfall. The wet winter was the result of multiple extreme weather events. The exceptions to the wet winter were parts of Waikato including the Coromandel, eastern parts of the North Island from East Cape to coastal Wairarapa, and southern Southland, where near normal rainfall (80-119% of normal) was observed. |
|
Soil moisture |
At the end of winter, soil moisture levels were near normal for a majority of the country. Above normal soil moisture was observed in eastern Marlborough, coastal South Canterbury, and interior Otago. |
Overview
Winter 2022 was the warmest winter on record in Aotearoa New Zealand. The nationwide average temperature was 9.8°C (1.4°C above the 1981-2010 average from NIWA’s seven-station temperature series which begins in 1909) which surpassed the previous winter record set just last year. Winter 2020 held the record prior to 2021 which means that New Zealand has now experienced three consecutive record-warm winters, each warmer than the year prior. The winters of 1970 and 1971 were the last time New Zealand had two consecutive record warm winters prior to 2020 and 2021, however, three consecutive record warm winters have never occurred. Winter 2022 was also the first winter on record where the temperature anomaly exceeded +1.2˚C for all three months of the season, relative to the 1981-2010 long-term average. Of the ten warmest winters on record, six have occurred since 2013. In line with the overall national record, 50 individual locations experienced record warm temperatures in winter 2022 and a further 33 locations experienced near-record warmth.
More information about the 7-series data.
Winter 2022 was also our wettest on record based on analysis of rainfall anomalies from NIWA’s Virtual Climate Station Network which extends back to 1971 (Figure 2). Additionally, 18 locations experienced their wettest winter on record and a further 24 locations had a near-record wet winter. The overall wet season was the culmination of numerous extreme rainfall events (see Highlights and extreme events section) which affected almost every part of the country at some point. Flooding and slips were common, particularly during July and August. One of the most damaging events occurred from 16-20 August when an atmospheric river of moisture extending from the tropics led State of Emergency declarations in Nelson, Tasman, the West Coast, and Marlborough. Nelson was affected by severe flooding as the Maitai River burst its banks. An analysis by NIWA indicated that the atmospheric river which led to this event was the strongest on record for August and second-strongest for winter since at least 1959.
The combination of warm and wet conditions led to variable snow conditions around the country. A prolonged period of low pressure during the second week of June delivered considerable snowfall to mountainous areas in the South Island, as well as to lower elevations. The timing was ideal for ski areas, with several opening for the season in mid-June. July also delivered several rounds of snow to the South Island, which resulted in above normal snow depths at NIWA’s high elevation snow and ice monitoring stations for the first two months of winter. Measurements at Mt Cook Village saw the deepest snowpack on record (since 2010) in mid-July, just prior to a large rain-on-snow event that caused avalanching and flooding throughout the region. After remaining well above normal most of winter, snow depths at all monitoring sites except Mt Larkins (1900m) and Muller Hut (1818m) dropped to well below normal in the second half of August due to warm, wet weather. Snow is currently absent from many sites on or to the west of the main divide (e.g., Castle Mount, Mt Philistine, and Ivory Glacier) and at lower elevations. In the North Island, the warmer and frequently humid conditions resulted in poor snow coverage for ski fields and limited opportunities to make snow.
Several factors contributed to New Zealand’s record warm and wet winter. The overall air pressure pattern saw higher than normal pressures to the east of the country and was associated with more northerly quarter air flows. This allowed for frequent low-pressure systems to approach from the northwest, transporting warmth and moisture from the tropics. The distinctive lack of southerlies during winter replaced by more warm and wet airmasses is characteristic of La Niña – a key driver of our climate for the third consecutive record warm winter. The influence of La Niña also contributed to the warmest winter sea surface temperatures in New Zealand’s coastal waters on record since at least 1982. Marine heatwave conditions occurred offshore of many regions and was ongoing for more than six months in the eastern Tasman Sea. The source region for several of New Zealand’s atmospheric river events, the Coral Sea, also experienced a marine heatwave. These warm waters not only contributed to warmer temperatures on land but also provided extra moisture to low pressure systems approaching the country. The extra warmth in the Southwest Pacific culminated in a sub-tropical jet stream whose average position was farther south than normal, more commonly passing over the North Island. Since jet stream behaviour is modulated by temperature gradients (change in temperature over distance), the excess warmth in the sub-tropics likely allowed the gradient to sit farther south than what is typical, thus the jet more commonly blowing over the New Zealand region and bringing active weather.
Another influential climate driver later in the season was the developing negative phase of the Indian Ocean Dipole, marked by warmer than average seas in the tropical eastern Indian Ocean near Sumatra and cooler seas in the west near Africa. This was yet another moisture source for New Zealand, with pipelines of water vapour streaming across Australia into the Tasman and Coral Seas at times. The excessively warm seas meant that another driver, the Madden-Julian Oscillation (a tropical pulse of rain and cloud), was commonly active across Australasia. This was a boon to many a northerly low pressure system that affected New Zealand. Finally, the Southern Annular Mode (SAM), a proxy for the location of the polar jet stream and storm track, was in its negative phase for much of June, with the 30-day running average becoming negative for the first time since early September 2021. The negative phase of the SAM tends to be associated with more active weather around New Zealand. July and August were marked by a variable SAM.
These various drivers occurred against the backdrop of a warmer atmosphere due to climate change which is strongly contributing to New Zealand’s temperature trend. Because a warmer atmosphere means water will be in its vapour state (which is fuel for rain), it is likely that the extreme rainfall events of winter 2022 were more intense because of climate change.
Further highlights for winter 2022:
- The highest temperature was 24.3°C, observed at Wairoa on 20 August.
- The lowest temperature was -11.6°C, observed at Aoraki/Mt Cook Airport on 17 July.
- The highest 1-day rainfall was 371 mm, recorded at Aoraki/Mt Cook Village on 18 July.
- The highest wind gust was 198 km/h, observed at Cape Turnagain on 9 July.
- Of the available, regularly reporting sunshine observation sites, the sunniest four regions in 2022 so far are Taranaki (1701 hours), Bay of Plenty (1675 hours), Greater Nelson (1621 hours) and Auckland (1564 hours).
- Of the six main centres in winter 2022, Auckland was the warmest, Tauranga was the sunniest, Christchurch was the coolest, Dunedin was the driest and Wellington was the wettest and least sunny.
Download
Winter climate summary 2022 [PDF1.6MB]