-
Coming from overseas?
If you're moving to join us here at NIWA, we want to say thanks for choosing us by helping you with your big move. -

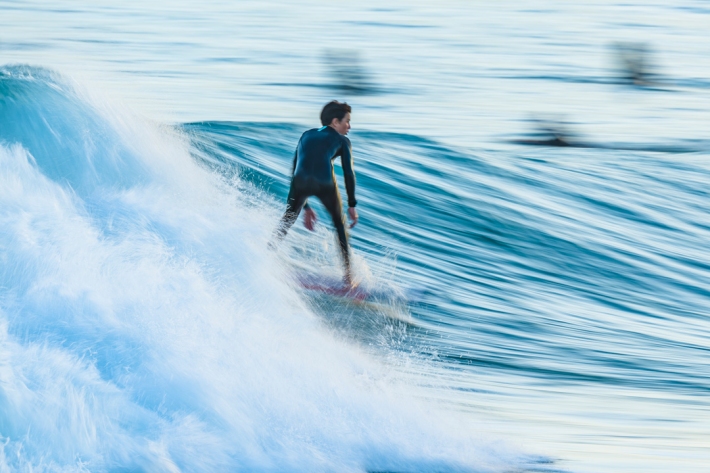
Wave action
Feature story06 June 2017New Zealand’s coast is sculpted by ocean waves. Some wave conditions bring joy to surfers and beachgoers, but, at other times, waves can cause major hazards at sea or along the shore. -
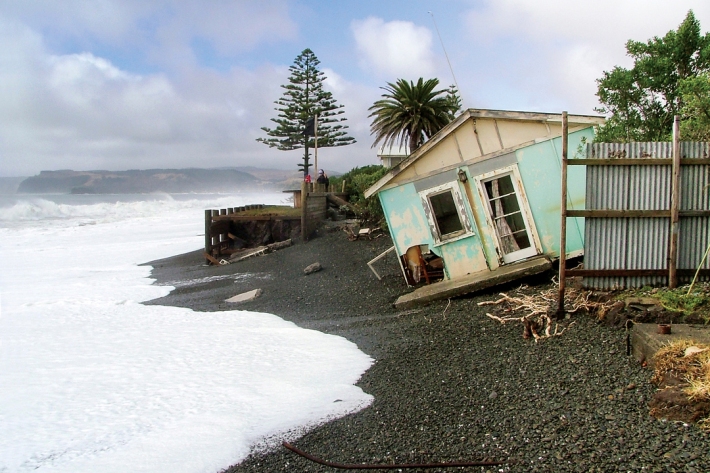
Sea-level rise
Education ResourceOne of the major consequences of climate change is rising global sea levels. -

Horticultural activities
Land is tilled, sowed, and harvested for horticultural crops to grow. -
How cold is the Antarctic?
Write a report, with guided questions, to answer the question: “How cold is the Antarctic?” -
Tuna aquaculture - New Zealand
New Zealand's first eel farm was established in 1971. Despite other farms opening in later years, no eel farms remained by the start of the 1980s. -
13 Beach types
Learn about different kinds of beachs and how they form, with diagrams and examples of each type. -
Tornadoes in New Zealand - FAQs
Education ResourceSome commonly-asked questions about tornadoes in New Zealand. -
Mussels: more, fresher, better
Feature story06 June 2017The seafood counter at your local supermarket has changed. -
Estimated bycatch
View data that show reported target catch and estimated bycatch. -
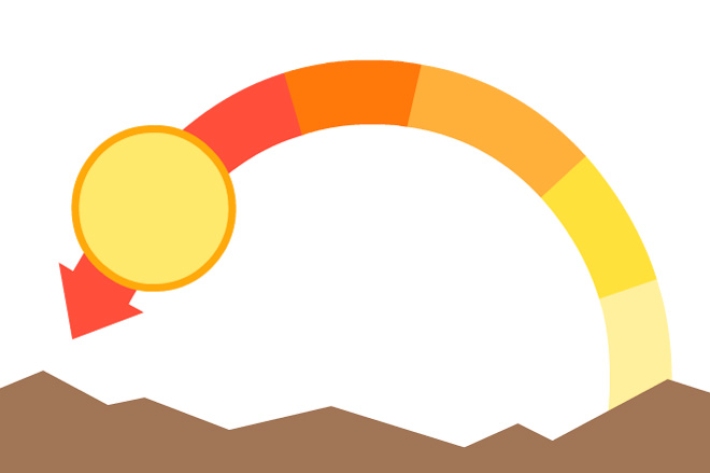
SolarView help
This calculator estimates the solar energy that can be collected by a solar capture device (solar panel) at a given address, panel direction and roof slope.