-
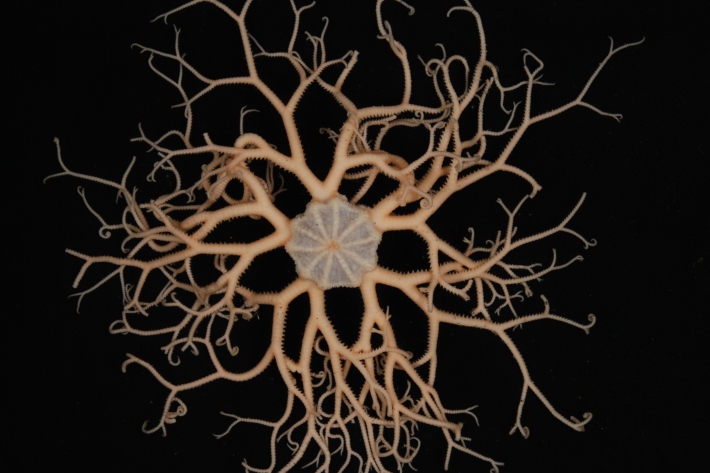
Critter of the Week: The Gorgon’s Head - Gorgonocephalus
A basket star was the first reported animal trawled up from the deep sea back in the early 1800s so they have a spot in the history books of deep ocean exploration. -
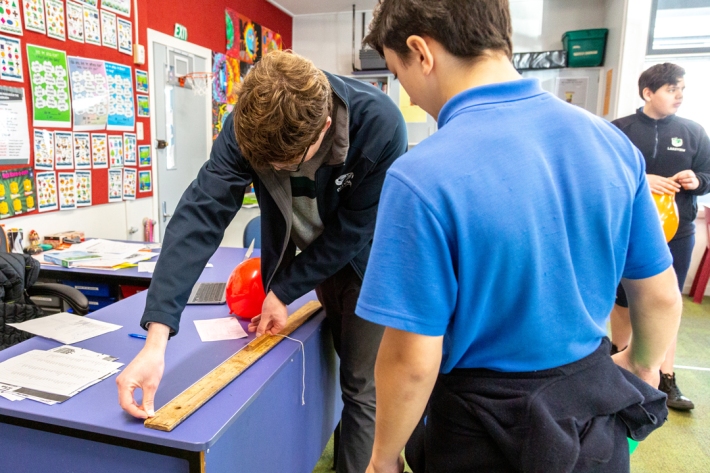
Resources for teachers
NIWA's educational resources and scientific data are tools for young people to learn about science. -

Freshwater fish species list
A list all of New Zealand's freshwater fish species. -
Sea level observations (near real-time)
ServiceThis system combines daily sea-level data from NIWA, regional councils, port companies, Antarctica NZ, Bureau of Meteorology and territorial authorities. -

Algal monitoring service
ServiceBlooms of hazardous cyanobacteria (blue-green algae) in rivers, lakes and reservoirs can cause problems for both animal and human health. -
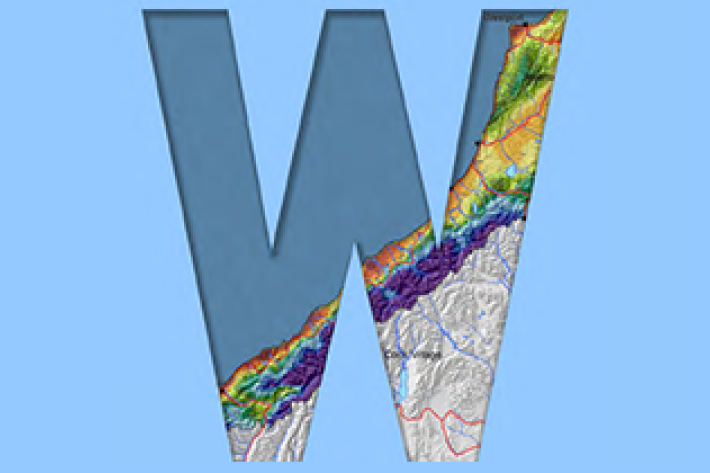
West Coast
West Coast is New Zealand’s wettest region, and this may be attributed to its exposure to the predominant westerly airflow over the country, combined with the orographic effect of the Southern Alps. -

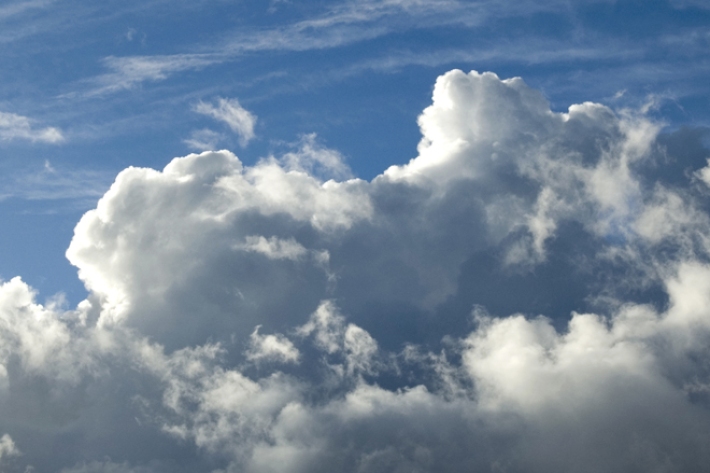
What is the greenhouse effect?
Education ResourceThe greenhouse effect is a warming of the earth's surface and lower atmosphere caused by substances which let the sun's energy through to the ground but impede the passage of energy from the earth back into space. -
Tuna - habitat
Tuna are found in all sorts of habitats (places), including coastal estuaries, lakes, wetlands, rivers, mountain streams and even alpine tarns. -
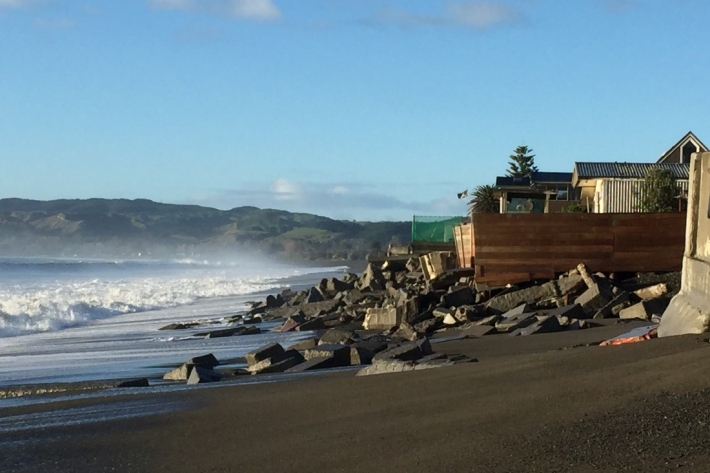
Canterbury Wave Conditions
Software Tool/ResourceNIWA run a computer model which simulates wave heights across the Canterbury continental shelf and along the coast. -
Publicly available data and publications
FacilityNIWA makes available and regularly updates results from several greenhouse gas measurement projects. -
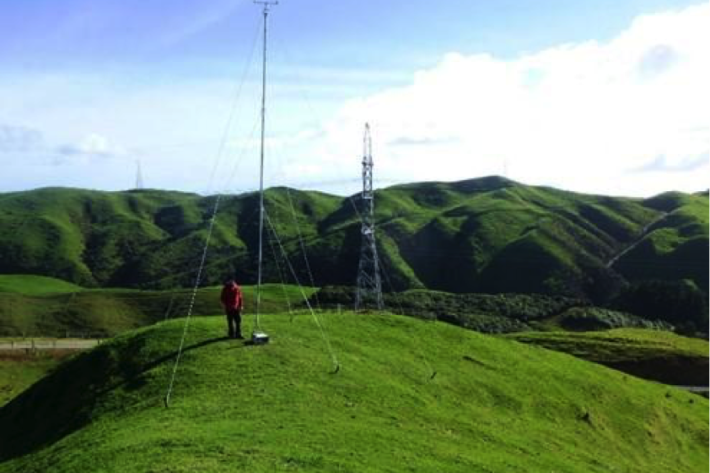
Estimating design wind speeds in complex terrain
Research ProjectThe current method for calculating wind speed-up is inadequate, and can grossly under-predict correct design wind speeds in NZ's complex terrain.