-

Sediment and mining
How can mining activities influence sediments in waterways? -
Climate change, global warming and greenhouse gases
Climate data and common terms explaining the causes and effects of climate change. -
Rain Gauge - OTA OSK15180T
This is the standard precision instrument NIWA uses throughout New Zealand in the National Climate Network, and elsewhere, for rainfall measurement. -
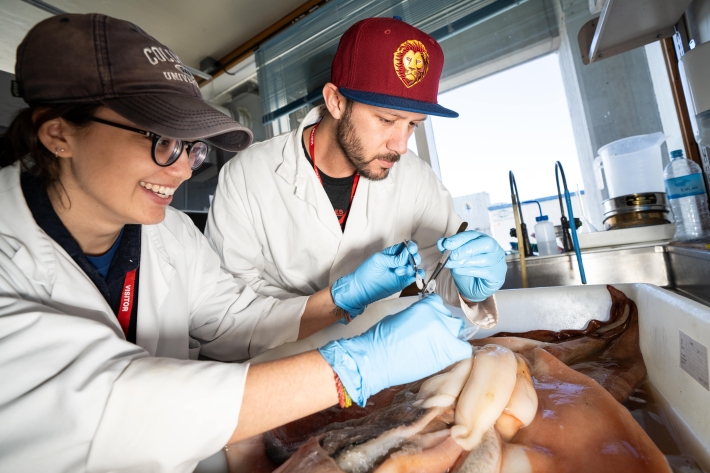
Trawl fisheries bycatch
Accurate reporting on the amount of fish and invertebrates that are caught and discarded by New Zealand’s commercial fishing industry is vital to effective management of these fisheries. -
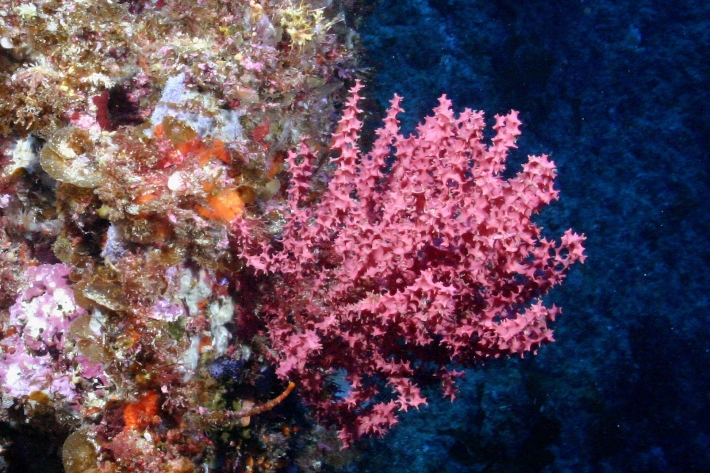
Identification guides
Useful information and resources on New Zealand's marine flora and invertebrate fauna. -
Scholarships
Scholarships available to both Masters and undergraduate students in the fields of fisheries science and marine biology. -
Giant kōkopu
The largest member of the Galaxiidae family. -
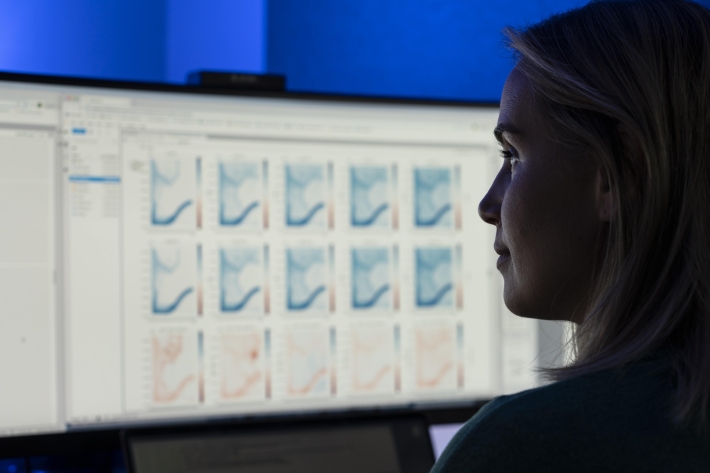
Daily climate maps
These climate maps are updated daily and are based on data from our National Climate Database. -
Modified habitat
A habitat is an environment or place where animals normally live. -
Climate summaries
Education ResourceIn this climate education resource, you can download this climate summary in a range of formats. -
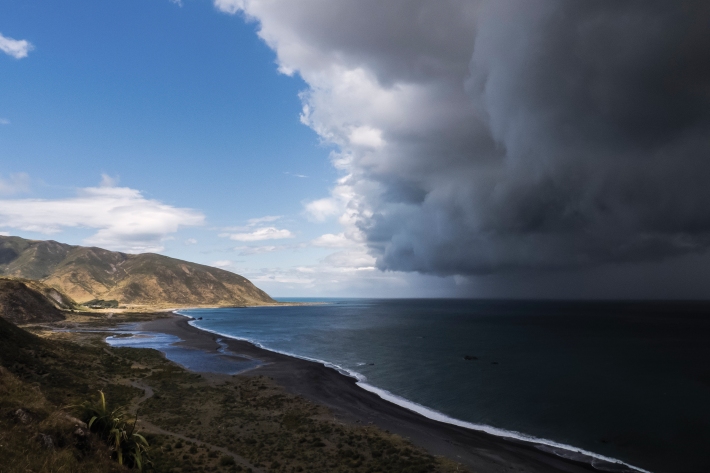
Map C North
Education ResourceAs this region is sheltered by high country to the south and east, it has less wind than many other parts of New Zealand.