-
Coming from overseas?
If you're moving to join us here at NIWA, we want to say thanks for choosing us by helping you with your big move. -
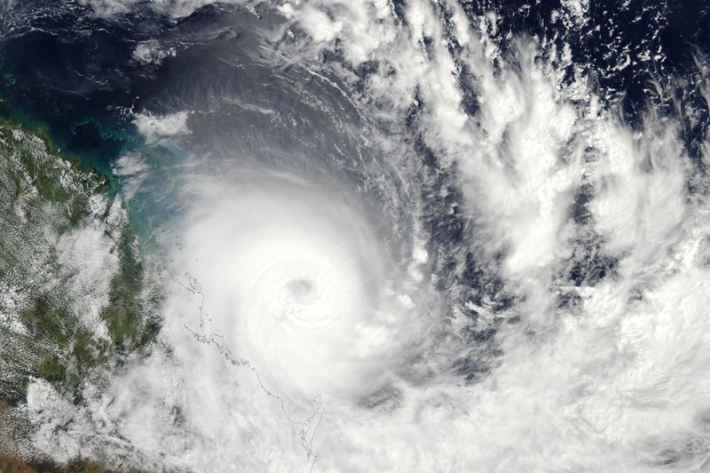
Storms and cyclones
Education ResourceCommon questions about storms and cyclones in New Zealand. -
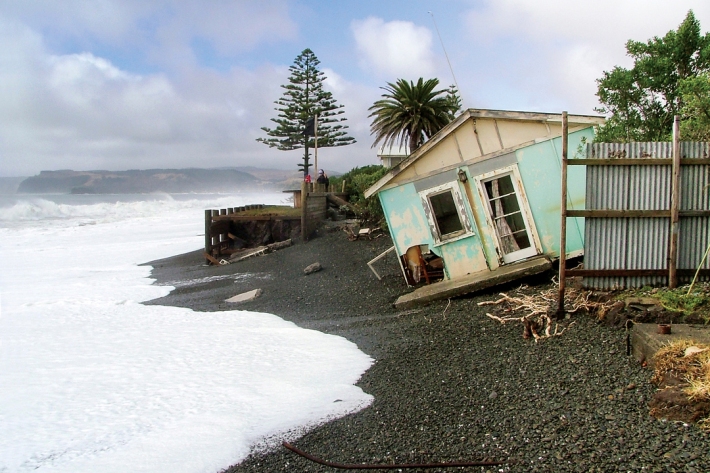
Sea-level rise
Education ResourceOne of the major consequences of climate change is rising global sea levels. -

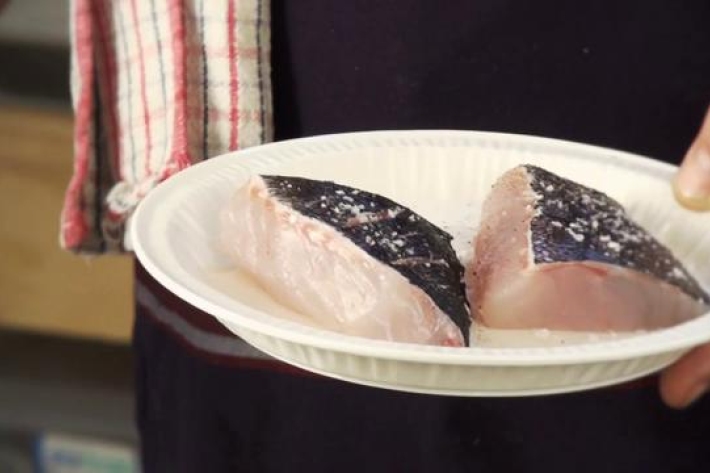
Tuna aquaculture - New Zealand
New Zealand's first eel farm was established in 1971. Despite other farms opening in later years, no eel farms remained by the start of the 1980s. -
13 Beach types
Learn about different kinds of beachs and how they form, with diagrams and examples of each type. -
Horticultural activities
Land is tilled, sowed, and harvested for horticultural crops to grow. -
Tornadoes in New Zealand - FAQs
Education ResourceSome commonly-asked questions about tornadoes in New Zealand. -
How cold is the Antarctic?
Write a report, with guided questions, to answer the question: “How cold is the Antarctic?” -
Estimated bycatch
View data that show reported target catch and estimated bycatch. -
Riparian vegetation and agriculture
How may agricultural activities impact riparian vegetation around a waterway?