-
Blogs
Follow NIWA's scientists as they explore the natural world, make new discoveries and share how people use their science. -
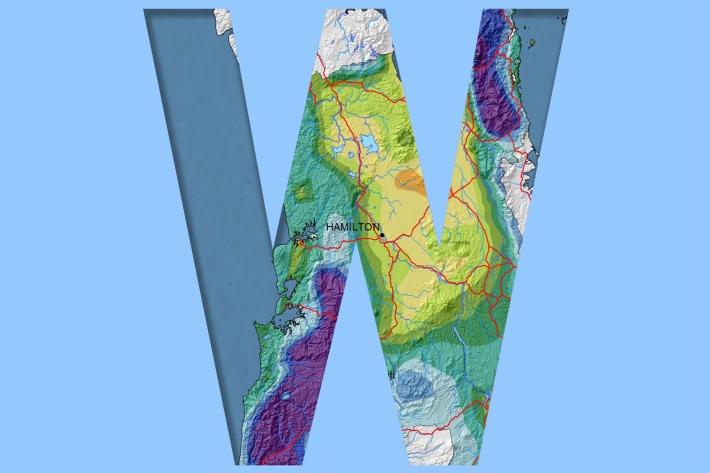
Waikato
Waikato exhibits a range of climates due to the variety of landscapes in the region. -

Causes of sedimentation
What are the potential sources of sediments from land use activities? -

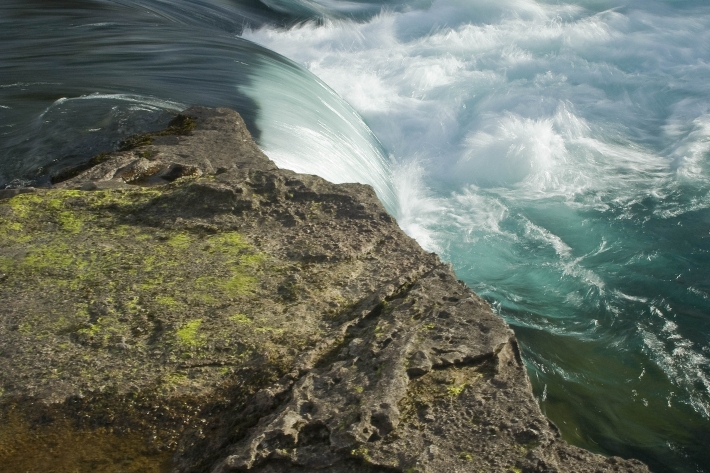
Wave action
Feature story06 June 2017New Zealand’s coast is sculpted by ocean waves. Some wave conditions bring joy to surfers and beachgoers, but, at other times, waves can cause major hazards at sea or along the shore. -
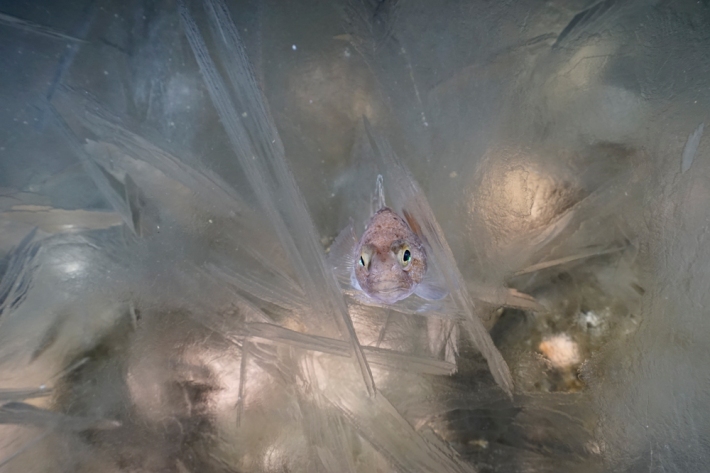
Tsunami
Education ResourceTsunami is a Japanese word meaning great wave in harbour. -
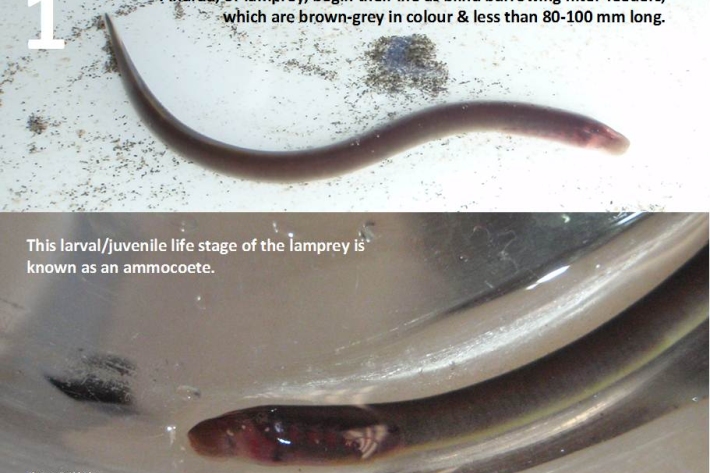
Restoration and enhancement of piharau / kanakana / lamprey
Research ProjectNIWA is leading a new six-year research project that seeks to increase our understanding of piharau/kanakana/lamprey, using Mātauranga Māori, social science and biophysical science approaches. -
Virtual Climate Station data and products
Virtual climate station estimates are produced every day, based on the spatial interpolation of actual data observations made at climate stations located around the country. -

RV Tangaroa
FacilityRV Tangaroa is New Zealand’s only ice strengthened and dynamically positioned deep-water research vessel.