-

Mean monthly temperatures (°C)
These datasets are available in a range of formats. -
Investigating ocean acidification
Feature story06 June 2017The world’s oceans are acidifying as a result of the carbon dioxide (CO2) generated by humanity. -
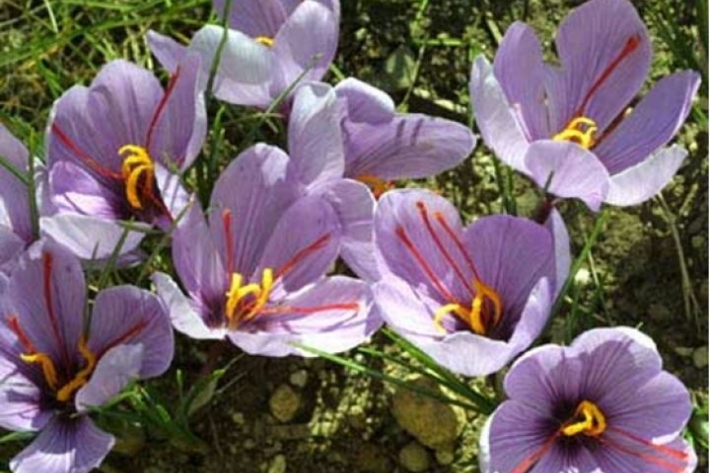
Assessment of crop and tree species growing potential using climate, soil and topographic information
Research ProjectThis project demonstrates how to assess high value alternative land-use options by means of a quantitative analysis of the growing potential of selected niche crops and tree species. -
Piharau
Piharau/kanakana are an important mahinga kai species and a prized delicacy for many Māori. -
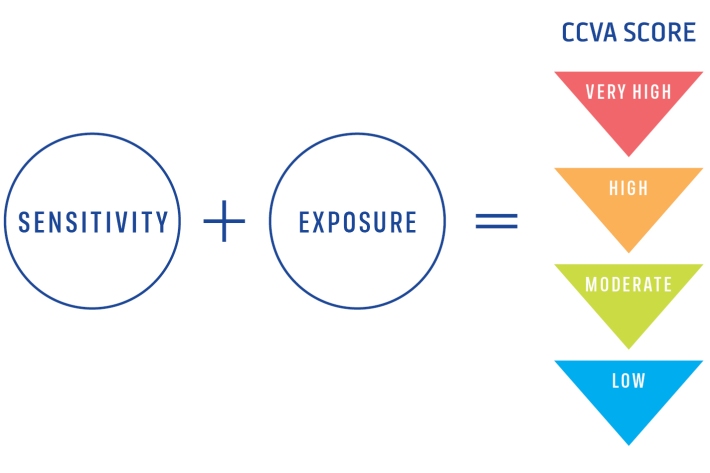
Climate Change Vulnerability Assessment (CCVA)
ServiceTo prepare for changes in climate, our freshwater and oceans decision-makers need information on species vulnerability to climate change. -
Map South
Education ResourceMost of this climate zone is characterised by cool coastal breezes, and absence of shelter from the unsettled weather that moves over the sea from the south and southwest. -
Tuna - commercial fisheries
Commercial eel fishery in New Zealand began in earnest in the 1960s and expanded rapidly until the early 1970s -
What do we measure?
Research ProjectA range of physical and chemical variables are measured in the NRWQN. -
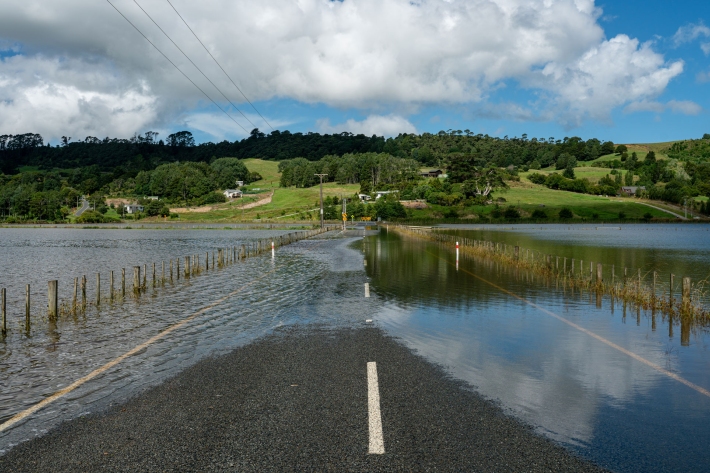
Flooding - how does it happen?
Education ResourceUnderstanding what happens above and below ground during a flooding event, and how it is different from normal rainfall conditions -

PARTneR (Pacific Risk Tool for Resilience)
Research ProjectUnderstanding how hazards impact people and the environment provides the foundation for informed decision making for a resilient Pacific.