New Zealand’s coast is sculpted by ocean waves. Some wave conditions bring joy to surfers and beachgoers, but, at other times, waves can cause major hazards at sea or along the shore. Veronika Meduna explores some of NIWA’s research into wave action and forecasting.
New Zealand lies amid formidable ocean forces. The furious winds of the Southern Ocean can whip up some of the world’s biggest waves, while storms travelling across from the tropics churn the sea. Waves carry energy across long distances and can cause many hazards, including dangers to shipping, land erosion and coastal flooding. To help coastal communities and local authorities to deal with such risks, NIWA has developed wave forecasting models that predict the size and direction of waves several days ahead.
The waves we see arriving at the coast were produced by the wind, often a long distance away, says Dr Richard Gorman, a keen sailor and wave modeller at NIWA in Hamilton.
Wave generation is essentially physics at work, he says. “As the wind blows across the sea, it transfers some of the energy to the water surface. The longer it blows and the stronger it is, the larger the waves.”
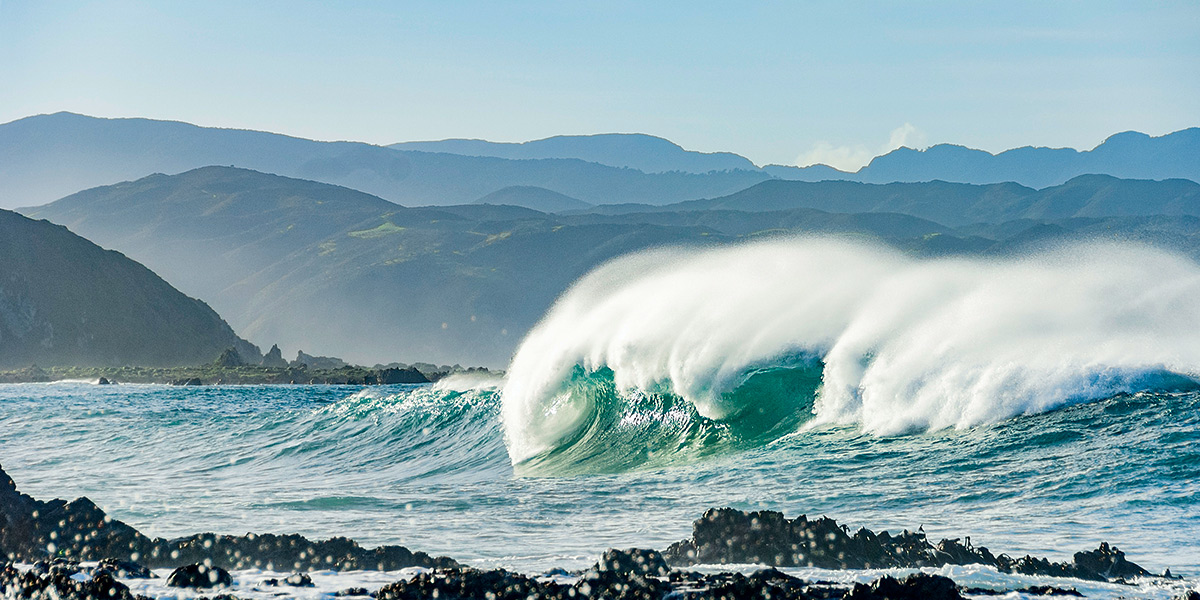
Stormy conditions generate a mess of steep waves of different sizes, all happening at the same time and resulting in what oceanographers call wind sea. Bigger waves travel faster than smaller ones, and the biggest will move ahead of the weather system that has generated them and eventually outrun it. As they propagate further away from their wind-driven source, sometimes across hundreds of kilometres, they settle into a particular height and period and arrive at the beach as a regularly-spaced, energetic swell—the best waves for surfing. However, when storm systems track closer to the coast, wave action can become a serious hazard.
Unlike weather forecasters, who have data from meteorological stations that have been in place for a century or more, wave forecasters have to work with much shorter records of observations collected from buoys and satellites. Mathematics helps to fill the gaps and models have been developed to hindcast—or simulate conditions back in time—in order to better forecast the waves.
Dr Gorman says the NIWA wave forecasting tool combines global weather models with wave models to make large-scale predictions about waves that can start their journey on the other side of the Pacific and travel across the ocean to reach New Zealand’s coastline.
The global models are divided into grid cells 17km apart, but are then scaled down to a smaller grid of 2km spacing to make regional predictions that look at what is happening closer to the coast. At an even smaller scale, other models simulate how particular wave patterns affect specific stretches of the coast, from sandy beaches to mudflats and estuaries.
Real-time wave observations
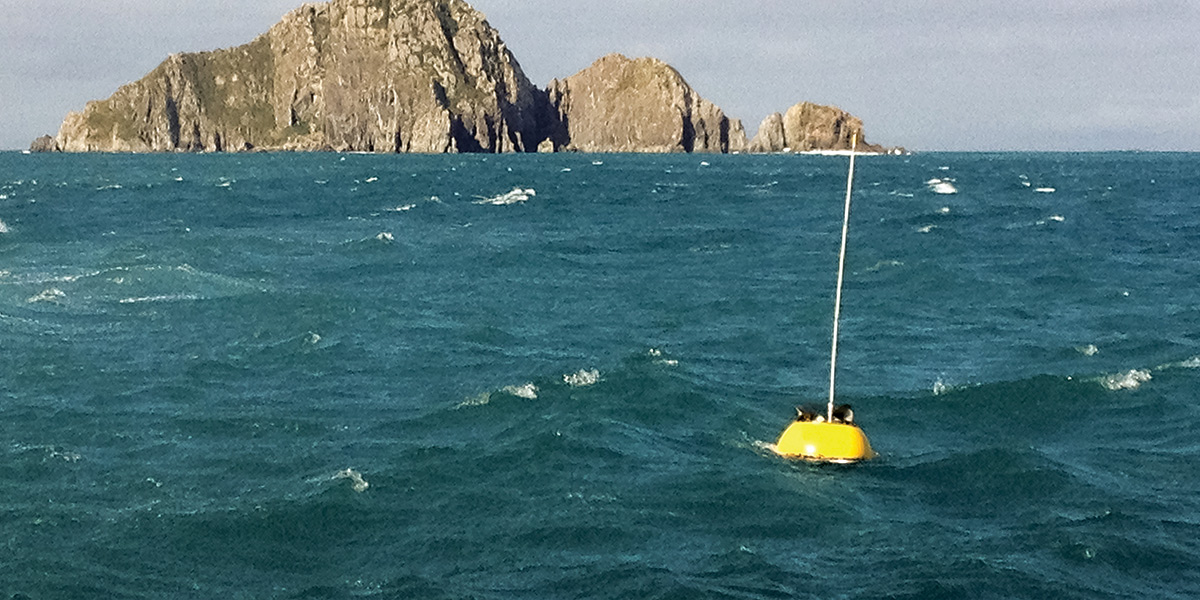
Like any other computer models, wave forecast models are verified and constantly refined through the input of real observations. These come from altimetry data from satellites and wave measurements from several buoys around New Zealand’s coastline. The buoys collect wave height data constantly and beam it back via radio signals or cell phones to a central network at NIWA.
Data from three buoys—off Banks Peninsula, at Baring Head near Wellington and at the eastern end of Tory Channel—are also made directly available to regional councils and port companies.
The wave forecast models are based on the physics that describe the energy transfer from wind to water and how that energy travels across the ocean, says Dr Scott Stephens, a coastal scientist at NIWA.
“They are driven by weather models because you need to be forecasting the weather systems that create the waves in the first place. But once you’ve got weather and wave models set up, you then need to check that the forecasts are actually giving the correct results. The things you can adjust include the amount of wave dissipation, the wave energy that’s lost as they travel, and wave buoys are used to verify that.”
The model simulations have identified different “wave climates” along the coast, he says.
The south and west coasts of both islands get the highest energy waves, driven by the predominant westerly flows. The energy grading is highest in the southern South Island and lessens further north.
On the northeast coast of New Zealand, from North Cape to East Cape, the landmass provides shelter from the Southern Ocean, and waves are driven by weather systems in the Tasman Sea and ex-tropical cyclones. “Generally waves are smaller there, but occasionally you can get big waves in cyclone conditions.”
And on the coast from Gisborne to Otago, waves usually arrive from the south and east. Although Cook Strait can experience wave conditions that are choppy enough to cancel ferry crossings, it is sheltered from large ocean swells and is more affected by local winds.
Predicting rip hazards
The energy of a wave is controlled by its height and its length. Its speed is governed by its wavelength in the open ocean, but in shallow water it is determined by the depth of the water column. The shallower the water the slower the wave can travel—which is why waves break on the beach.
“When a wave gets close to the coast, the front of the wave slows down and the back catches up to it,” says Dr Stephens. “The wave steepens, peaks up, eventually the back catches up with the front and the wave breaks.”
When waves hit the beach or shoreline, the interaction is complex. As waves begin to release their energy, they stir up sand in the water column. Once they break, their momentum drives a current, pushing water up on the beach or against the coastline.
As the water flows back, it can create rip channels. “All that water that’s been pushed up on the beach has to go somewhere and it tends to find the path of least resistance to flow back offshore.”
The returning flows scour out the seabed, creating deeper channels of fast-flowing currents that can carry swimmers far offshore. The two most important factors in predicting rip currents are the size of the waves and any pre-existing channels.
“Although wave energy is the number one control over the possibility of rips, if you are trying to forecast whether there will be rips today, it’s more likely if there were rips yesterday. When you’ve had large waves for some time, and when there’s already a channel at the beach, it is more likely that rips will occur,” Dr Stephens says.
With the help of wave height forecasts, NIWA has created a rip current index, which provides a six-day forecast for rip hazards.
Keeping an eye on the beach
A stretch of beach constantly adjusts to wave conditions. Small waves tend to push sand onshore and build up the beach, while big waves strip sand away from the beach face and move it offshore. Without sand dunes or a wide buffer of sand, large waves can run over coastal defences and erode or flood the land.
Beach width is one measure of beach health, says Dr Michael Allis, a coastal engineer at NIWA in Hamilton.
“When the beach is healthy and wide, it means there’s a reservoir of sand which can move offshore when the large storm waves arrive. The sand doesn’t disappear, it moves slowly offshore and forms another bar. This means that the waves aren’t going to reach quite as far inland and there’ll be less damage. After the storm passes, the smaller waves help to push sand back onto the beach again.”
To monitor what goes on, NIWA has set up Cam-Era, a network of computer-controlled cameras that collect a series of images every 30 minutes from some of the country’s most pristine and energetic beaches, including Ngarunui Beach at Raglan and Tairua Beach on the Coromandel Peninsula.
“By taking a lot of images of the coastline we can build an understanding of the natural beach conditions, and the changes to the beach in response to waves and tidal conditions. We measure beach width—defined as the distance between the dune crest and the high tide line—from a 10-minute series of 600 images that are averaged,” Dr Allis says.
Every pixel is averaged across all images and “you no longer see the individual waves arriving at the beach, but what you do see is where the shoreline was, on average through that 10-minute window. Using the offshore tidal and wave conditions to give the water elevation, you can then work out how wide the beach was for that time period”.
The Cam-Era system has been in place for almost two decades and it contributes to many research projects, including the prediction of rip currents and observations of how beach formations change over time.This vast amount of data is an invaluable tool for building or advancing models to predict future beach hazards and what the shoreline might do under different wave conditions in the future.
“We calibrate shoreline models based on the past record of beach measurements and wave conditions, and use these to improve our predictions of the future beach conditions,” Dr Allis says.
“We can better understand how the beach responds if we get a larger storm, a swing in wave direction, or with a rising sea level, and identify that we would expect a change to the amount of storm-cut beach erosion.”
Managing mud in estuaries
Wave action also contributes to the reshaping and degradation of many estuaries around New Zealand’s coast.
NIWA coastal scientist Andrew Swales has studied estuaries from Northland to Southland, with a focus on tracking how changes in land use and subsequent increases in soil erosion are affecting estuarine environments.
Using sediment cores to investigate rates of sedimentation in the past, “we’ve seen an order of magnitude increase in sediment accumulation rates during the European era”, he says.
“Typically, in New Zealand estuaries prior to human arrival, you’d have rates of less than 1mm per annum. Now, in northern estuaries, we see a range of 3mm to 5mm per annum, and in lots of places it can be tens of millimetres per annum”.
Increased sedimentation has led to a degradation of estuarine ecology. “It’s a double whammy. Increased soil erosion means we’re losing the productivity of the land, so it’s an economic loss, and we’re filling estuaries and smothering benthic fauna and reducing light. There are large-scale impacts on estuaries, changing from subtidal to intertidal, from sand to mud, to high turbidity and high sedimentation rates and losses of sensitive keystone species, such as seagrass.”
In northern estuaries, soil erosion and wave action have also helped the spread of mangrove forests. Mr Swales’ research has shown that mangroves are opportunists, moving into areas where increased sedimentation, coming in from catchments as plumes of silt, has been redistributed by tidal currents and wave resuspension onto intertidal flats. “That’s what mangroves need to colonise. They grow above the mean sea level, halfway between the low and high tide.”
Whether or not mangroves succeed in colonising a new area depends partly on the work of waves, he says. “Wave-driven erosion of the seabed controls the success of seedling recruitment in bigger estuaries. Waves exert an import control—for example, in the southern Firth of Thames, 700 hectares of mangrove forests have developed since the 1960s through probably four or five successful recruitment events, which have depended on climate and wind conditions that drive wave propagation.“
Predicting tidal currents
Of all the different ocean movements, tides are the most predictable. NIWA has developed a tidal model that covers New Zealand’s Exclusive Economic Zone and is being refined continually to include changes in sea level and climate.
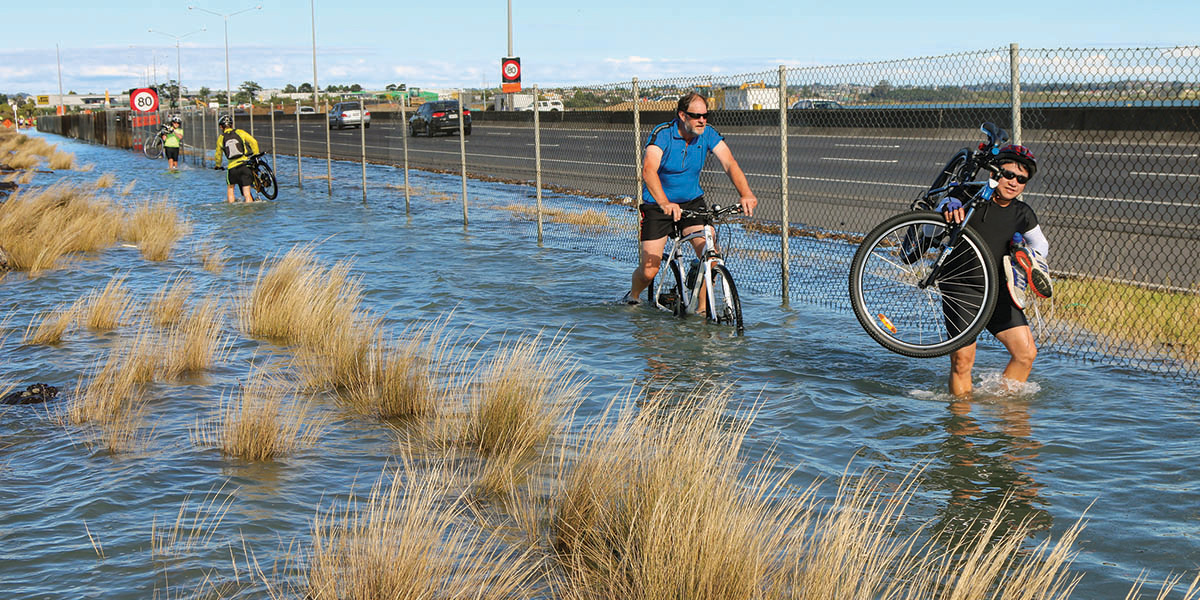
The model is used to predict red alert tide days—days that coastal hazard managers should put in their diaries and make sure they keep an eye on the weather and the sea. Red alert days mark king tides, which peak one or two days after a new or full moon when the moon is closest to the Earth. But dates for the highest tides vary around New Zealand, and their potential to cause coastal hazards depends on local weather and wave conditions. If such king tides collide with low-pressure weather systems, high waves and now also rising sea levels, they are likely to play havoc.
“It doesn’t take much to tip low-lying parts of the coast over”, says Dr Rob Bell, a coastal oceanographer also known as the “Duke of Hazard”.
“It only takes 30 to 40 centimetres of sea-level rise for a one-in-100-year event to become an annual affair. It’s an unfolding story of increasing frequency of such events.”
Field data from tidal and sea-level gauges and ocean-height satellite measurements are used to calibrate the tide model which is now also incorporating observations of climate variation. “The tide is the first base. With rising sea levels, everything else rides on the back of that, exacerbating all coastal hazards,” Dr Bell says.