-
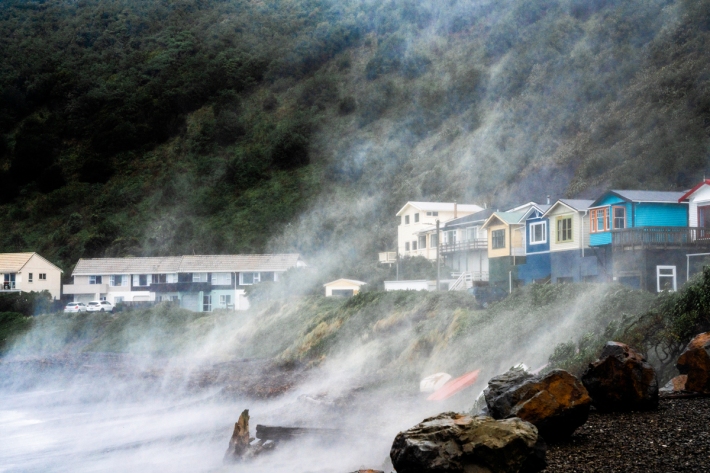
Coastal storm inundation
Education ResourceNew Zealand has low-lying coastal areas that are vulnerable to inundation (flooding) by the sea. -

Map Scott
Education ResourceScott Base, Antarctica Antarctica is the coldest, windiest and driest continent. -

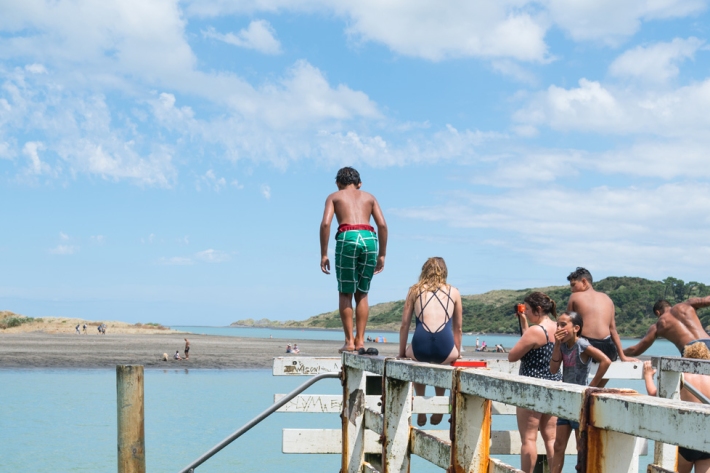
Urbanisation
Aotearoa’s main urban areas cover approximately 2% of total available land. -
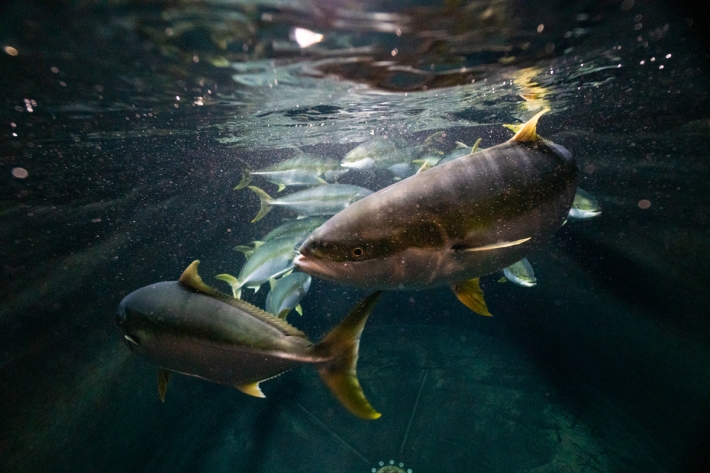
Tuna - spawning grounds
All species of freshwater tuna spawn at sea, although the spawning grounds of only four species are known with certainty worldwide. -
Education and information
Education ResourceExplore our education and information section to find out about climate and climate change, weather, our atmosphere, estuaries and more. -

Wood processing
Trees are grown and converted into a range of useful timber and paper products. -
Definitions of drought
There are several definitions of drought, depending upon whether it is viewed as a hazard or a risk. -
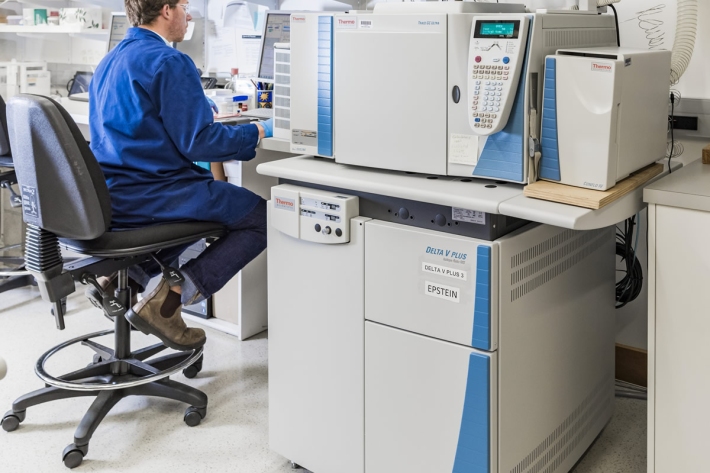
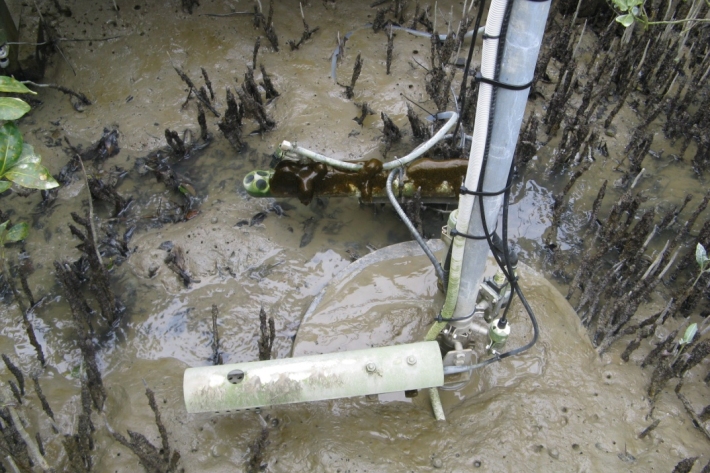
Compound Specific Isotope Analysis (CSIA)
Compound specific stable isotope analysis techniques are an increasingly useful tool to address many ecological and environmental research questions.