On 1 July 2025, NIWA merged with GNS Science to become Earth Sciences New Zealand.

Atmospheric analysis

NIWA has been using advanced scientific instruments to measure atmospheric trace gases and isotopes for over 50 years.

  • Instream barriers and altered water flow

    Instream barriers and diversions alter the natural flow of rivers, streams, and lakes.
  • Coconut palms against the night sky in Tongatapu

    Island Climate Update

    Publication series
    A monthly summary of the climate in the tropical South Pacific islands, with an outlook for the coming months.
  • (no image provided)

    Tuna - commercial fisheries

    Commercial eel fishery in New Zealand began in earnest in the 1960s and expanded rapidly until the early 1970s
  • Dry stock farming activities

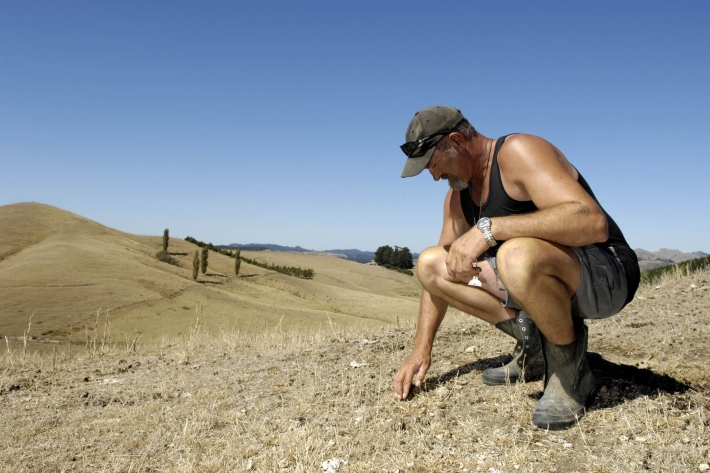
    Dry stock farms can cover large areas of hill-country grassland that may be steep and prone to erosion.
  • (no image provided)

    Graphing with Microsoft Excel

    How do I create a graph?
    Using Microsoft® Excel is easy because the Chart Wizard does all the work for you!
    Simply enter the data for your data table.
    Highlight the cells you want to graph.
    Click on the Chart Wizard icon on the Tool Bar.
    Select the chart type you want to use and click Next.
    Click Next to confirm the range of cells.
    Give your graph a title, label x- and y-axis and click Next.
    Click on the gridlines tab to remove or add gridlines.
    Click Finish and graph is complete!
    Help, my graph is too small!
    When the chart wizard creates your graph it will probably be too smal
  • Flood waters receding after days of heavy rain across the area.

    Flooding - how does it happen?

    Education Resource
    Understanding what happens above and below ground during a flooding event, and how it is different from normal rainfall conditions
  • PARTneR (Pacific Risk Tool for Resilience)

    Research Project
    Understanding how hazards impact people and the environment provides the foundation for informed decision making for a resilient Pacific.
  • UV index signage at Lauder

    UV Index Information

    Education Resource
    The UV Index is a measure of the intensity of UV radiation. The UV Index supersedes the idea of "Time to Burn" or "Burn Time", which has been used previously in New Zealand.
  • (no image provided)

    Suspended-sediment yield estimator

    This national GIS ‘layer’ enables reconnaissance-scale estimation of suspended-sediment yields from New Zealand’s rivers and streams. It has been developed by NIWA in collaboration with Landcare Research.
  • (no image provided)

    What ails our estuaries - problems and solutions

    Estuaries are at the bottom of the freshwater drainage network and, effectively, are a part of it.
  • (no image provided)

    Kōura

    There are two species of kōura or freshwater crayfish in Aotearoa.
  • (no image provided)

    Infectious substances

    Waterways can easily become contaminated by pathogens when effluent is discharged nearby.