-

Kōura
There are two species of kōura or freshwater crayfish in Aotearoa. -
Infectious substances
Waterways can easily become contaminated by pathogens when effluent is discharged nearby. -
Statement of Core Purpose
The Statement of Core Purpose spells out why the Government owns Crown Research Institutes and what it expects from them. -
Map N South
Education ResourceAs much of this climate zone is sheltered by high country to the west, south and in some areas to the east, it is the sunniest region of New Zealand. -

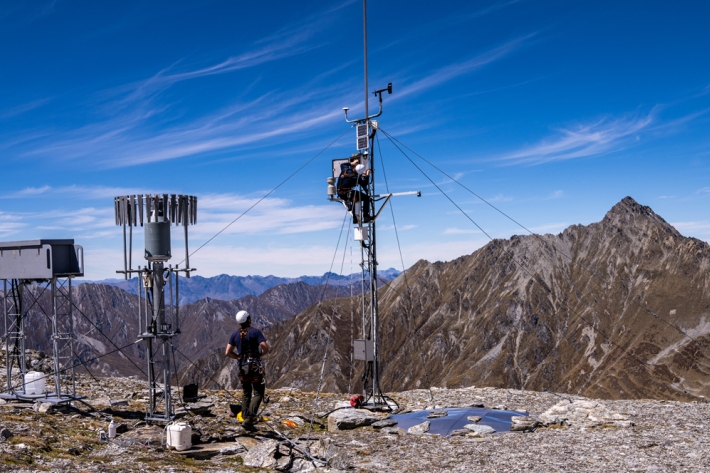
Wave hazard research
Research ProjectNIWA collects wave data, develops and verifies wave forecasting systems, and is developing and producing wave projections. -
Statement of Corporate Intent
This Statement of Corporate Intent (SCI) sets out NIWA's strategy for delivering against its core purpose over the next five years. -
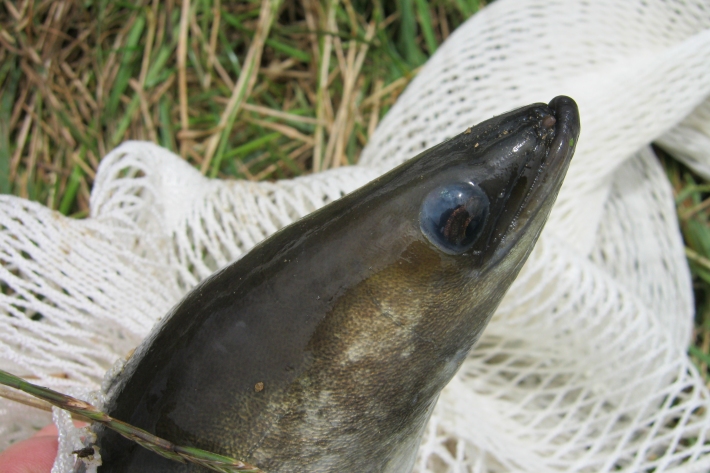
Tuna information resource
Tuna, or freshwater eels, are the most widespread freshwater fish in New Zealand. This 'living' educational resource summarises a large amount of scientific and technical literature. -
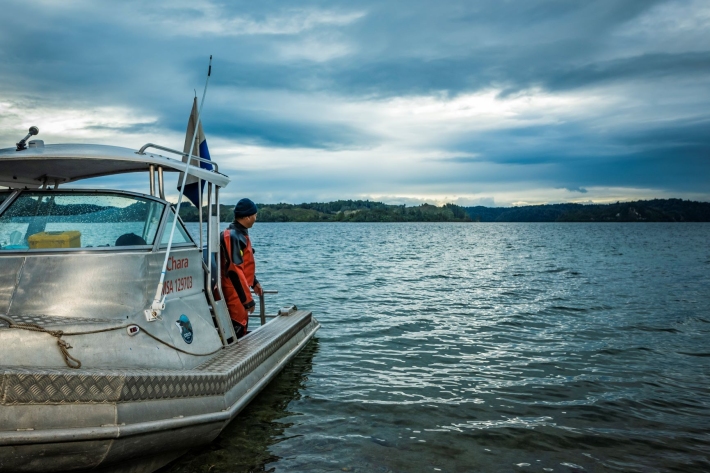
Other vessels
FacilityNIWA operates about 30 other Maritime New Zealand-certified vessels based at Bream Bay, Auckland, Hamilton, Rotorua, Turangi, Wellington, Nelson, Greymouth, Tekapo, Christchurch, and Dunedin. -
Coming from overseas?
If you're moving to join us here at NIWA, we want to say thanks for choosing us by helping you with your big move. -
Water temperature and hydro
How do hydro-electricity activities potentially influence waterway temperatures?