-

New map reveals New Zealand’s seafloor in stunning detail
News article06 June 2017 -
Mitigation and best practice options
Here are some simple steps to minimise the effects of dairying on water quality and mahinga kai. -
Urbanisation activities
Urbanisation has changed the face of many waterways that flow through urban areas -
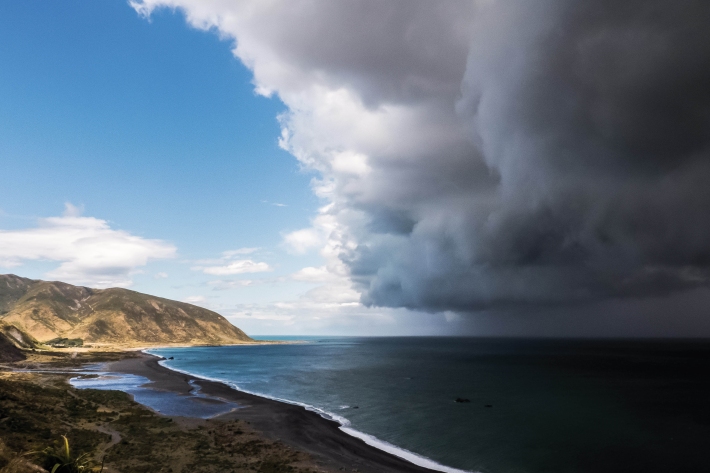
Floods
Education ResourceRiver floods occur when water spills from a river channel onto land that is normally dry, and are one of New Zealand's costliest natural hazards. -
Common climate and weather terms
Education ResourceA glossary of common climate change and meteorological terms. -
Water Level Instruments
There are different types of instrument available for measuring water level. -
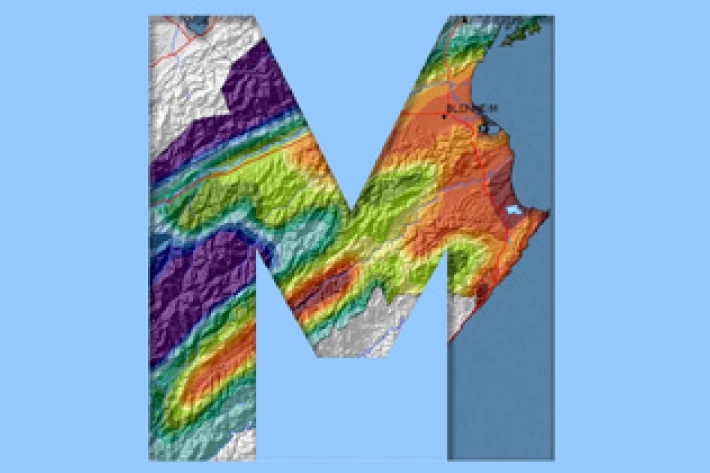
Marlborough
The main characteristic of the Marlborough climate is its dryness. Summer droughts are frequent, and the region is often swept by warm, dry northwesterlies. -
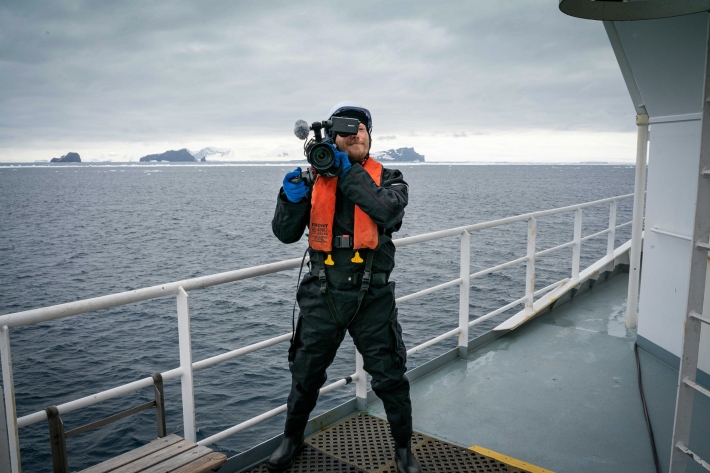
Scientists set to delve into the secrets of the Cook Strait mega-canyon
News article06 June 2017 -
Water Quality Monitoring Capabilities
Research ProjectNIWA provides national capabilities in Water Quality Monitoring. -
Tuna - life cycle and leptocephalii
Freshwater eels have an unusual life cycle which sees them travelling between the ocean, estuaries and freshwaters. -
Support
We have a range of exciting career pathways with our professional Support Service.