-
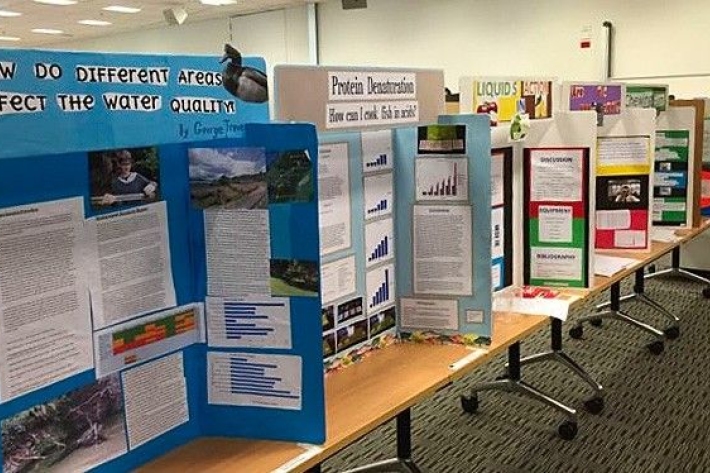
Science and Technology Fairs
NIWA is a major sponsor of the Auckland, Manukau City, North Harbour, Waikato, Wellington, Canterbury and Bay of Plenty – Science & Technology Fairs. -

Weather plots: temperature and relative humidity
Objective: to observe the relationship between temperature and relative humidity. -
Tuna - glass eels
Glass eels (about 5.5 to 7.0 cm) arrive in fresh water during spring, especially during September and October, although they may be present from July to December. -
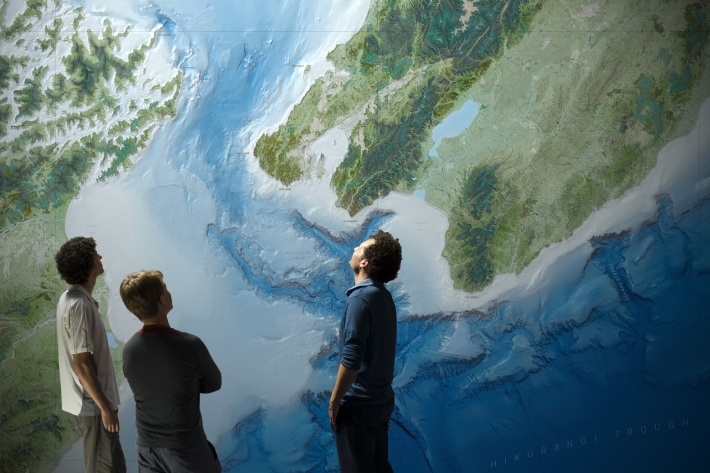
Charts
Publication seriesCharts of coastal bathymetry, sediment, and other information are available for purchase. -
Hotspot Watch Updates
This weekly update helps assess likelihood of extremely dry weather preceding a drought. -
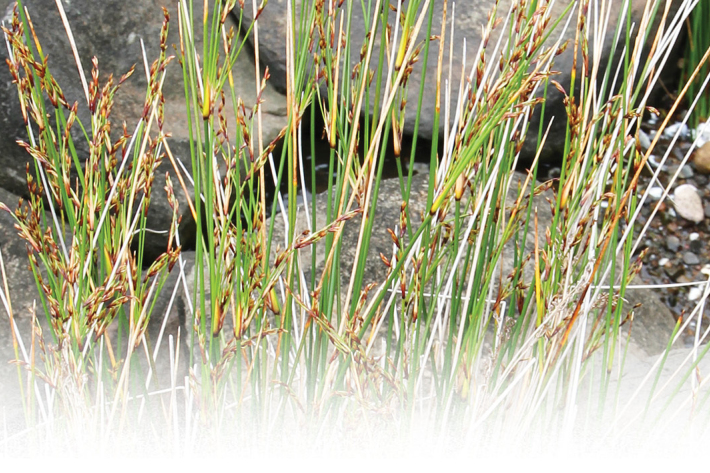
New Zealand rushes (Juncus): factsheets and key
New Zealand rushes (Juncus): species-level factsheets. -
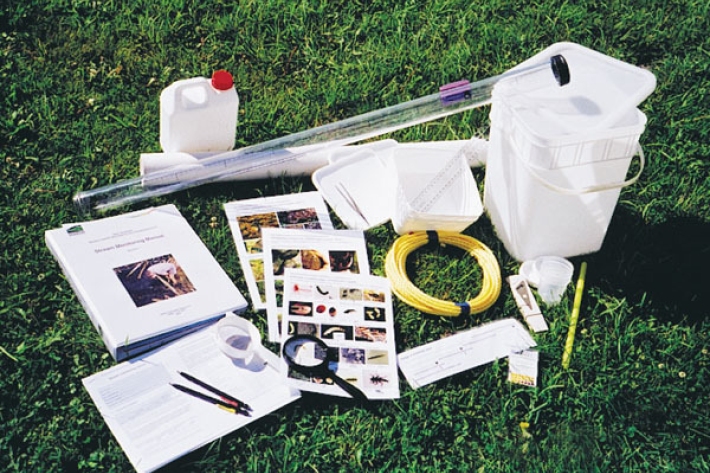
Stream Health Monitoring and Assessment Kit
ServiceHow healthy is your stream? SHMAK - the New Zealand Stream Health Monitoring and Assessment Kit - has been designed to help you find out. -
Toitoi
One of the most common species of freshwater fish in Aotearoa is the common bully or toitoi. -
Impacts of water dams
What are the impacts of water dams on water quality and mahinga kai? -

Multibeam swath system
Hull-mounted on the RV Tangaroa, the EM302 multibeam echosounder maps the seafloor using a fan of 288 acoustic beams, producing up to 864 soundings per ping in dual swath mode, providing 100% coverage of the seabed. -

Chemical contamination and wood processing
What are the sources of chemical contamination from wood processing?