-

Forestry activities
Forest plantations in Aotearoa can be found on flat, gently rolling, or very steep terrain. -
13 Beach types
Learn about different kinds of beachs and how they form, with diagrams and examples of each type. -
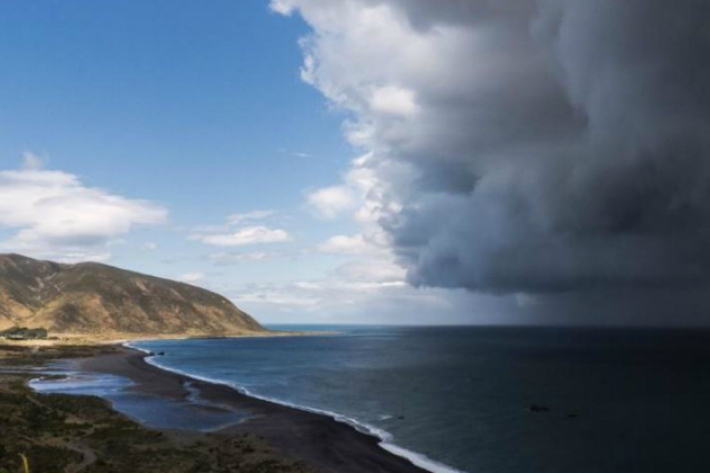
Tornadoes in New Zealand - FAQs
Education ResourceSome commonly-asked questions about tornadoes in New Zealand. -
Estimated bycatch
View data that show reported target catch and estimated bycatch. -
Climate mapping
Read about how NIWA can map any aspect of climate to help guide your organisation's response to a changing and variable climate. -
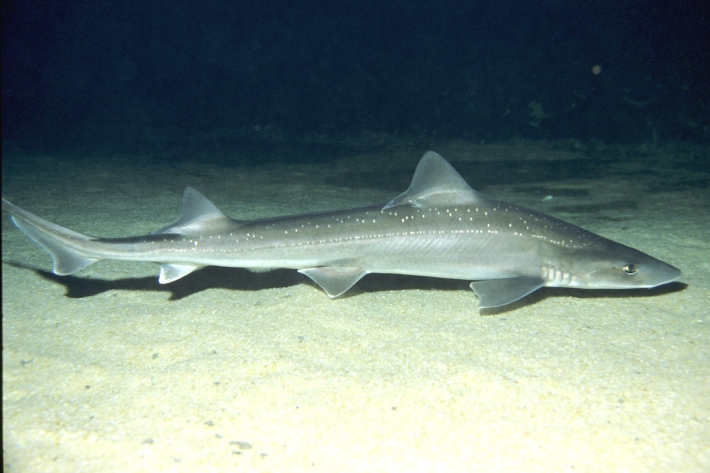
Rig shark
Research ProjectRig shark is an important inshore commercial fish species in New Zealand, and we need to understand more about their habitats, movements, nursery grounds and vulnerability to human impacts to ensure they are managed sustainably and their productivity is enhanced. -
What are greenhouse gases?
Greenhouse gases are atmospheric gases that intercept long-wave (mainly infrared) radiation emitted from the Earth's surface. -
Mitigation and best practice options
Some simple steps to minimise the effects of mining activities on water quality and mahinga kai. -
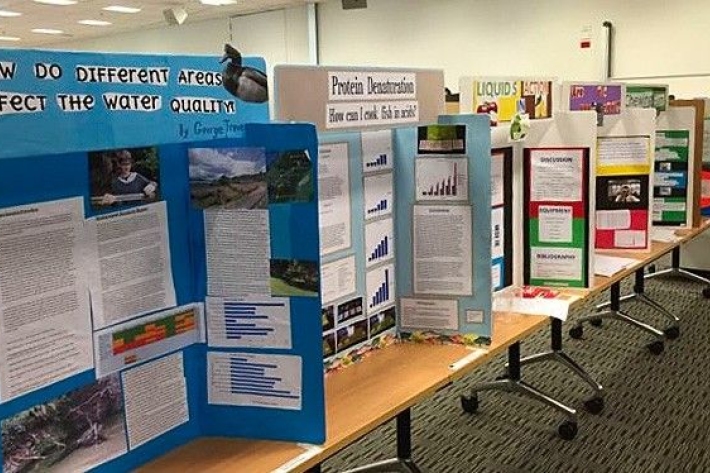
Science and Technology Fairs
NIWA is a major sponsor of the Auckland, Manukau City, North Harbour, Waikato, Wellington, Canterbury and Bay of Plenty – Science & Technology Fairs. -
Weather plots: temperature and relative humidity
Objective: to observe the relationship between temperature and relative humidity. -
The impact of El Niño and La Niña on New Zealand's climate
El Niño accounts for less than 25 percent of the year-to year variance in seasonal rainfall and temperature at most locations in New Zealand. -
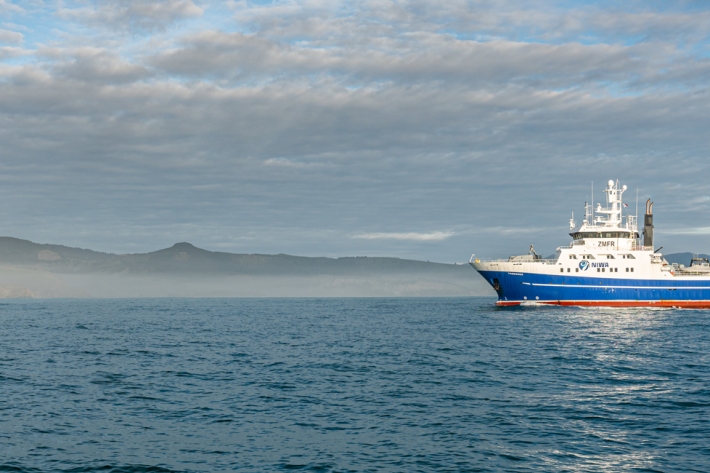
Applying for vessel time
Find out how you can have access to Earth Science NZ's research vessels to carry out marine research voyages.