-
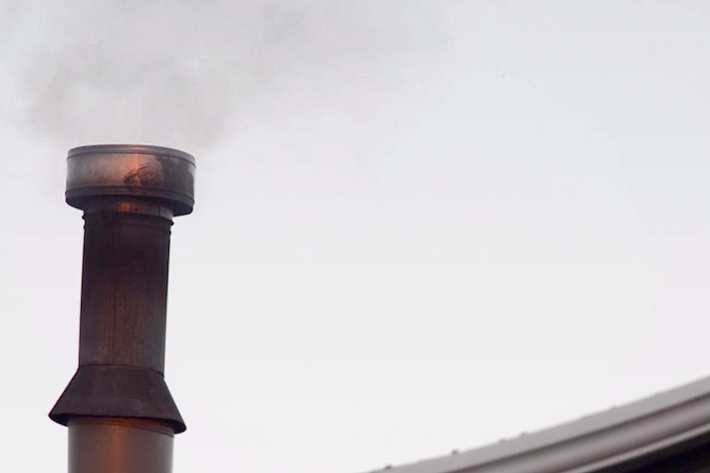
Climate change will cause more deaths from air pollution, study finds
Media release01 August 2017New research estimates that if climate change goes unchecked 60,000 more people will die globally from air pollution in 2030 – just 13 years away. -
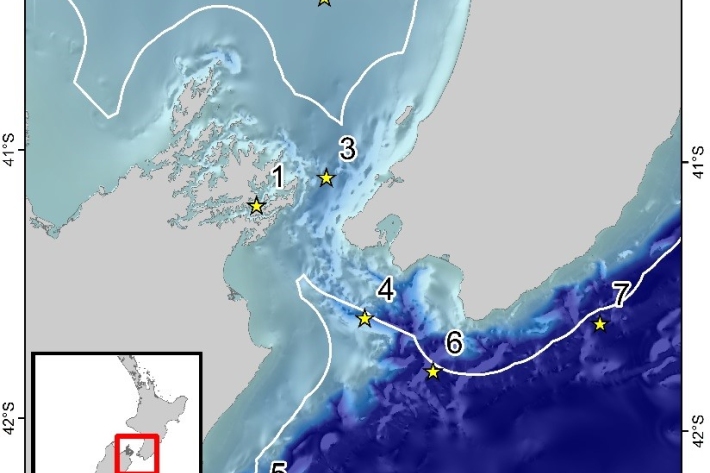
Acoustic Monitoring of whales and dolphins in New Zealand’s Cook Strait region
Research ProjectThe sounds of whales and dolphins rarely seen in New Zealand waters have been recorded in a pioneering underwater sound project. -
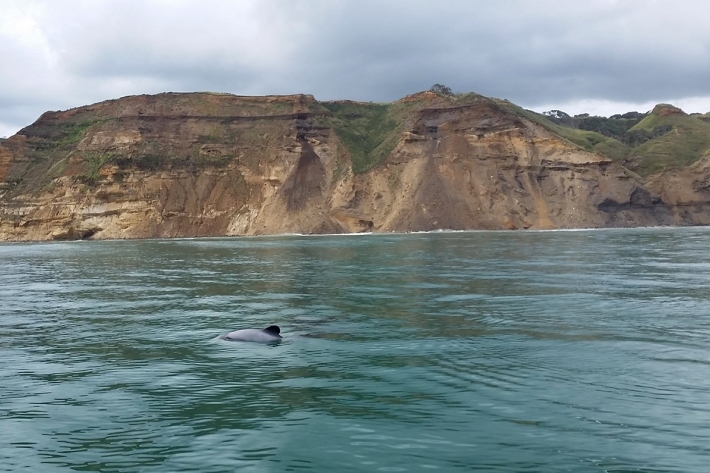
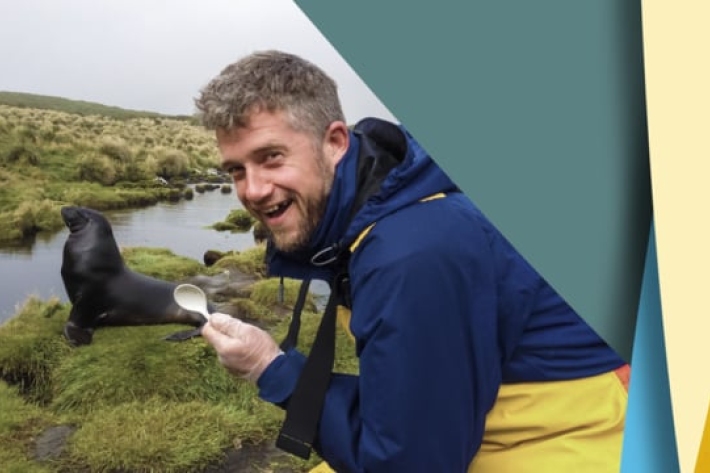
Acoustic monitoring of the critically endangered Māui dolphin
Research ProjectMāui dolphins, a subspecies of Hector’s dolphins, are listed as nationally critical in New Zealand with a population estimate between 57 and 75 dolphins over one year old. -
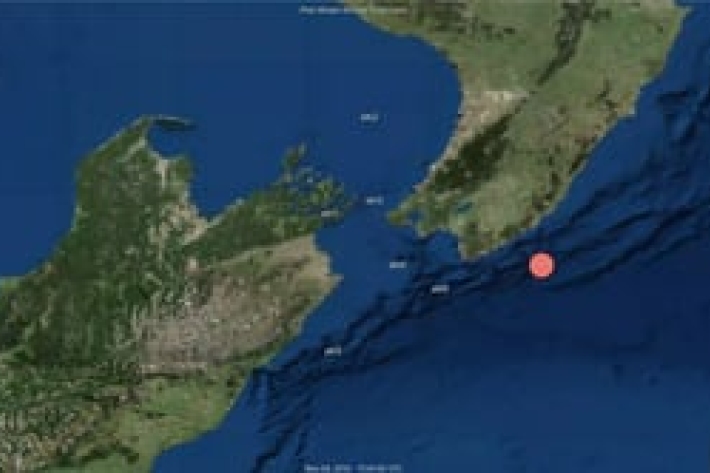
Pilot whale calls detected by acoustic recorder stationed in Cook Strait, New Zealand
Pilot whale (Globicephala sp.) calls detected by acoustic recorder stationed in Cook Strait, New Zealand from December 2016 to January 2017. -
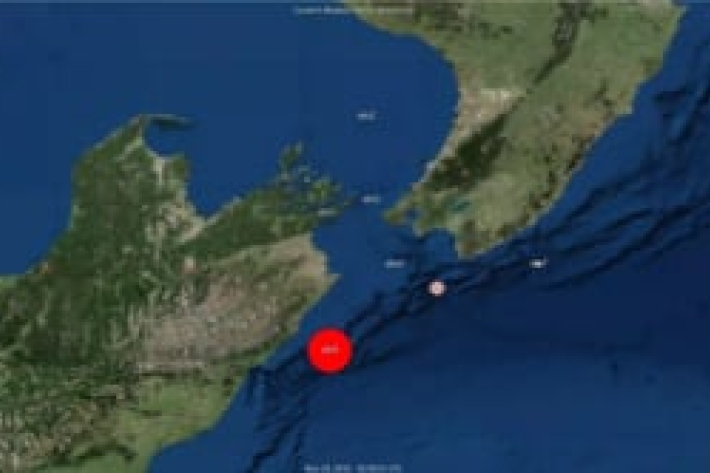
Cuvier’s beaked whales (Ziphius cavirostris) in Cook Strait, New Zealand
Cuvier’s beaked whale (Ziphius cavirostris) calls detected by acoustic recorder stationed in Cook Strait, New Zealand from December 2016 to January 2017. -
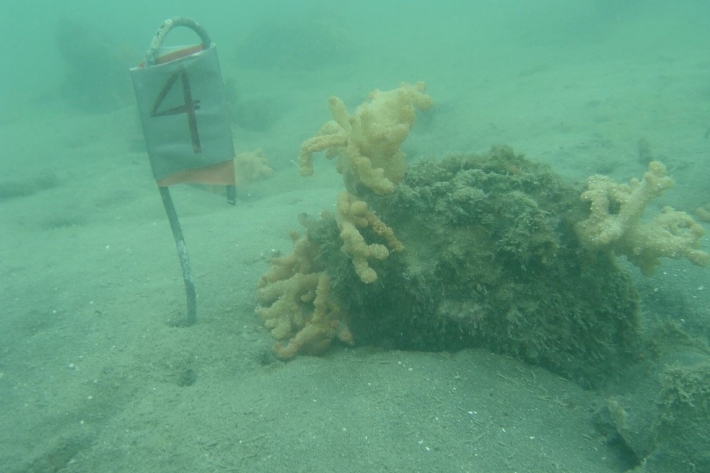
Biological traits, a new tool for estimating ecosystem health and vulnerability
Research ProjectBiological traits analysis is a valuable tool for measuring ecosystem function. -
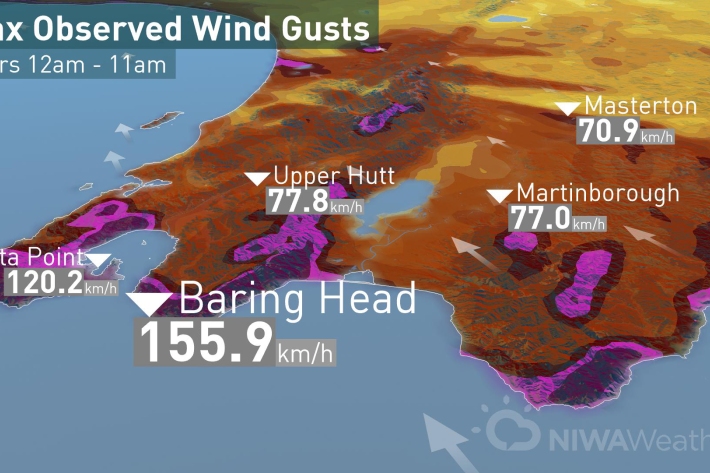
So far, so stormy
Media release13 July 2017Today’s low came spinning off the coast of Hawke’s Bay funneling strong winds through the Cook Strait and hitting Wellington region with strong winds before moving on to Taranaki and Auckland this afternoon. -
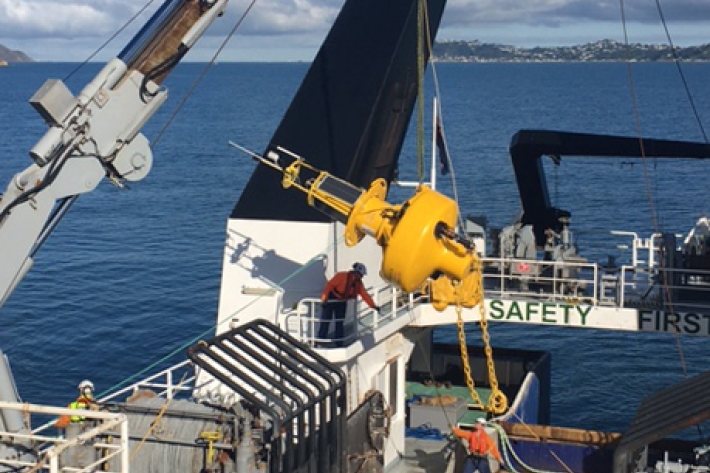
New buoy for Wellington Harbour to boost water quality information
News article10 July 2017A buoy with the ability to “phone home” has been deployed in Wellington Harbour today to monitor currents, waves and water quality in the harbour. -

Rare octopus turn up at NIWA
Media release03 July 2017NIWA’s Marine Invertebrate Collection has welcomed two extremely rare octopus that have only just been provisionally identified. -
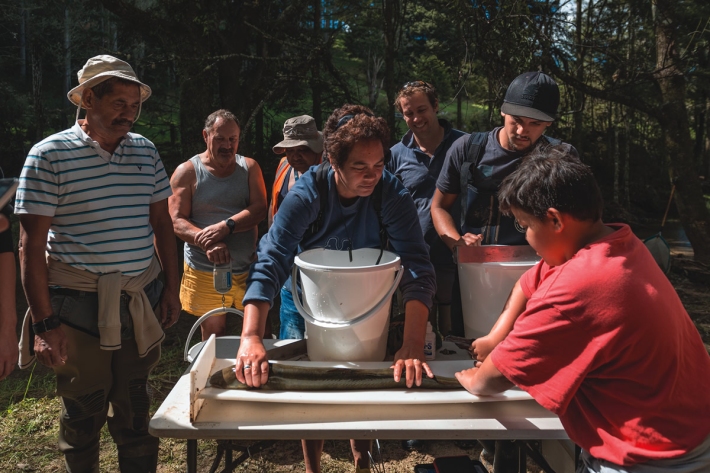
Hapū joins forces with NIWA in tuna research
Feature story20 June 2017Local hapū and NIWA are working together to find out more about juvenile freshwater eels or tuna in streams connecting to the Wairua River in the Wairoa catchment in Northland. -
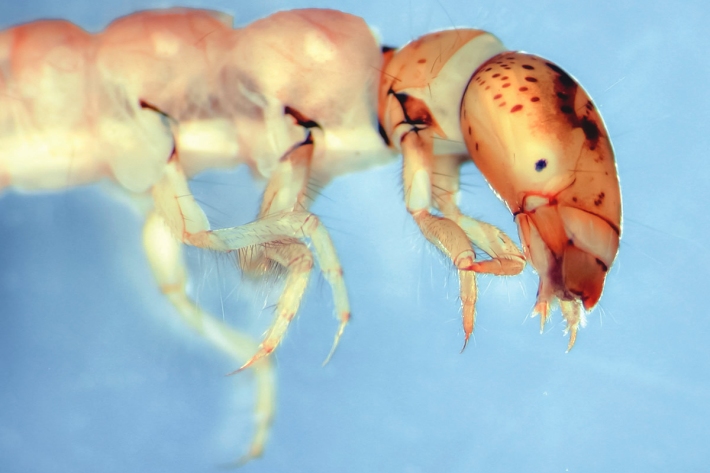
Q&A: Another way to measure river health
Feature story20 June 2017There’s another way of measuring the health of rivers – the health of invertebrate populations that need them, says John Quinn, NIWA Chief Scientist, Freshwater
and Estuaries.