-

Map I South
Education ResourceThe climate of this zone is largely dependent on the lie of the Southern Alps to the west, but many areas are also sheltered by high country to the south and east. -
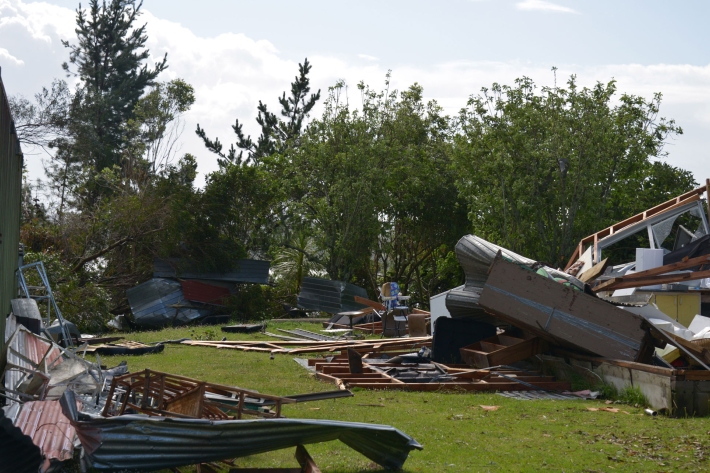
Extreme weather - winds and tornadoes
Education ResourceDue to its position in the 'Roaring Forties', a belt of strong winds in the Southern Hemisphere which generally occur between the latitudes of 40 and 49 degrees, as well as its small size, New Zealand is a windy country. -
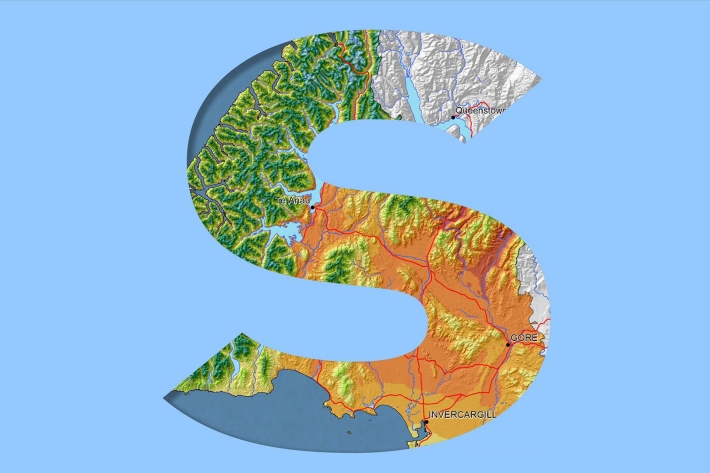
Southland
Southland is both the most southerly and most westerly part of New Zealand and generally is the first to be influenced by weather systems moving onto the country from the west or south. -
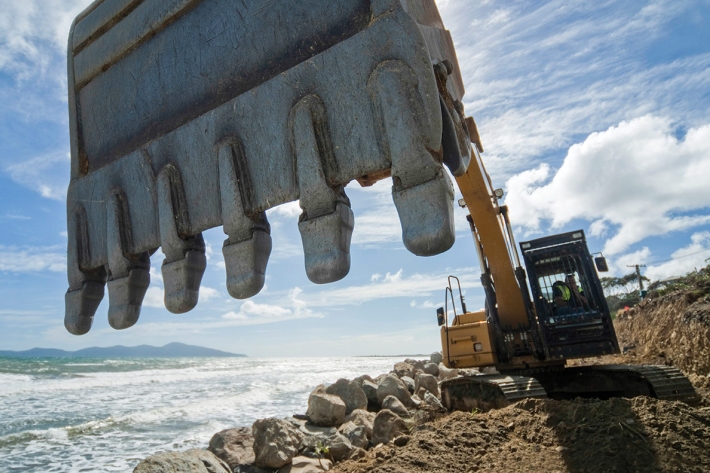
Shifting Sands – the end of a Kiwi dream
Feature story06 June 2017The Kiwi dream of owning a beachfront property with panoramic views of the ocean is under threat—and not just for financial reasons. -
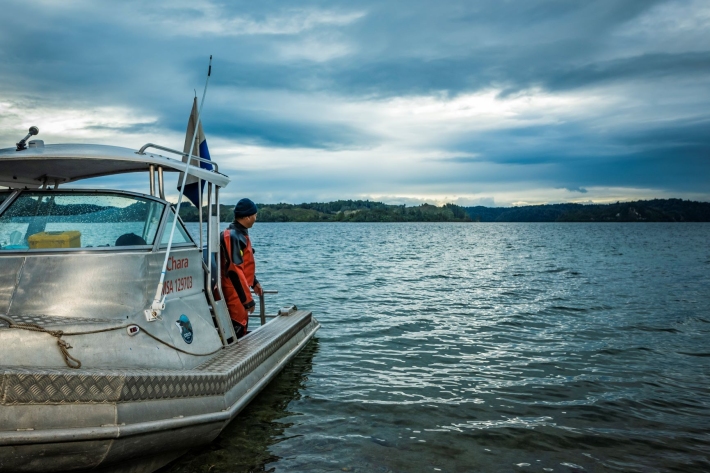
Other vessels
FacilityNIWA operates about 30 other Maritime New Zealand-certified vessels based at Bream Bay, Auckland, Hamilton, Rotorua, Turangi, Wellington, Nelson, Greymouth, Tekapo, Christchurch, and Dunedin. -
Tuna - maturation and identifying sex
The sex of tuna is not determined genetically, as in some other organisms. -
Water temperature and hydro
How do hydro-electricity activities potentially influence waterway temperatures? -
Methane
FacilityMethane (CH4) is the second most important greenhouse gas after CO2 that is produced by human activities. -
Causes of sedimentation
What are the potential sources of sediments from land use activities? -
Soil Moisture Deficit (SMD)
The 3-panel Soil Moisture Deficit (SMD) map shows the historical soil moisture deficit at the date shown (left), the soil moisture deficit at the same time last year (middle) and the current soil moisture deficit (right).