-

Graphing with Microsoft Excel
How do I create a graph?
Using Microsoft® Excel is easy because the Chart Wizard does all the work for you!
Simply enter the data for your data table.
Highlight the cells you want to graph.
Click on the Chart Wizard icon on the Tool Bar.
Select the chart type you want to use and click Next.
Click Next to confirm the range of cells.
Give your graph a title, label x- and y-axis and click Next.
Click on the gridlines tab to remove or add gridlines.
Click Finish and graph is complete!
Help, my graph is too small!
When the chart wizard creates your graph it will probably be too smal -
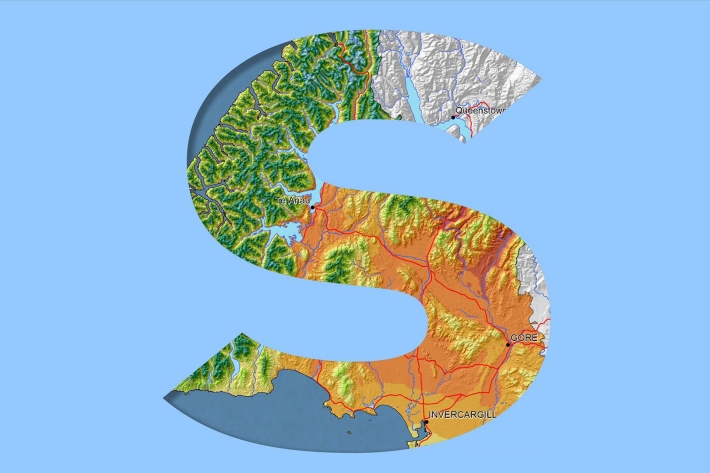
Southland
Southland is both the most southerly and most westerly part of New Zealand and generally is the first to be influenced by weather systems moving onto the country from the west or south. -
Kōaro
Kōaro are excellent climbers and like clear, swiftly flowing, forested streams. -
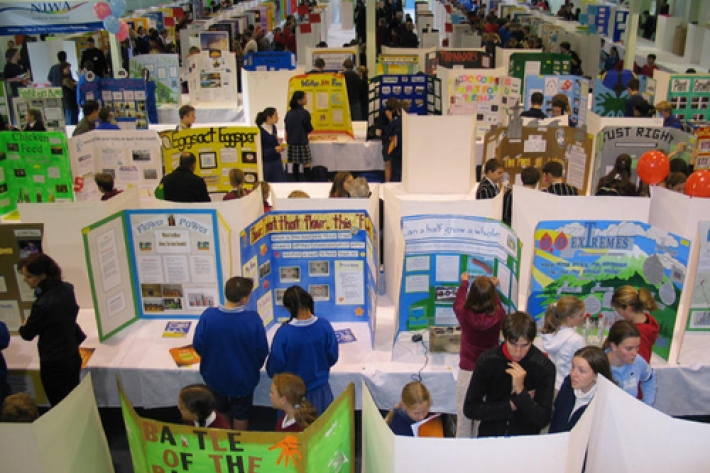
Working with schools
We sponsor regional science and technology fairs around New Zealand and support learning programmes that bring science into the classroom. -
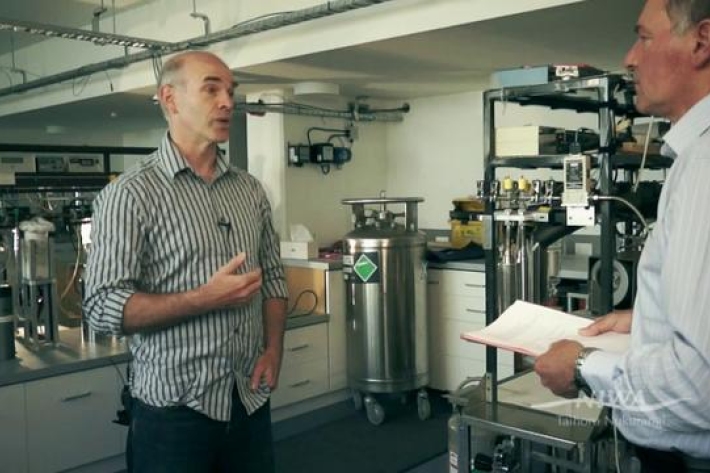
What is Ocean acidification?
NIWA oceanographer Dr Cliff Law explains the impacts of ocean acidification on organisms that use carbonates to build their shells, and on bacteria. -
Map I South
Education ResourceThe climate of this zone is largely dependent on the lie of the Southern Alps to the west, but many areas are also sheltered by high country to the south and east. -
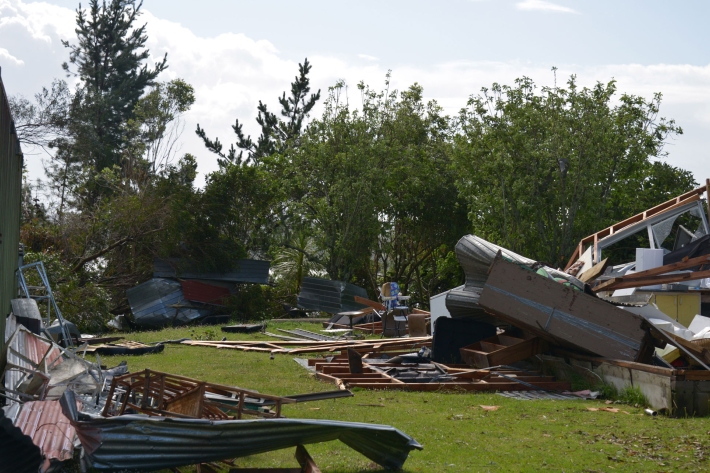
Extreme weather - winds and tornadoes
Education ResourceDue to its position in the 'Roaring Forties', a belt of strong winds in the Southern Hemisphere which generally occur between the latitudes of 40 and 49 degrees, as well as its small size, New Zealand is a windy country. -

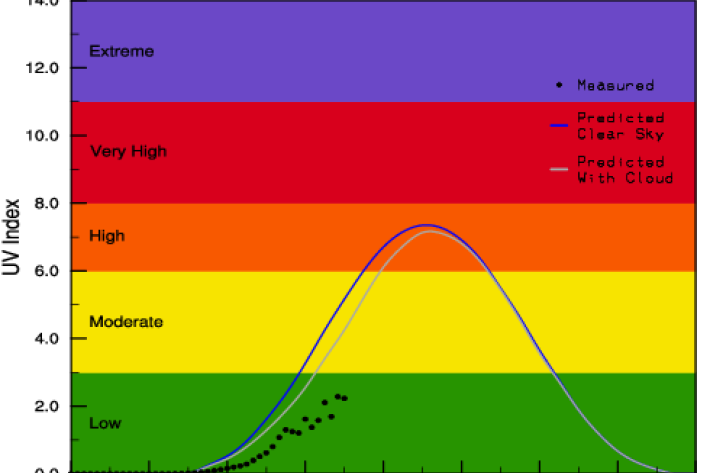
UVI smartphone apps
Several apps that provide forecasts of the UV index (UVI) are available for smartphones. -
NIWA staff profile: Nava Fedaeff
Feature story06 June 2017At the age of seven, NIWA’s youngest climate scientist, Nava Fedaeff, swapped sub-arctic Siberia for balmy Auckland – and her first job was to learn to swim.