-
What is ocean acidification?
Education ResourceOcean acidification is the name given to the lowering of pH of the oceans as a result of increasing carbon dioxide (CO2) in the atmosphere. -
QGIS
QGIS is a free, open source, desktop mapping tool, widely used in New Zealand in government, research, commercial and NGO arenas. -
Lesson 9: Ngā Tohu o te Taiao – Māori environmental indicators
Education ResourceThis lesson will explore the use of Māori environmental indicators [tohu] to anticipate local weather and climate conditions. -
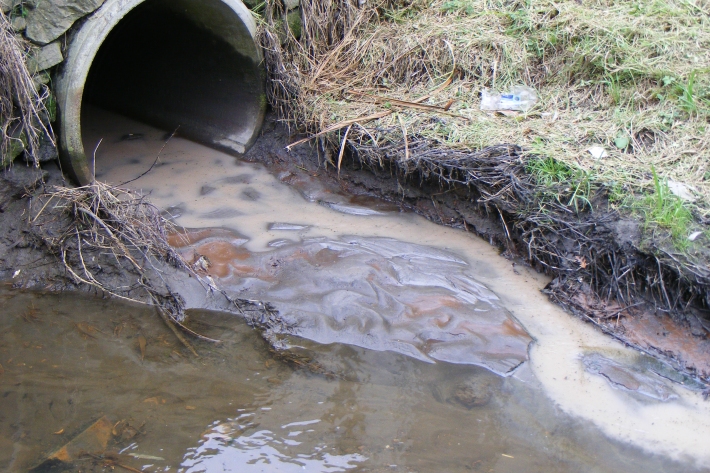
Instream barriers and altered water flow
Instream barriers and diversions alter the natural flow of rivers, streams, and lakes. -

Lake Ōmāpere and the Utakura River
Tuna harvested from Lake Ōmāpere and Utakura River catchment have long comprised an important fishery for tangata whenua. -

Dry stock farming activities
Dry stock farms can cover large areas of hill-country grassland that may be steep and prone to erosion. -
Graphing with Microsoft Excel
How do I create a graph?
Using Microsoft® Excel is easy because the Chart Wizard does all the work for you!
Simply enter the data for your data table.
Highlight the cells you want to graph.
Click on the Chart Wizard icon on the Tool Bar.
Select the chart type you want to use and click Next.
Click Next to confirm the range of cells.
Give your graph a title, label x- and y-axis and click Next.
Click on the gridlines tab to remove or add gridlines.
Click Finish and graph is complete!
Help, my graph is too small!
When the chart wizard creates your graph it will probably be too smal -
NIWA staff profile: Nava Fedaeff
Feature story06 June 2017At the age of seven, NIWA’s youngest climate scientist, Nava Fedaeff, swapped sub-arctic Siberia for balmy Auckland – and her first job was to learn to swim. -
Tuna - identification
There are several ways to tell the three New Zealand eel species apart. -
Kōaro
Kōaro are excellent climbers and like clear, swiftly flowing, forested streams.