-
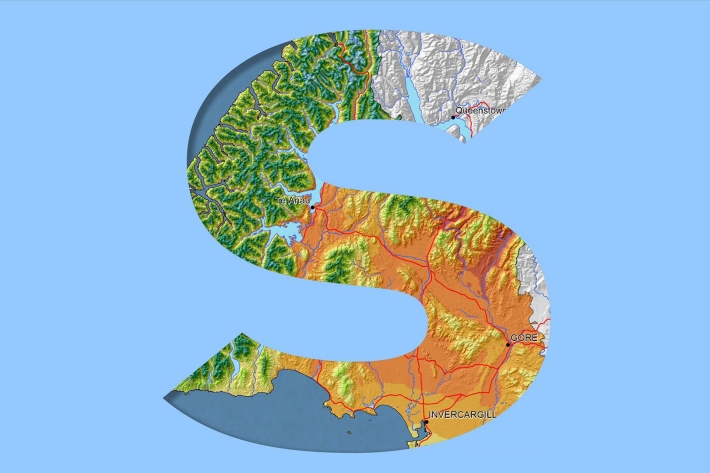
Southland
Southland is both the most southerly and most westerly part of New Zealand and generally is the first to be influenced by weather systems moving onto the country from the west or south. -
Nature knows best?
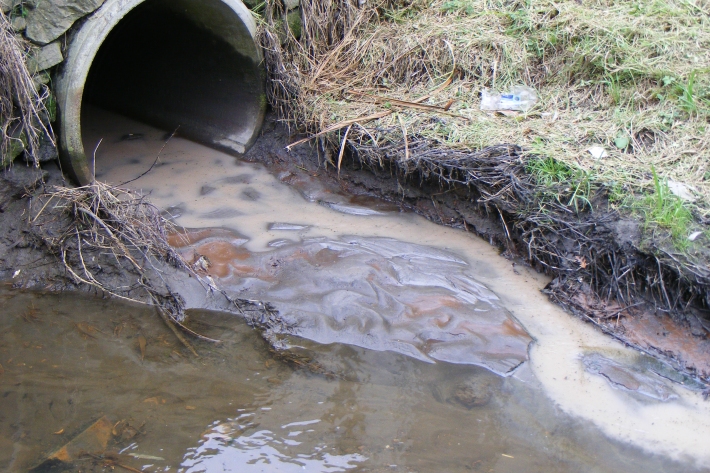
Feature story06 June 2017Returning water to our waterways after we’ve used it in our homes, on farms and in industry is a complex and challenging process. -
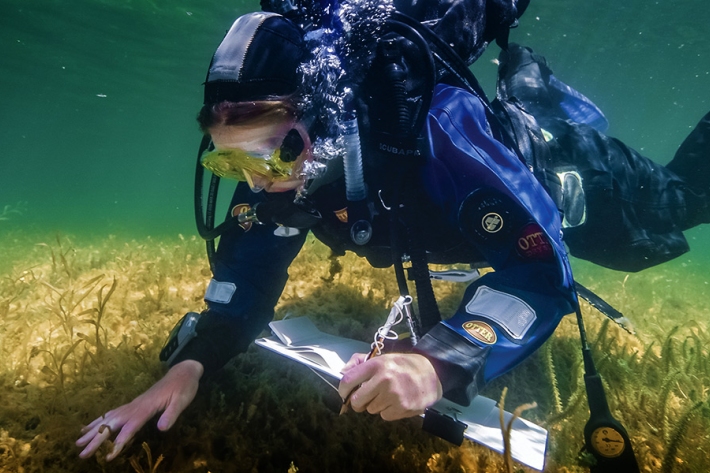
What is ocean acidification?
Education ResourceOcean acidification is the name given to the lowering of pH of the oceans as a result of increasing carbon dioxide (CO2) in the atmosphere. -

What is Ocean acidification?
NIWA oceanographer Dr Cliff Law explains the impacts of ocean acidification on organisms that use carbonates to build their shells, and on bacteria. -

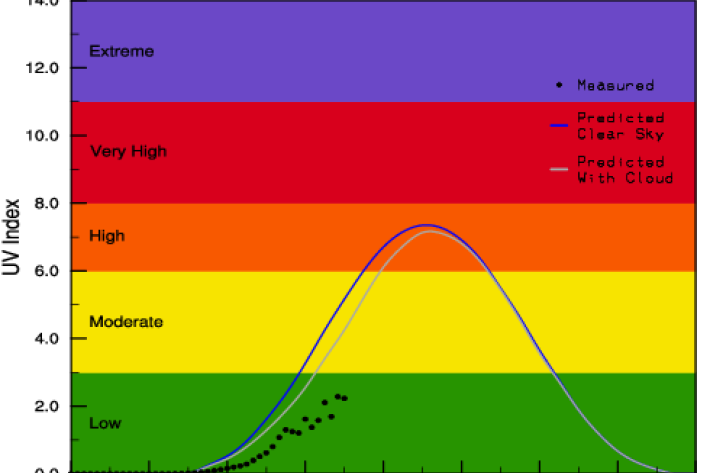
UVI smartphone apps
Several apps that provide forecasts of the UV index (UVI) are available for smartphones. -
Instream barriers and altered water flow
Instream barriers and diversions alter the natural flow of rivers, streams, and lakes. -

Dry stock farming activities
Dry stock farms can cover large areas of hill-country grassland that may be steep and prone to erosion. -

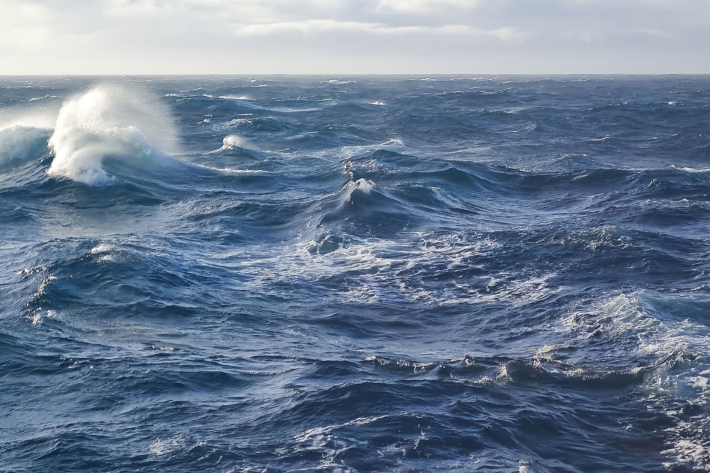
Summer Series 8: The forces behind beach ‘foam’
News article06 June 2017 -
Graphing with Microsoft Excel
How do I create a graph?
Using Microsoft® Excel is easy because the Chart Wizard does all the work for you!
Simply enter the data for your data table.
Highlight the cells you want to graph.
Click on the Chart Wizard icon on the Tool Bar.
Select the chart type you want to use and click Next.
Click Next to confirm the range of cells.
Give your graph a title, label x- and y-axis and click Next.
Click on the gridlines tab to remove or add gridlines.
Click Finish and graph is complete!
Help, my graph is too small!
When the chart wizard creates your graph it will probably be too smal