-

Tuna - solutions: upstream passage for elvers at large barriers
The need to provide upstream passage facilities for ensuring the long term sustainability of migratory freshwater fish populations is now well recognised. -
Instream barriers and altered water flow
Instream barriers and diversions alter the natural flow of rivers, streams, and lakes. -

Dry stock farming activities
Dry stock farms can cover large areas of hill-country grassland that may be steep and prone to erosion. -
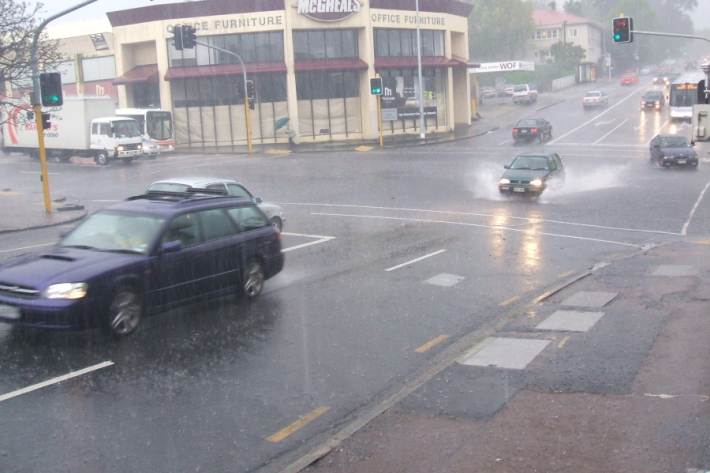
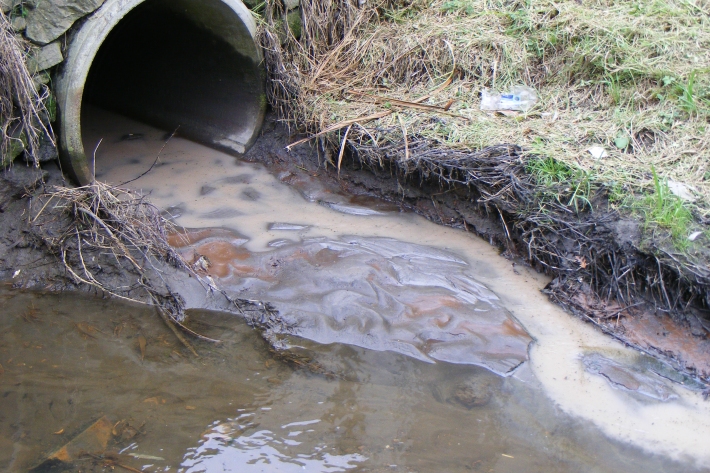
Stormwater - an introduction
Stormwater poses risks to NZ’s urban streams & coastal waters, affecting ecological health & the cultural, social, & economic value of these environments. -
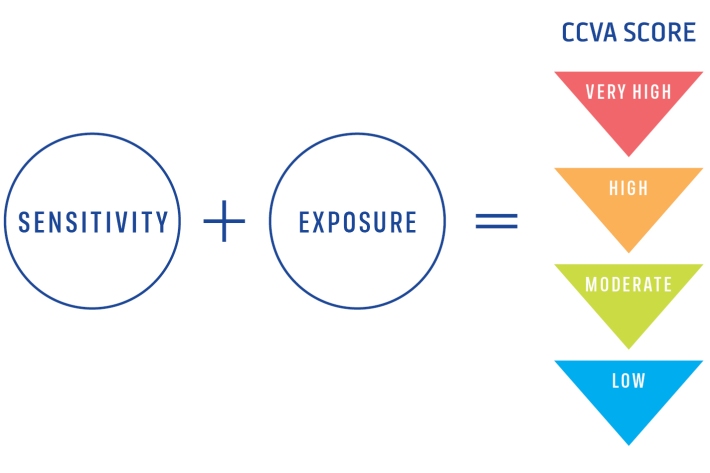
Climate Change Vulnerability Assessment (CCVA)
ServiceTo prepare for changes in climate, our freshwater and oceans decision-makers need information on species vulnerability to climate change. -
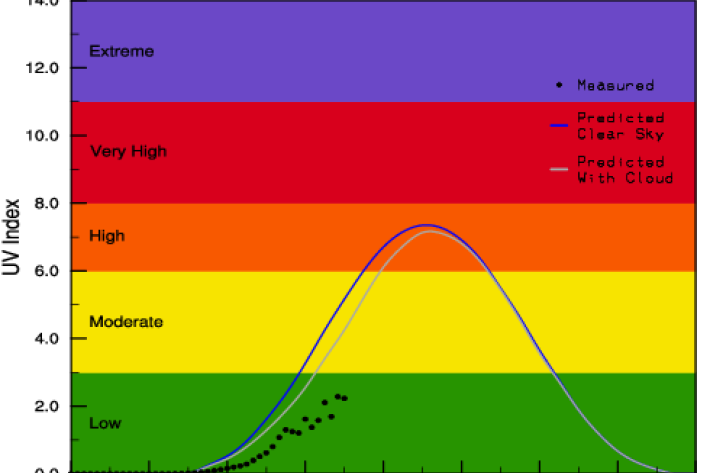
Graphing with Microsoft Excel
How do I create a graph?
Using Microsoft® Excel is easy because the Chart Wizard does all the work for you!
Simply enter the data for your data table.
Highlight the cells you want to graph.
Click on the Chart Wizard icon on the Tool Bar.
Select the chart type you want to use and click Next.
Click Next to confirm the range of cells.
Give your graph a title, label x- and y-axis and click Next.
Click on the gridlines tab to remove or add gridlines.
Click Finish and graph is complete!
Help, my graph is too small!
When the chart wizard creates your graph it will probably be too smal -
Kiribati plans for climate change
-
Kōaro
Kōaro are excellent climbers and like clear, swiftly flowing, forested streams. -
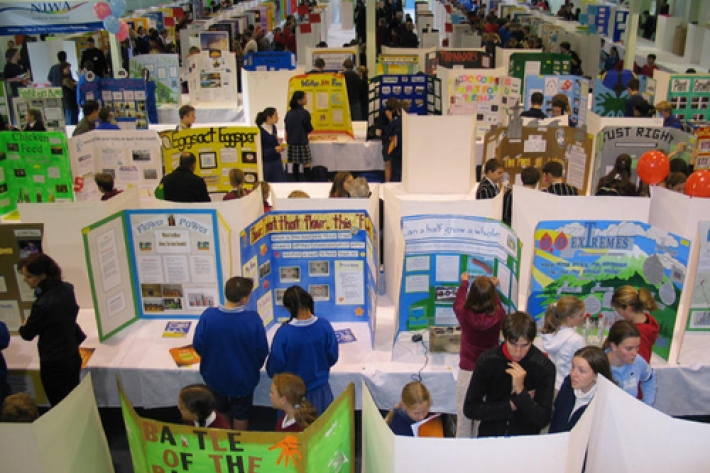
Working with schools
We sponsor regional science and technology fairs around New Zealand and support learning programmes that bring science into the classroom. -
Map I South
Education ResourceThe climate of this zone is largely dependent on the lie of the Southern Alps to the west, but many areas are also sheltered by high country to the south and east.