A weekly update describing soil moisture patterns across the country to show where dry to extremely dry conditions are occurring or imminent. Regions experiencing significant soil moisture deficits are deemed “hotspots”. Persistent hotspot regions have the potential to develop into drought.
Facts: Soil Moisture
In the North Island, most areas saw relatively light rainfall totals of 5-20 mm during the past week. However, locally heavy showers and thunderstorms brought 30-60 mm to parts of Northland, Coromandel Peninsula, Gisborne, Taranaki, and Manawatū-Whanganui. This generally resulted in slight soil moisture decreases across the North Island. The driest soils across the North Island, when compared to normal for this time of the year, are found in western Northland, western Waikato, and northern Manawatū-Whanganui, while the wettest soils for this time of the year are found in coastal Gisborne and coastal Manawatū-Whanganui.
Hotspot conditions are now located across much of the upper half of the North Island, along with most of the east coast with the exceptions of coastal Gisborne and southern Wairarapa. As of 25 January, the New Zealand Drought Index (NZDI) map below shows that dry conditions are now located across nearly all of the upper North Island, Bay of Plenty, parts of Gisborne and Hawke’s Bay. In addition, very dry or extremely dry conditions are located in much of Northland, Auckland, and Waikato, while a small area of meteorological drought has emerged in northwest Northland.
In the South Island, many areas saw weekly rainfall totals reach 5-20 mm, but small pockets of 30-60 mm were observed in Tasman, western Marlborough, northern and central Canterbury, and southwestern Southland. This resulted in small soil moisture increases from Marlborough to Canterbury, while the remainder of the South Island generally saw little change. The driest soils in the South Island, when compared to normal for this time of the year, are located in parts of the West Coast and in Fiordland, while the wettest soils for this time of the year are found in far northern Canterbury.
Hotspots are currently located in northeastern Tasman, along with parts of southern Otago and coastal Southland. As of 24 January, the New Zealand Drought Index (NZDI) map below shows that dry conditions are now located across parts of the upper South Island, interior and southern Otago, eastern Southland and Stewart Island. In addition, very dry conditions are located in small parts of the upper South Island, interior Otago, eastern Southland and Stewart Island, and extremely dry conditions are located in a small area near Bluff.
Outlook and Soil Moisture
In the North Island, high pressure will be in place over the next several days, resulting in dry weather for nearly all locations through to at least Tuesday of next week (1 February). By the middle or end of next week, there is a low chance that some tropical moisture could reach the North Island, but it is too early to determine placement or amounts. Weekly rainfall amounts could be very meagre across much of the North Island, with some locations likely not seeing any rainfall at all.
Due to the expected lack of rainfall in the next week, soil moisture levels could decrease substantially across much of the North Island. This could further entrench hotspot conditions in the upper half of the island and along the east coast, while meteorological drought could expand in the upper North Island.
In the South Island, high pressure will result in generally dry weather over the next several days, although a weak front may bring showers to the deep south on Sunday (30 January). Around the middle of next week (2-3 February), a tropical plume of moisture may reach the South Island, and this could result in heavy rainfall, particularly in the West Coast. However, there remains much uncertainty at this time. Weekly rainfall amounts could be very meagre if the aforementioned tropical moisture plume misses the South Island. However, should it arrive, heavy rainfall above 150 mm could be widespread across the West Coast, with at least moderate amounts farther east.
Due to the uncertainty for the amount of rainfall in the next week, there is a wide range of possible outcomes for soil moisture, ranging from small decreases to large increases. The best chance for soil moisture increases will be in the West Coast, while the eastern South Island has the best chance to see soil moisture decreases.
Background:
Hotspot Watch: a weekly advisory service for New Zealand media. It provides soil moisture and precipitation measurements around the country to help assess whether extremely dry conditions are imminent.
Soil moisture deficit: the amount of water needed to bring the soil moisture content back to field capacity, which is the maximum amount of water the soil can hold.
Soil moisture anomaly: the difference between the historical normal soil moisture deficit (or surplus) for a given time of year and actual soil moisture deficits.
Definitions: “Extremely” and “severely” dry soils are based on a combination of the current soil moisture status and the difference from normal soil moisture (see soil moisture maps at https://www.niwa.co.nz/climate/nz-drought-monitor/droughtindicatormaps)
Hotspot: A hotspot is declared if soils are "severely drier than normal" which occurs when Soil Moisture Deficit (SMD) is less than -110 mm AND the Soil Moisture Anomaly is less than -20 mm.

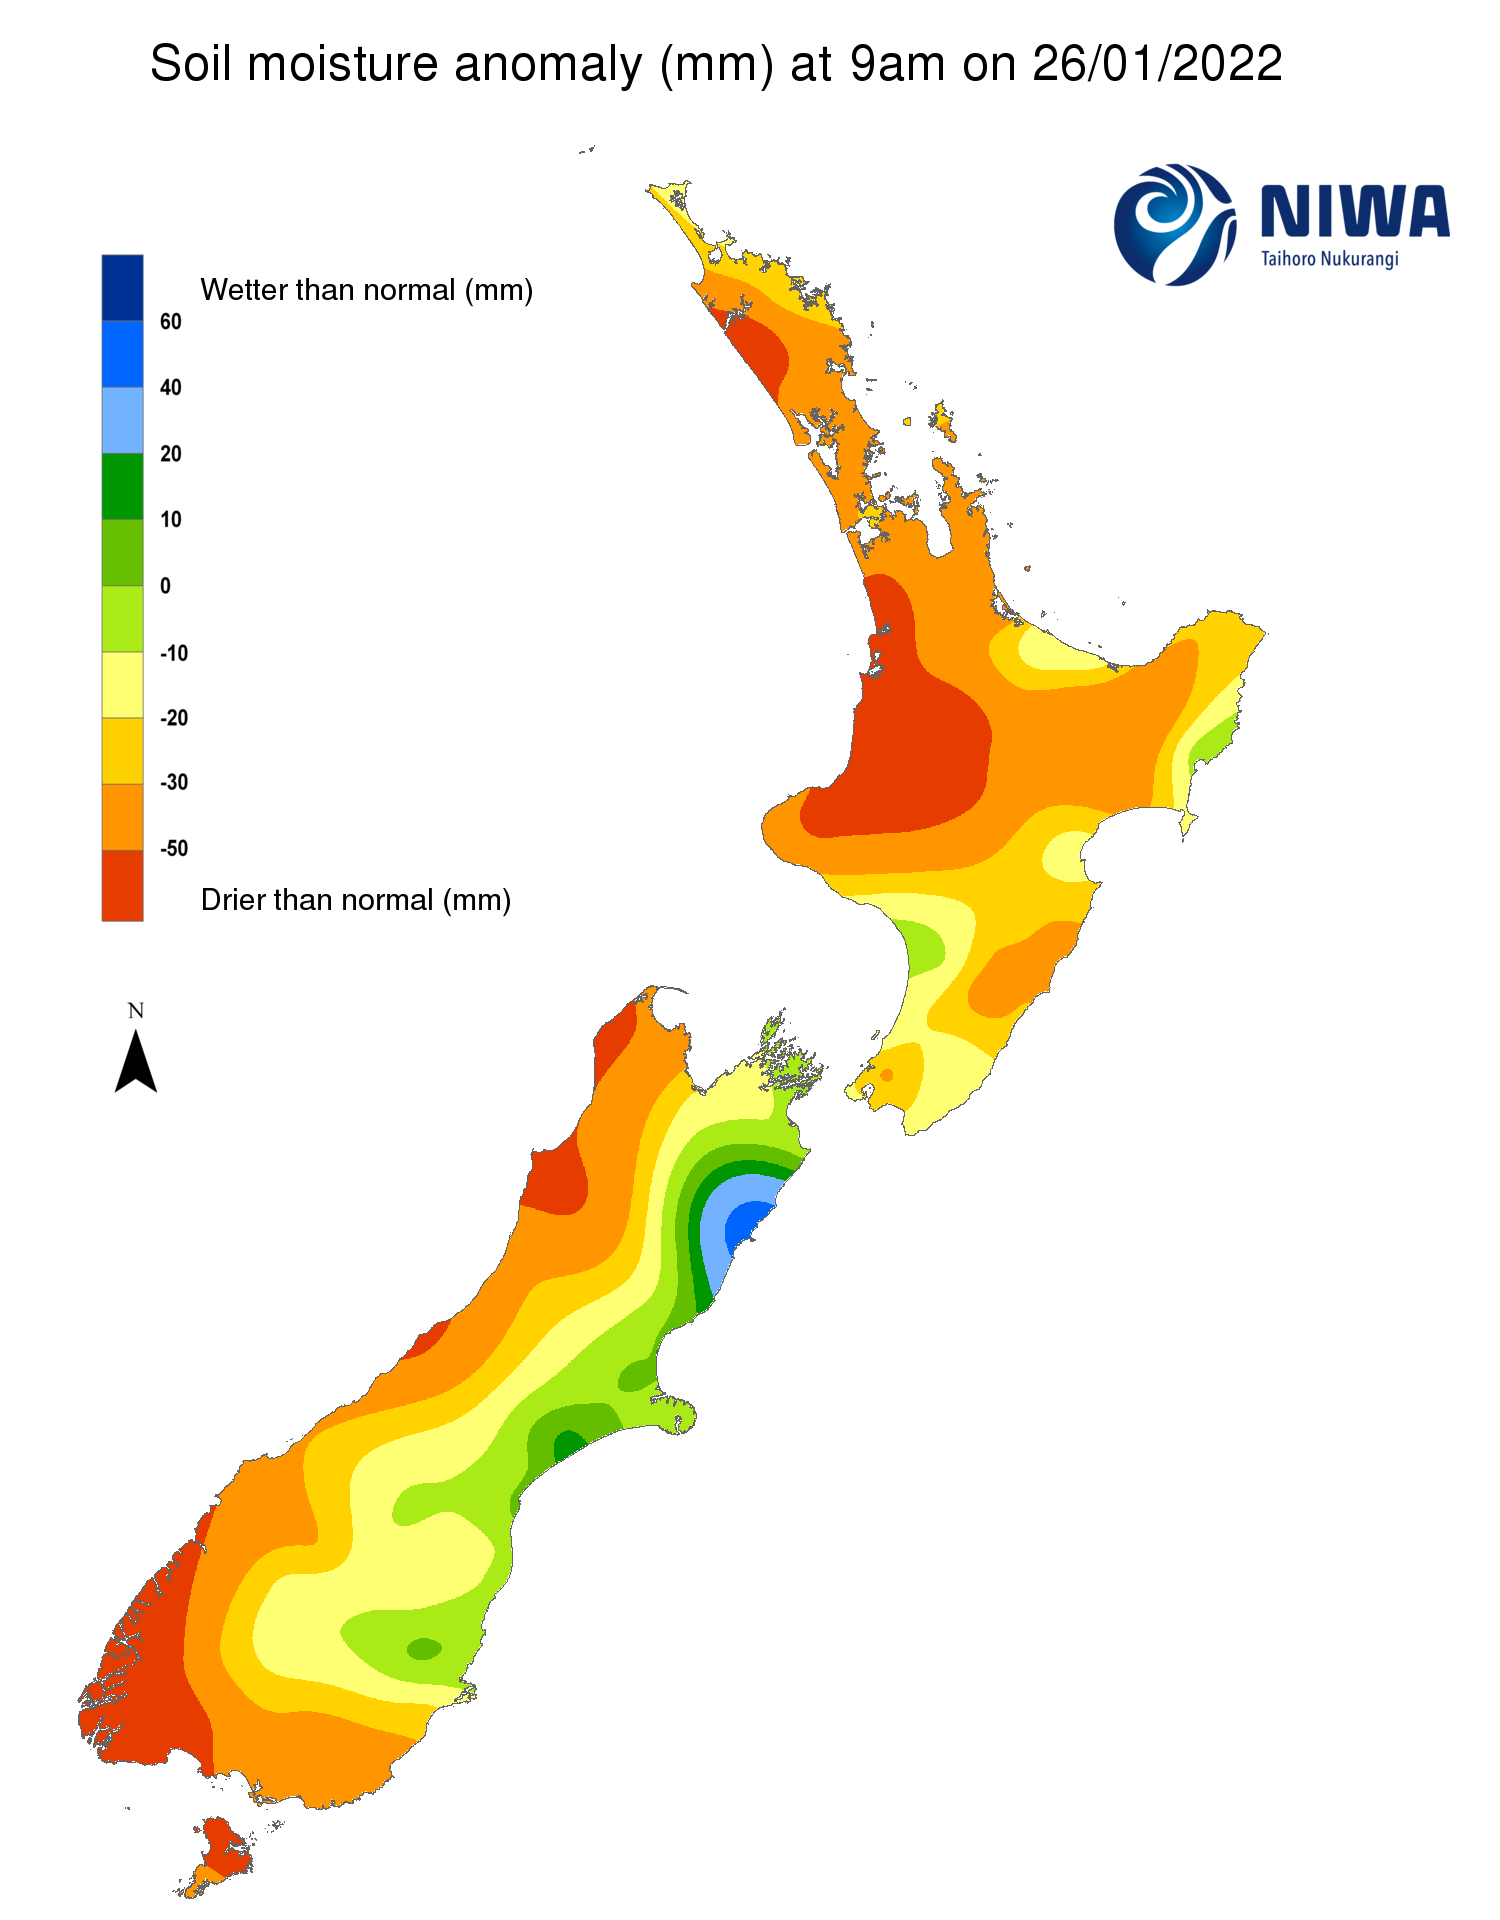
Pictured above: Soil Moisture Anomaly Maps, relative to this time of year. The maps show soil moisture anomaly for the past two weeks.
New Zealand Drought Index (NZDI)
As of 25 January, the New Zealand Drought Index (NZDI) map below shows that dry conditions are now located across nearly all of the upper North Island, Bay of Plenty, parts of Gisborne and Hawke’s Bay, the upper South Island, interior and southern Otago, eastern Southland and Stewart Island. In addition, very dry or extremely dry conditions are located in much of Northland, Auckland, Waikato, eastern Southland and Stewart Island. A small area of meteorological drought has now emerged in northwest Northland. Please note: some hotspots in the text above may not correspond with the NZDI map. This difference exists because the NZDI uses additional dryness indices, including one which integrates the rainfall deficit over the past 60 days. Changes are therefore slower to appear in the NZDI compared to soil moisture anomaly maps that are instantaneously updated.