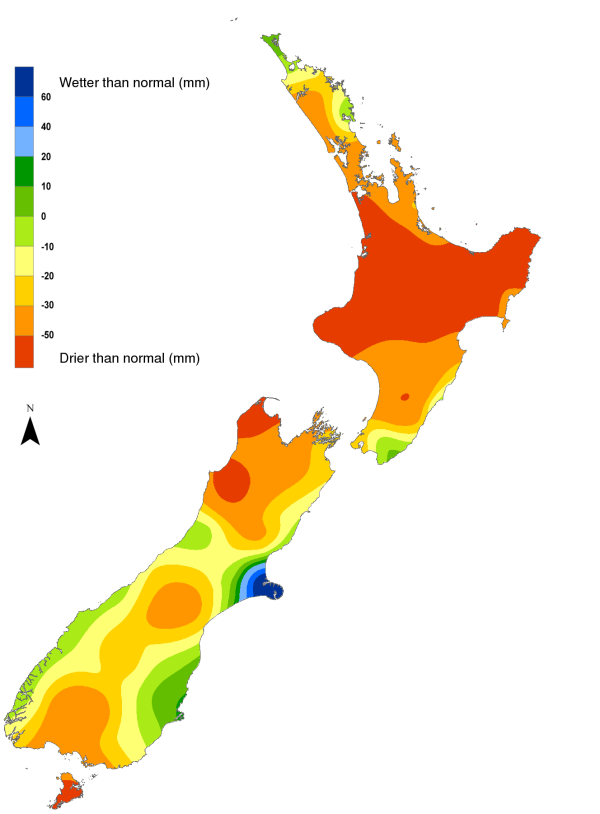
There are several ways of defining drought and several methods for identifying whether a drought has started. None of these methods are "the best" indicator of drought, because it very much depends upon the application of the information (i.e. for water supply calculations, for irrigation potential, for pasture production estimates, etc.)
Here we present a range of drought indicators. These are maps of the soil moisture deficit (SMD) and the standardised precipitation index (SPI) - both updated daily, as well as maps of rainfall deciles (RD) - updated monthly. In the future, we will also produce maps based on the potential evapotranspiration deficit (PED), which was used as an indicator in the NIWA 2012-2013 drought report.
For each drought indicator, we have identified the threshold values which can be used to indicate whether drought conditions are "imminent" and/or "likely evident". However, we stress here that this information should be used for guidance only and is not the sole source of information used in the official declaration of droughts.
Related information
-

Soil Moisture Deficit (SMD)
The 3-panel Soil Moisture Deficit (SMD) map shows the historical soil moisture deficit at the date shown (left), the soil moisture deficit at the same time last year (middle) and the current soil moisture deficit (right). -

Standardised Precipitation Index (SPI)
The Standardised Precipitation Index (SPI) is a simple measure of drought (and also of very wet conditions) and is based solely on the accumulated precipitation for a given time period. -

Rainfall Deciles (RD)
If you list all the historic rainfall totals for a particular month and for a specific location, rank these from lowest to highest, then divide the list into ten equal parts, you have identified the ten rainfall deciles for that month and for that location.

