When it rains it pours – extreme weather
Everything is connected
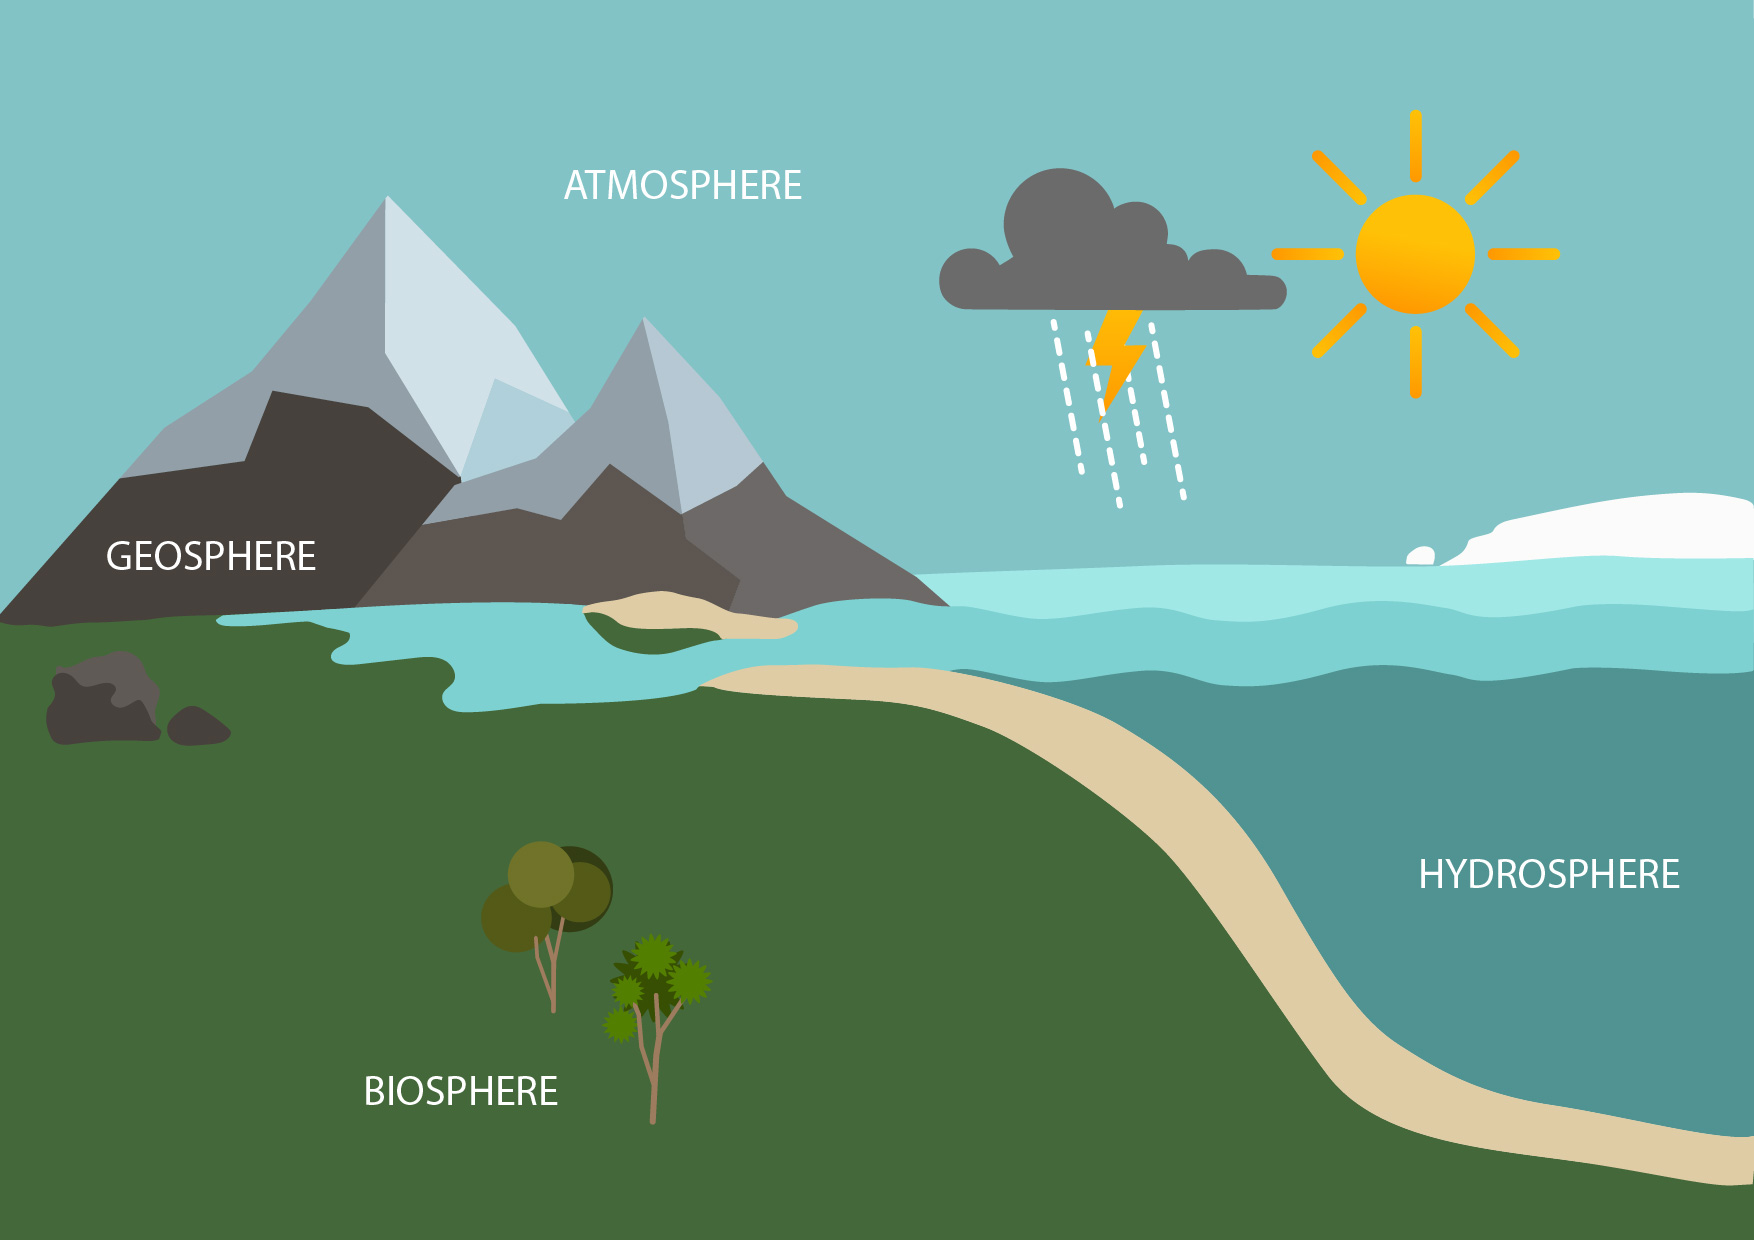
To understand the link between extreme weather and climate change, we need to first understand Earth’s systems. The natural world and Earth’s climate results from interactions between multiple related systems and elements.
These include the atmosphere (the layer of gas that surrounds Earth), the hydrosphere (oceans and atmospheric and terrestrial/land dwelling water), the cryosphere (ice and snow), the biosphere (animals and plants), and the pedosphere (soil) and lithosphere (the Earth’s crust and upper mantle), also known as the geosphere. Together, these processes are part of a global system, a system that humans are part of.
The connections between the parts are equally important
If we make a change in one part, there will be an impact somewhere else. Natural and anthropogenic (human) activities and impacts can change the Earth’s climate, and, therefore, other systems and processes. For example, let’s take the atmosphere. Most heat trapping gases occur naturally – and although they only make up a small fraction of the atmosphere, they play a big role. Without them, too much heat would escape, and the surface of the planet would freeze.
However, human activity, especially since the early 1950s, has resulted in an increase in the concentration of heat trapping gases, resulting in more heat being trapped. This changes the composition of the atmosphere and, consequently, the Earth’s climate. Because all Earth’s systems are integrated and interdependent, this change in the atmosphere has wide ranging impacts.
Through Te Ao Māori and mātauranga Māori, Māori have always experienced everything as connected
“The Māori world view acknowledges a natural order to the universe, a balance or equilibrium, and that when part of this system shifts, the entire system is put out of balance. The diversity of life is embellished in this world view through the interrelationship of all living things as dependent on each other, and Māori seek to understand the total system and not just parts of it.” (Harmsworth & Awatere, 2013).
| Find out more |
| ACTIVITY: Here, there, and everywhere: To tune the ākonga into the interconnectedness of Earth’s systems, sit in a quiet space, either outside or inside but where they can look outside quietly observing what they see, hear, smell, and feel. Then invite them to share. An example may be ‘I hear the wind through the trees, a stream flowing, I see a seagull flying and a person walking’. Introduce the Earth’s different spheres (atmosphere, hydrosphere, cryosphere, biosphere, and the geosphere). Reflecting on what they shared, ask them to connect each to a sphere. Using our example - wind (atmosphere) through the trees (biosphere/geosphere), a stream (hydrosphere) flowing, a seagull (biosphere) flying (atmosphere) and a person (biosphere) walking. Express how the connections between the parts are equally important – if we make a change in one part, there will be an impact somewhere else. Invite them to share an example of what this may look like. |
When weather turns extreme
Weather refers to day-to-day conditions such as sun, wind and rain. For example, an intense rainstorm can turn into flooding in a short space of time.
Climate, on the other hand, is more than just a few warm, wet or cool days. Climate describes the typical weather conditions over a long period of time, i.e., 30 years or more for a country, region and/or town. In short, climate is what you expect, weather is what you get (National Oceanic and Atmospheric Administration).
‘Extreme weather’ refers to unexpected, unusual, severe, or unseasonal weather; weather at the extremes of what we would normally expect. These events may happen on a single day, or they may occur over a long period of time – for example droughts often develop when we have many weeks in a row without any rainfall.
Types of extreme weather include tropical cyclones, severe thunderstorms and tornadoes, and drought. As our climate changes, science tells us that extreme weather events (such as droughts and extreme rainfall) will increase in frequency and intensity in many places.
The relationship between El Niño and La Niña and climate change
El Niño and La Niña are opposite phases of a naturally occurring global climate cycle known as the El Niño Southern Oscillation, or ENSO for short. ENSO influences rainfall, temperature, and wind patterns around the world, including New Zealand.
El Niño and La Niña episodes occur on average every few years and last up to around a year or two. The Earth was in a strong La Niña phase between 2020 and 2023, and the flooding in early 2023 in the north and east of the North Island including Cyclone Gabrielle is typically associated with this weather pattern. It is expected that climate change will exacerbate the extremes of the hydrological cycle involving floods and droughts, which are already common with ENSO.
| Find out more
|
| ACTIVITY: El Niño - up close and personal: During 2023, the Earth entered into an El Niño phase. During El Niño, Aotearoa New Zealand tends to experience stronger or more frequent winds from the west in summer, which can encourage dryness in eastern areas and more rain in the west. In winter, the winds tend to blow more from the south, causing colder temperatures across the country. In spring and autumn, southwesterly winds are more common. Watch NIWA’s short clip What is El Niño? What is La Niña? (2m47sec), discussing the main differences and characteristics of both phases. |
| Referring to Aotearoa New Zealand Climate zones here, explore how they think the El Niño phase may affect Aotearoa New Zealand and their own region, while considering how climate change may exacerbate the extreme weather often attributed to an El Niño phase. |
| Find out more
|
| Activity: Models at work: To see a climate model at work, check out NIWA’s category 5 strength tropical cyclone model focused on Aotearoa New Zealand here. Animation showing hourly precipitation (yellow > red shading shows heavy precipitation) and cloud cover (white shading): |
| Reproducing tropical cyclones under past climatic conditions means that when the climate model looks to the future, scientists can look at how tropical cyclones are likely to change in intensity, number or path over time and under different future scenarios of greenhouse gas emissions (since the effects of climate change will be different depending on how quickly we reduce global emissions). |
Nga Waipuke - zoning in on flooding
Causes and types of flooding
As previously discussed, there are a number of events classified as extreme weather i.e. tropical cyclones, severe thunderstorms and tornadoes, drought.
The extreme weather damaging and flooding the township in the Flood Challenge Game is heavy or prolonged rainfall which causes the river to overflow its banks, possibly caused by a tropical cyclone and or prolonged, possibly intense rainfall. Flooding rivers are referred to as fluvial floods. Other types of floods are pluvial (rainfall) or flash floods (often caused by severe thunderstorms); and coastal floods or storm surge (where coastal land is flooded by the sea).
Floodwaters follow a downslope direction and pond where outflow is constricted
They carry sediment and build flood plains. Like the township in the game, many Aotearoa New Zealand towns and cities are located on these flood plains. Areas prone to flooding can be predicted by mapping historic flood inundation zones and by undertaking hydraulic modelling studies.
| Find out more: The Spinoff’s creative five-part documentary series ‘100 Year Forecast’ includes ‘Part three: Floods’. Through engaging graphics, video and text, the documentary invites us to take an up close and personal look at flooding and climate change in Aotearoa New Zealand. Using current and historical data, it follows the Ruamāhanga River flows (Wairarapa). And, with an estimate of 675,000 people (2013 Census) in Aotearoa New Zealand currently at risk of river or surface flooding, it explores what it means to live in ‘the zone’. To view the entire Spinoff documentary series, follow this link. |
|
Activity: Follow the path of your awa: Using Google Maps, invite ākonga to locate and follow the path of their nearest awa. Ask them to research its physical, cultural and environmental history. Reflecting on previous knowledge and respecting the river as a ‘wild thing’, what can and is being done to protect those who live in its flood zone. |
Human activity and floods
Floods are natural events, they have always happened. Natural climate variability affects the likelihood and location of flooding, e.g., during the El Niño weather pattern, floods are more likely to occur in the South and West of Aotearoa New Zealand. Human caused climate change can affect the frequency and intensity of floods. Other human activities, such as deforestation, improper agricultural practices, inadequate design of structures and drainage channels and inadequate maintenance of drainage facilities can also increase the severity of the impacts of floods. Floods can damage housing, infrastructure and farmland through saturation; hydrodynamic forces where the water flows against and around an objects such as a house or a bridge; ground scouring or deposition; transport of debris or pollutants.
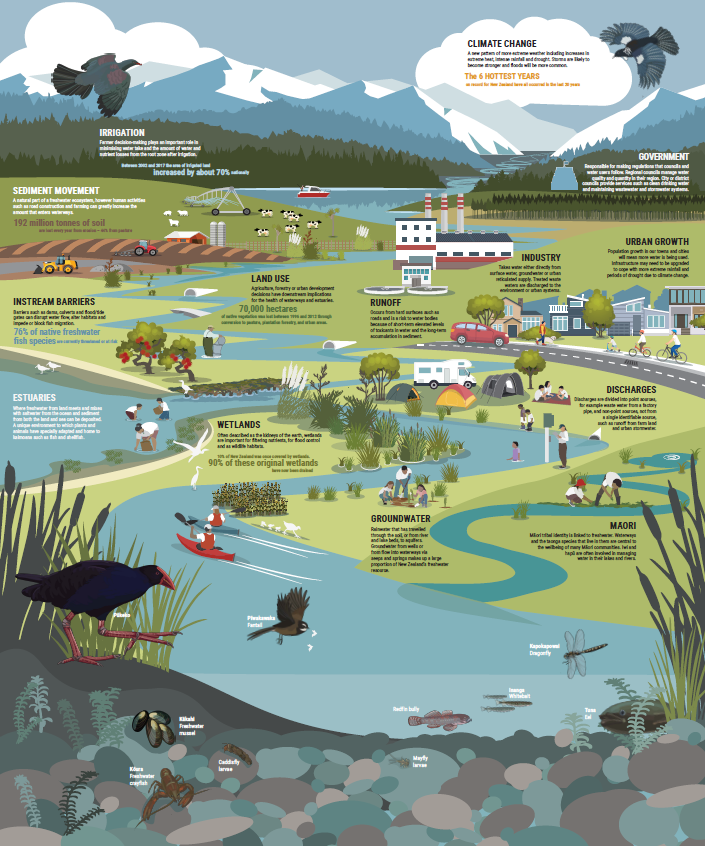
Click to download the image above as a PDF. The illustration shows a waterway flowing from mountains to the sea overlayed with a selection of human activities. These activities are examples of how we connect with, gain benefit from and alter these ecosystems. [Illustration 2019]
The science behind floods
Underpinning the danger of floods is the relationship between the energy and speed of a moving body of water: the amount of energy increases four times as the speed of the moving water doubles, (KE=1/2 mv2). This means that the amount of damage made by a moving body of water increases more as the speed of the body of water increases.
Also, the weight of an increased amount of water upstream leads to a pressure gradient that drives the flow of the water. When debris is added the flow magnifies, as it does when mud (which may include toxic organisms) is added to the water flow.
The confusion around the ‘100-year flood’ – what does it really mean
After a particularly destructive extreme weather event, more than likely you would have heard the term ‘one in a 100-year event’. But does that mean once experienced, it won’t happen for another 99 years? The short answer is no, unfortunately.
The probability that weather events such as floods will occur is often expressed as a return period. The inverse of probability (generally expressed in %), it gives the estimated time interval between events of a similar size or intensity.
For example, the return period of a flood might be 100 years; otherwise expressed as its probability of occurring being 1/100, or 1% in any one year. This does not mean that if a flood with such a return period occurs, then the next will occur in about one hundred years' time - instead, it means that, in any given year, there is a 1% chance that it will happen, regardless of when the last similar event was. Or, put differently, it is 10 times less likely to occur than a flood with a return period of 10 years (or a probability of 10%). In the same way that it is possible to roll double sixes twice in a row, it is possible to have two one in a 100-year floods in a short space of time.
| Activity: Understanding return periods Watch this video: Demystifying the 1-in-100-year event |
Next: Learning support #2: Climate change, floods and adaptation choices