-

Ancient isopods: conservation status of New Zealand phreatoicid isopods
These endemic freshwater crustaceans are truly living fossils that originated in Gondwana at least 325 million years ago and have changed little morphologically since that time. -
Voyage blog days 5-7
Over the past couple of days Tangaroa has come through rough seas although the conditions have not managed to dampen our spirits on this exciting journey. -
New Zealand IPY-CAML project
New Zealand conducted a major biological survey of the Ross Sea, in the Antarctic, as part of the Census of Antarctic Marine Life (CAML) and International Polar Year (IPY). -
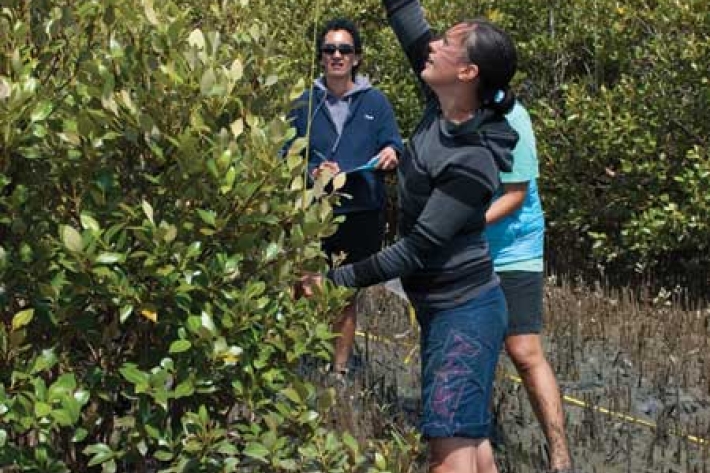
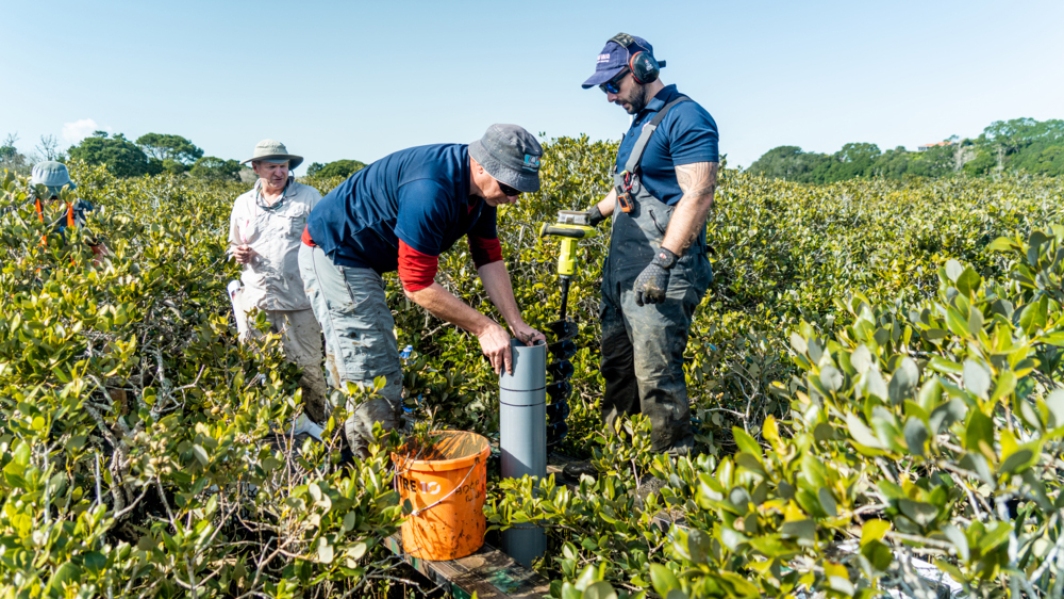
Estuary monitoring by communities
These guidelines outline a recommended minimum set of methods for a community group interested in following habitat changes in an estuary. -
Multi Channel Seismic (MCS) System
Modern marine geoscience requires accurate and detailed subsurface information for the mapping of geologic structures and sedimentary sequences beneath the continental margin. In order to acquire this information NIWA purchased a Multi Channel Seismic system (MCS) in December 1996, consisting of a 24 channel streamer, seismic source and acquisition hardware. -
Flow Cytometer
NIWA's Becton Dickinson FACSCalibur flow cytometer supports a wide range of research and commercial applications. -
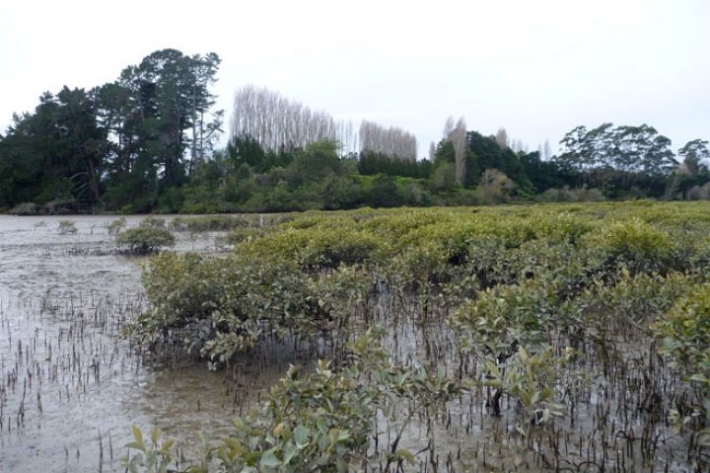
NZ estuaries
Over the past decade, NIWA has published many popular articles that deal with estuaries - this overview is intended to bring together and make whole sense of the information published to date in the various popular articles. -
The life of an estuary
An estuary is a semi-enclosed embayment, with a free connection to the sea at one end and a freshwater supply at the other.