-

Tidal energy optimisation
Research ProjectUnderstanding the complexity of tidal resources in New Zealand’s coastal waters and examining how extracting tidal energy would influence and be influenced by this variability. -
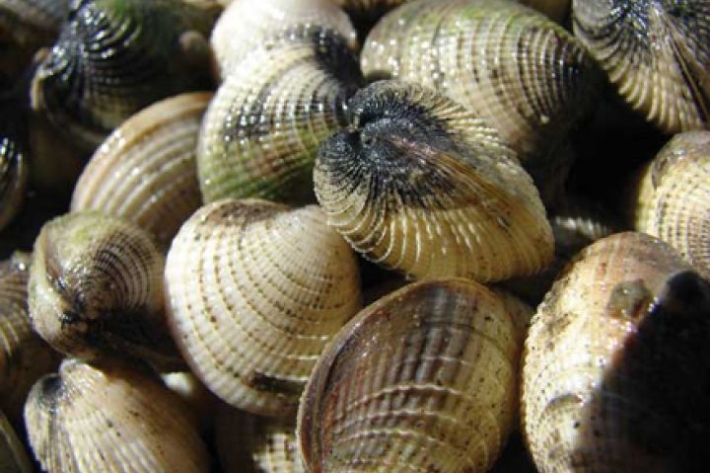
Estuarine Ecodiagnostics
Research ProjectEstuaries are highly valuable systems that provide enormous economic and cultural benefits to all kinds of people. However, expanding human populations and urban development around estuaries is increasing contaminant loads, with metals and polycyclic aromatic hydrocarbons (PAHs) accumulating in sediments. -

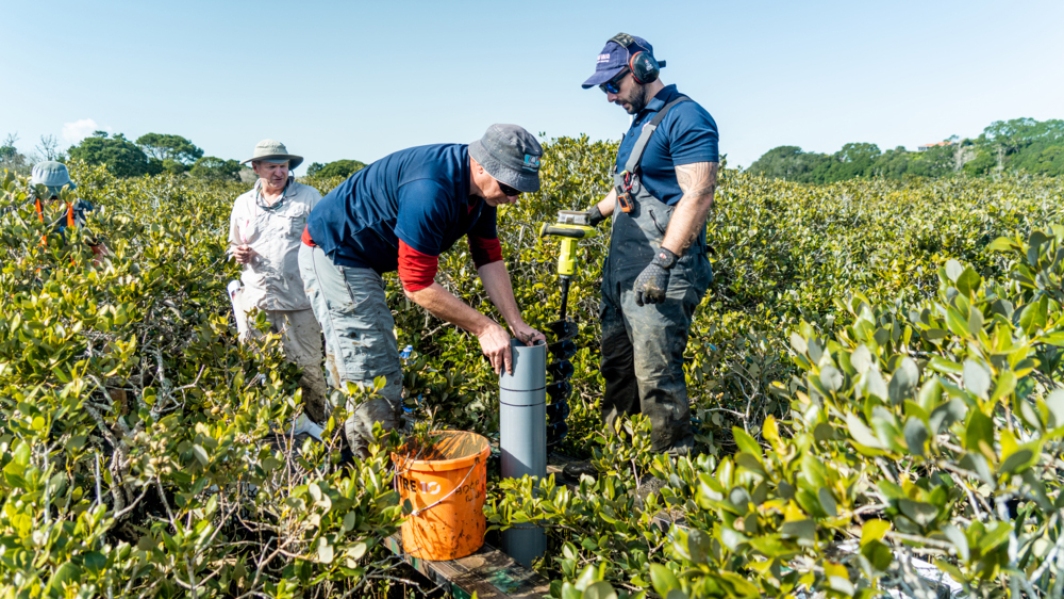
Ngā Waihotanga Iho - Iwi estuarine monitoring toolkit
Research ProjectNgā Waihotanga Iho, the estuarine monitoring toolkit for Iwi, has been developed to provide tangata whenua with tools to measure environmental changes in their estuaries. While Ngā Waihotanga Iho is based on sound science principles, it is also underpinned by tangata whenua values. -

Green Island
Data source – NIWA
Latest data The upper plot compares raw data (blue) and forecast tide (red). When the two curves are aligned there is no storm surge, which is the elevation or depression of sea level as a result of meteorological conditions. But if the raw data lie above or below the forecast tide, it means we have positive or negative storm surge. The lower plot compares storm surge (SS) with inverted barometer (IB), which is derived from atmospheric pressure. When the two curves are aligned it means that the storm surge is being driven by local pressure changes.