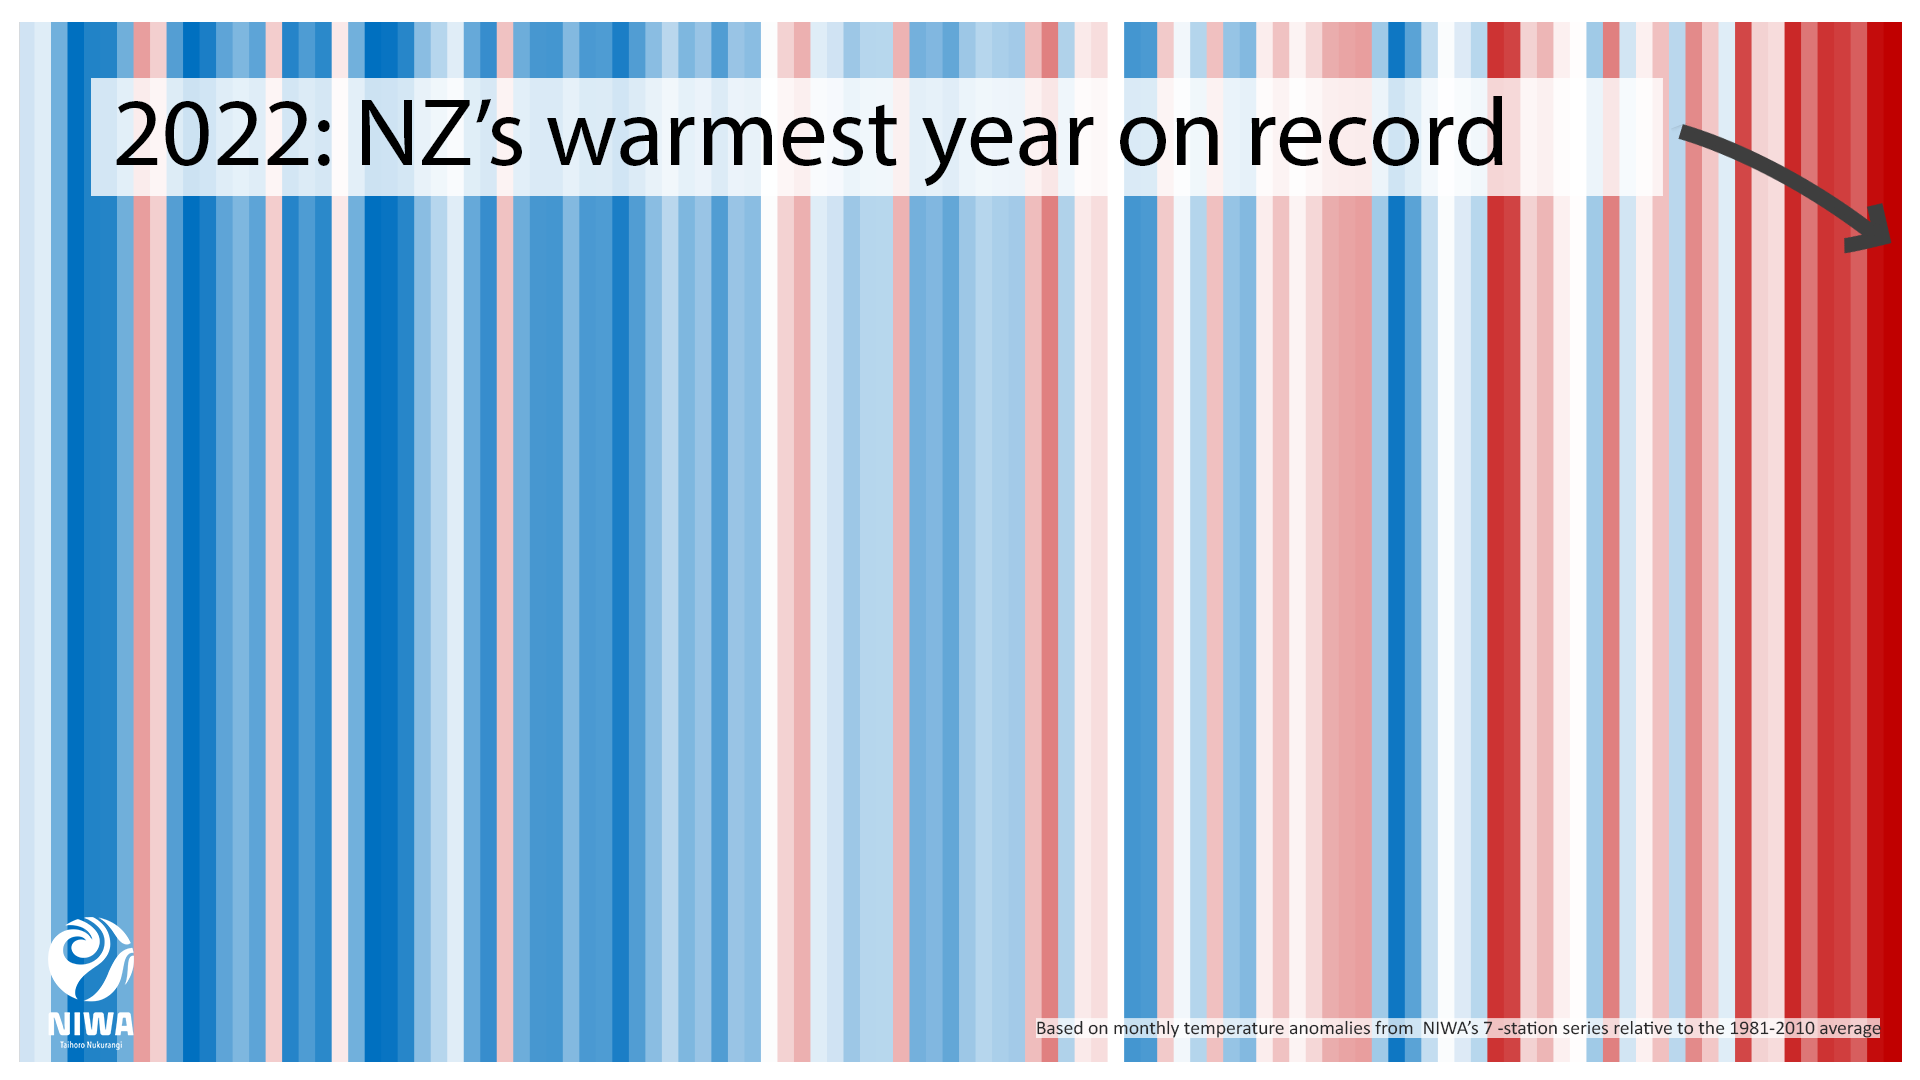
2022: New Zealand’s warmest year on record, again.
|
Temperature |
Annual temperatures were above average (+0.51°C to +1.20°C above the annual average) or well above average (>1.20˘C above the annual average) for much of Aotearoa New Zealand. Near normal (within -0.50°C to +0.50°C of average) temperatures occurred in pockets around the eastern South Island, and also parts of Marlborough and Nelson. 2022 was Aotearoa New Zealand’s warmest year on record, based on NIWA’s seven station series which began in 1909. |
|
Rainfall |
Rainfall was above normal (120-149% of annual normal) or well above normal (>150% of annual normal) for parts of Northland, Tauranga, Gisborne, the Central Plateau, southern Taranaki, parts of Manawatū-Whanganui, much of Wellington, Nelson, northern Marlborough, parts of Tasman, the West Coast near Westport, and pockets of Canterbury. Rainfall was below normal (50-79% of annual normal) for pockets of Southland and Dunedin. The majority of the country experienced near normal rainfall (80-119% of annual normal). 2022 was the New Zealand’s 8th most unusually wet year on record, based on an analysis of NIWA’s Virtual Climate Station Network dating back to 1960. |
|
Soil moisture |
Below normal soil moisture levels occurred during January, leading to widespread abnormally dry conditions and areas of meteorological drought. Soils became wetter than normal during February across most of the country except Southland. Below normal soil moisture then redeveloped in Waikato and across large parts of the South Island during autumn. Above normal soil moisture levels developed for the vast majority of the country during winter. Soil moisture remained relatively high for the North Island during spring and into summer, but trended below normal in the South Island. At the end of December, soil moisture levels were higher than normal in eastern Northland, Auckland, Bay of Plenty, parts of Hawke’s Bay, southern Taranaki, parts of Manawatū-Whanganui, southern Wellington, and pockets of Canterbury; drier than normal soils occurred in the western and southern South Island, Nelson, much of Marlborough, Banks Peninsula, and were near normal elsewhere. |
|
Sunshine |
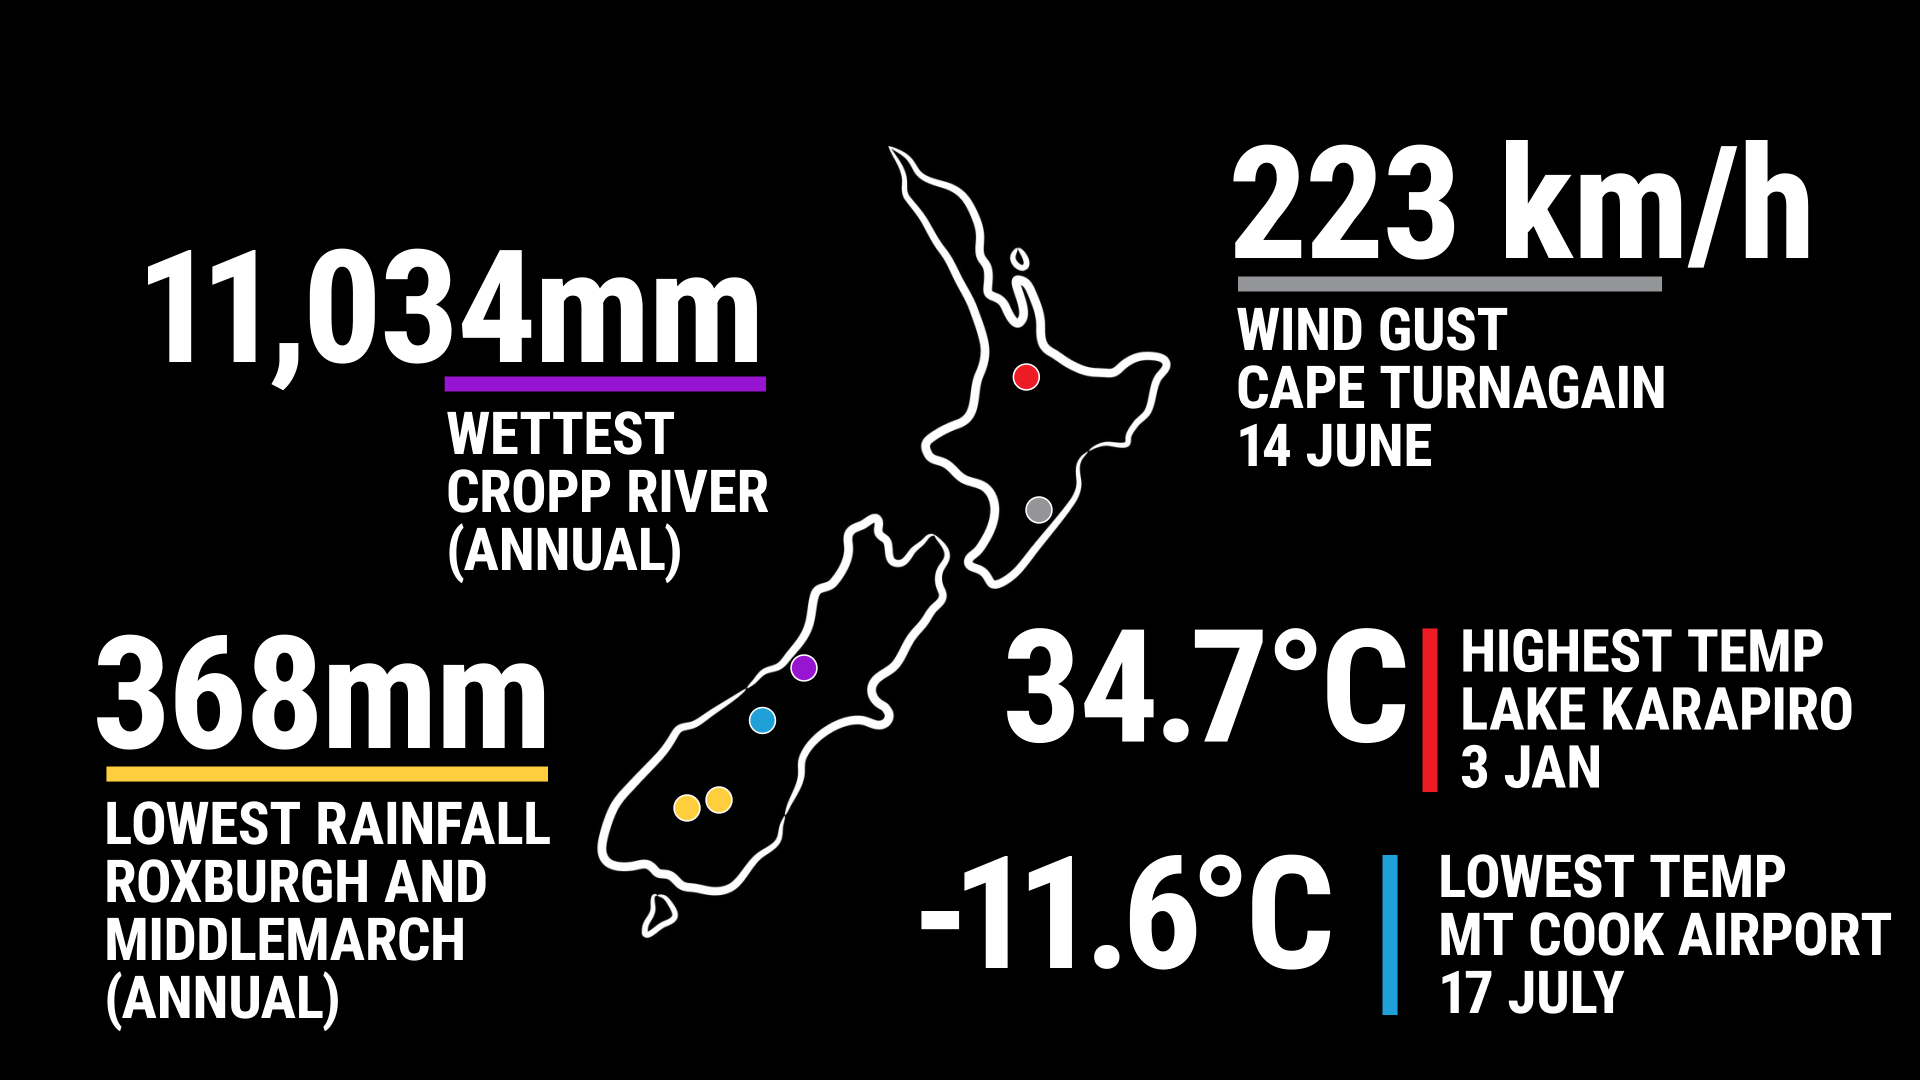
The wider Taranaki region experienced New Zealand’s highest annual sunshine total during 2022 (2659 hours recorded at New Plymouth). |
Overview
2022 was Aotearoa New Zealand’s warmest year on record, surpassing the record set just last year (Figure 1,Figure 2a). The nationwide average temperature for 2022 calculated using stations in NIWA’s seven-station series was 13.76˚C, being +1.15˚C above the 1981-2010 annual average, surpassing 2021 by +0.20˚C. The top-4 warmest years on record have now all occurred since 2016, a trend that is consistent with climate change. It was also the warmest year on record in terms of maximum temperatures (+1.08˚C above average) and minimum temperatures (+1.22˚C above average). The previous record warmest year in all cases was 2021.
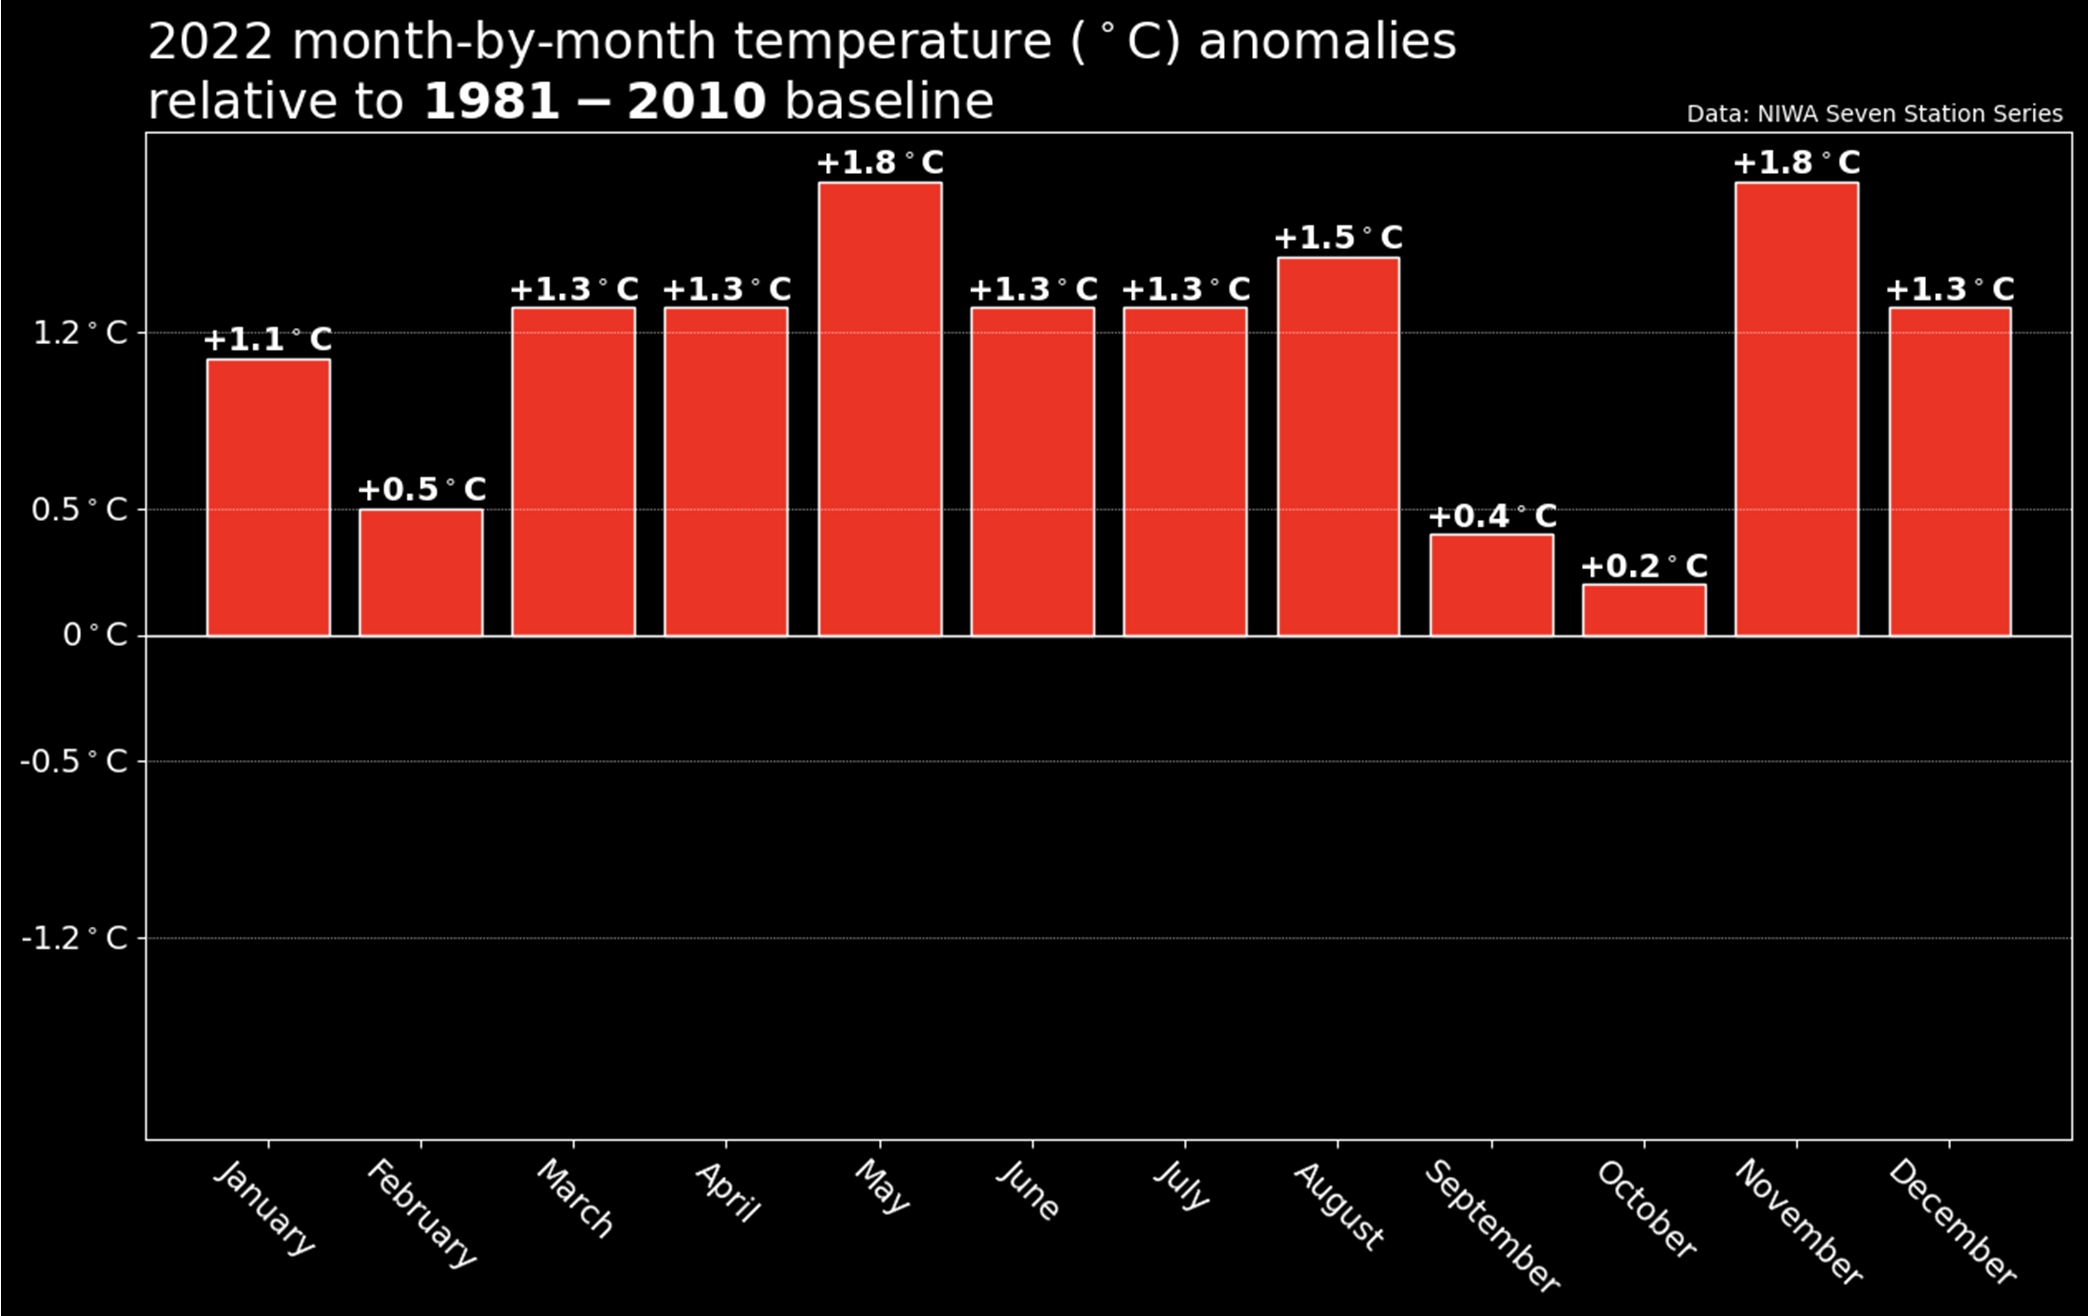
Data from NIWA’s seven-station series also shows that no months in 2022 were below average (more than 0.50°C below than the monthly average), and ten out of twelve months were above average (+0.51°C to +1.20°C above the monthly average) or well above average (>1.20˘C above the monthly average), visualised in Figure 3. The most unusually warm month was November at +1.6˘C above average and the most unusually cool month was October, which despite featuring a significant cold spell with near sea-level snow at the beginning of the month, was still +0.2˘C compared to the long-term October average.
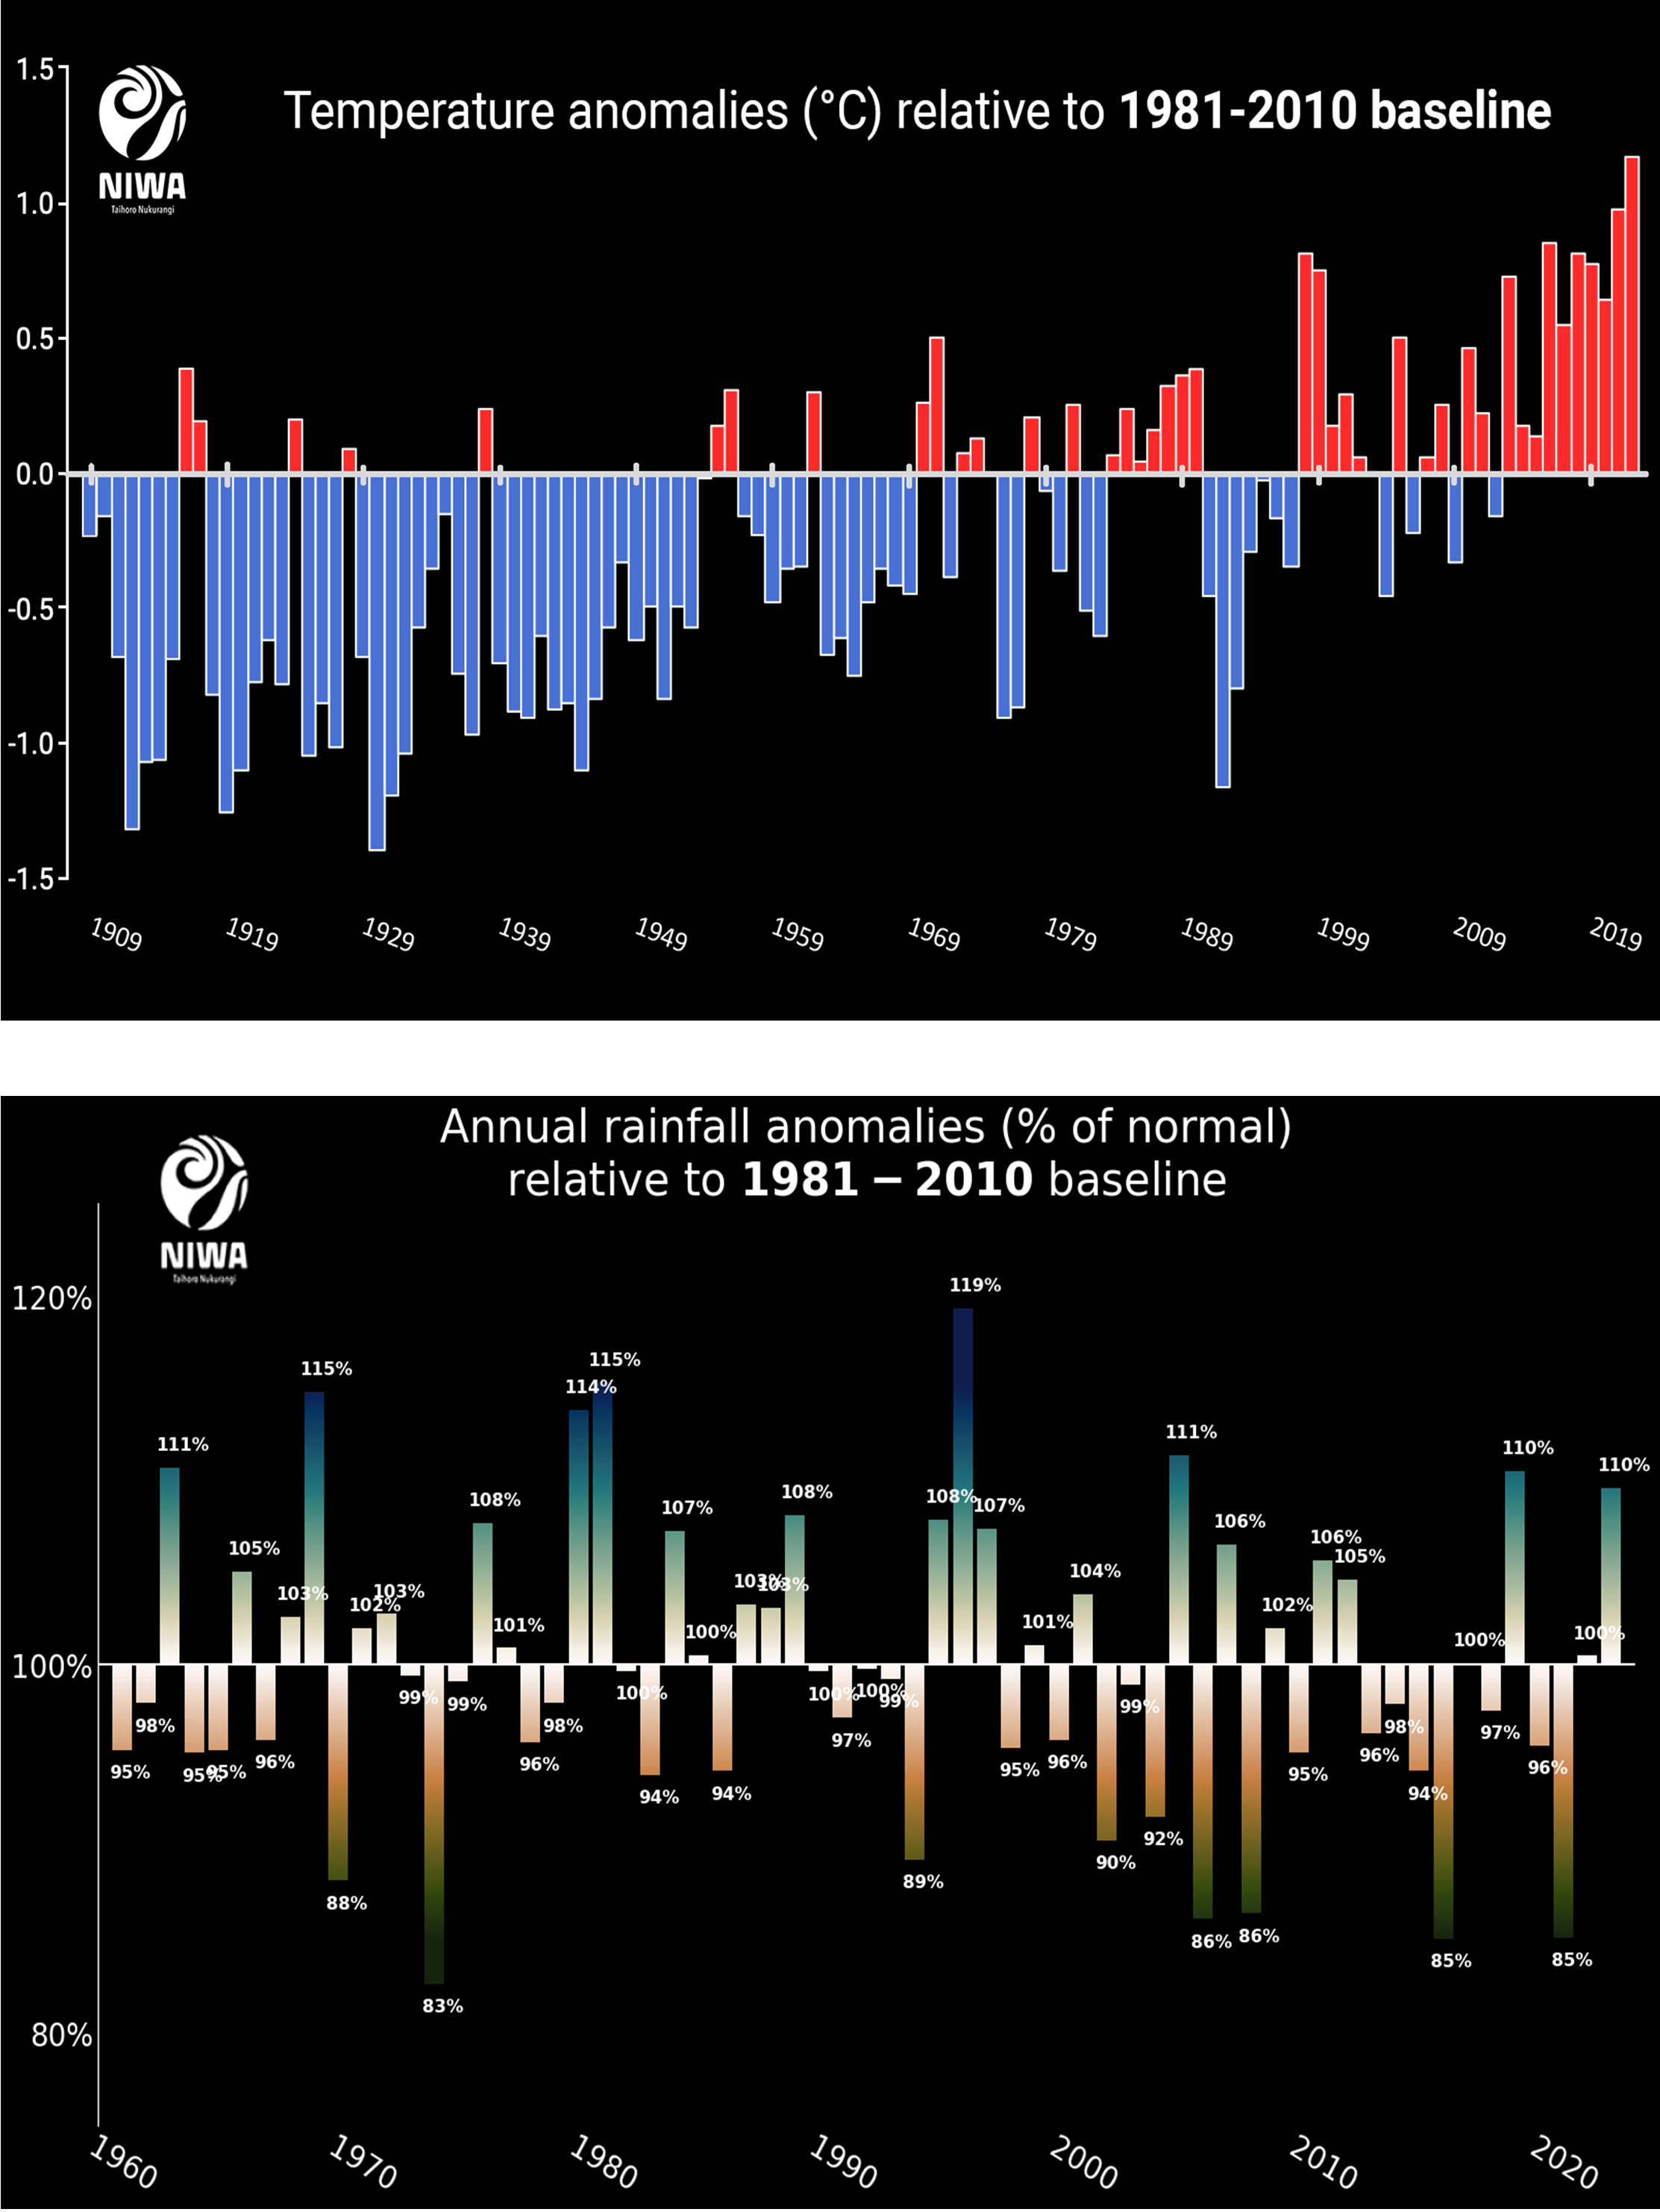
2022 was also New Zealand’s 8th most unusually wet year on record, based on an analysis of NIWA’s Virtual Climate Station Network which goes back to 1960 (Figure 2b). It was the most unusually wet year since 2018. The nation wide area-averaged rainfall anomaly during 2022 was 110%.
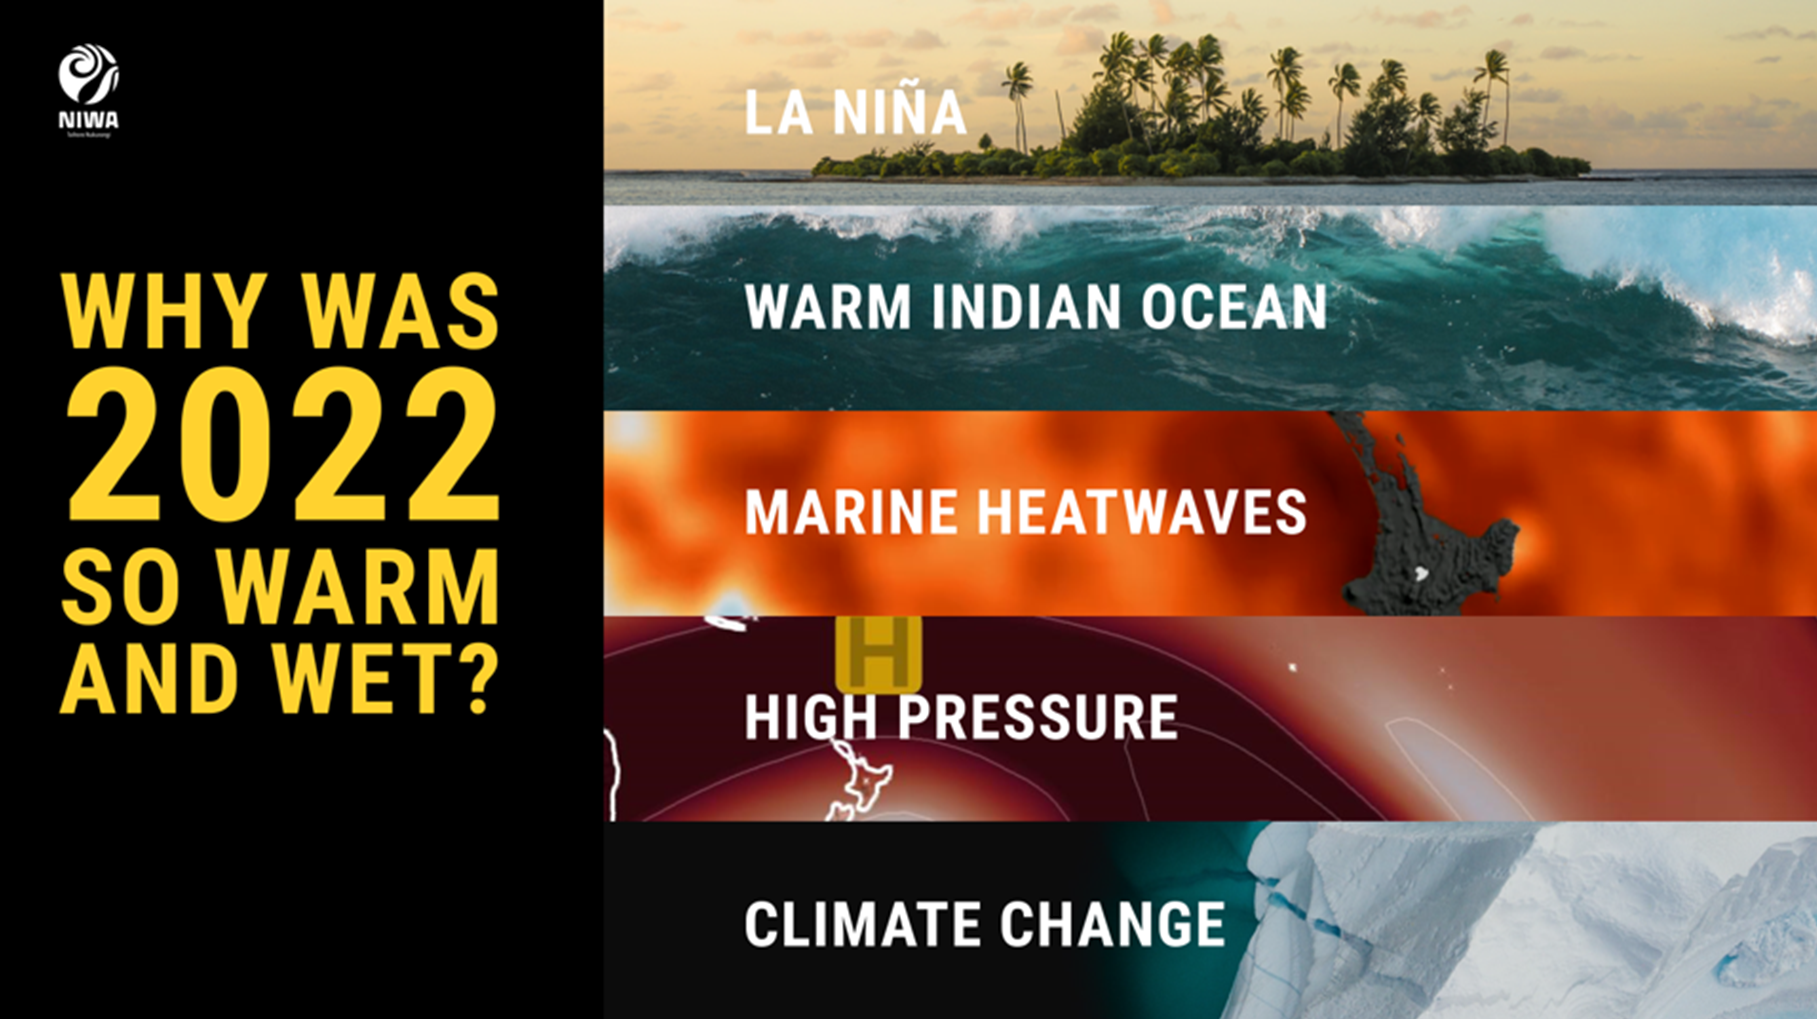
There were a myriad of climate drivers that contributed to the unusual warmth and wetness (Figure 4) in 2022. The primary driver was La Niña, marked by cooler than average ocean temperatures in the central and eastern equatorial Pacific. La Niña influences atmospheric circulation patterns in the Pacific Ocean and has flow-on effects to climate across the globe. Both 2022 and 2021 were La Niña years and are ranked 1st and 2nd warmest years on record for New Zealand.
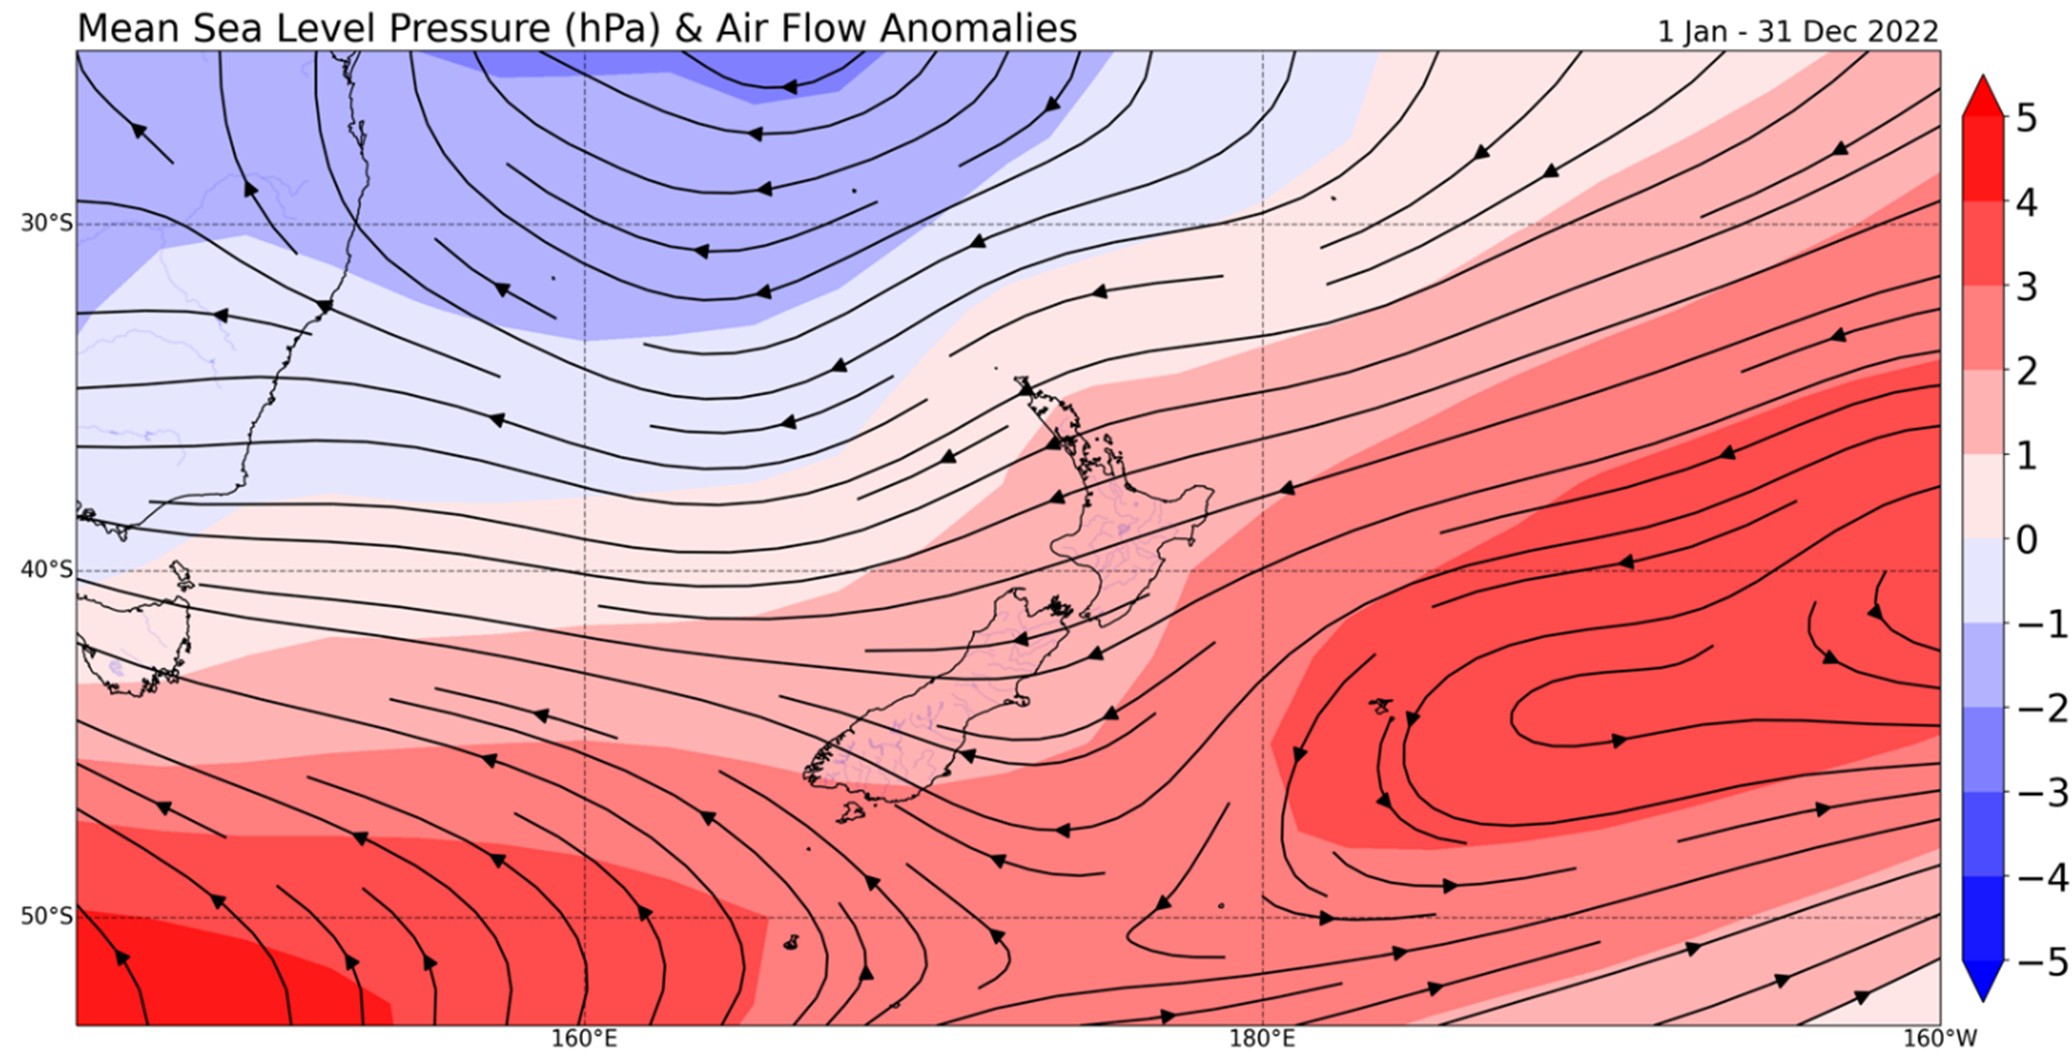
2022 was the third consecutive year of La Niña, known as a “triple dip”, an uncommon occurrence that last happened in 1998-2000. For New Zealand, La Niña tends to be associated with higher-than-normal air pressure near and to the east of the country with lower pressures to the north. This pressure setup causes more sub-tropical, northeasterly winds than normal, driving up air and sea temperatures. Figure 5 shows how the average mean sea level pressure was higher than normal (red shading) across the New Zealand region for the year as a whole, with the arrows (vectors) showing the air flow anomaly.
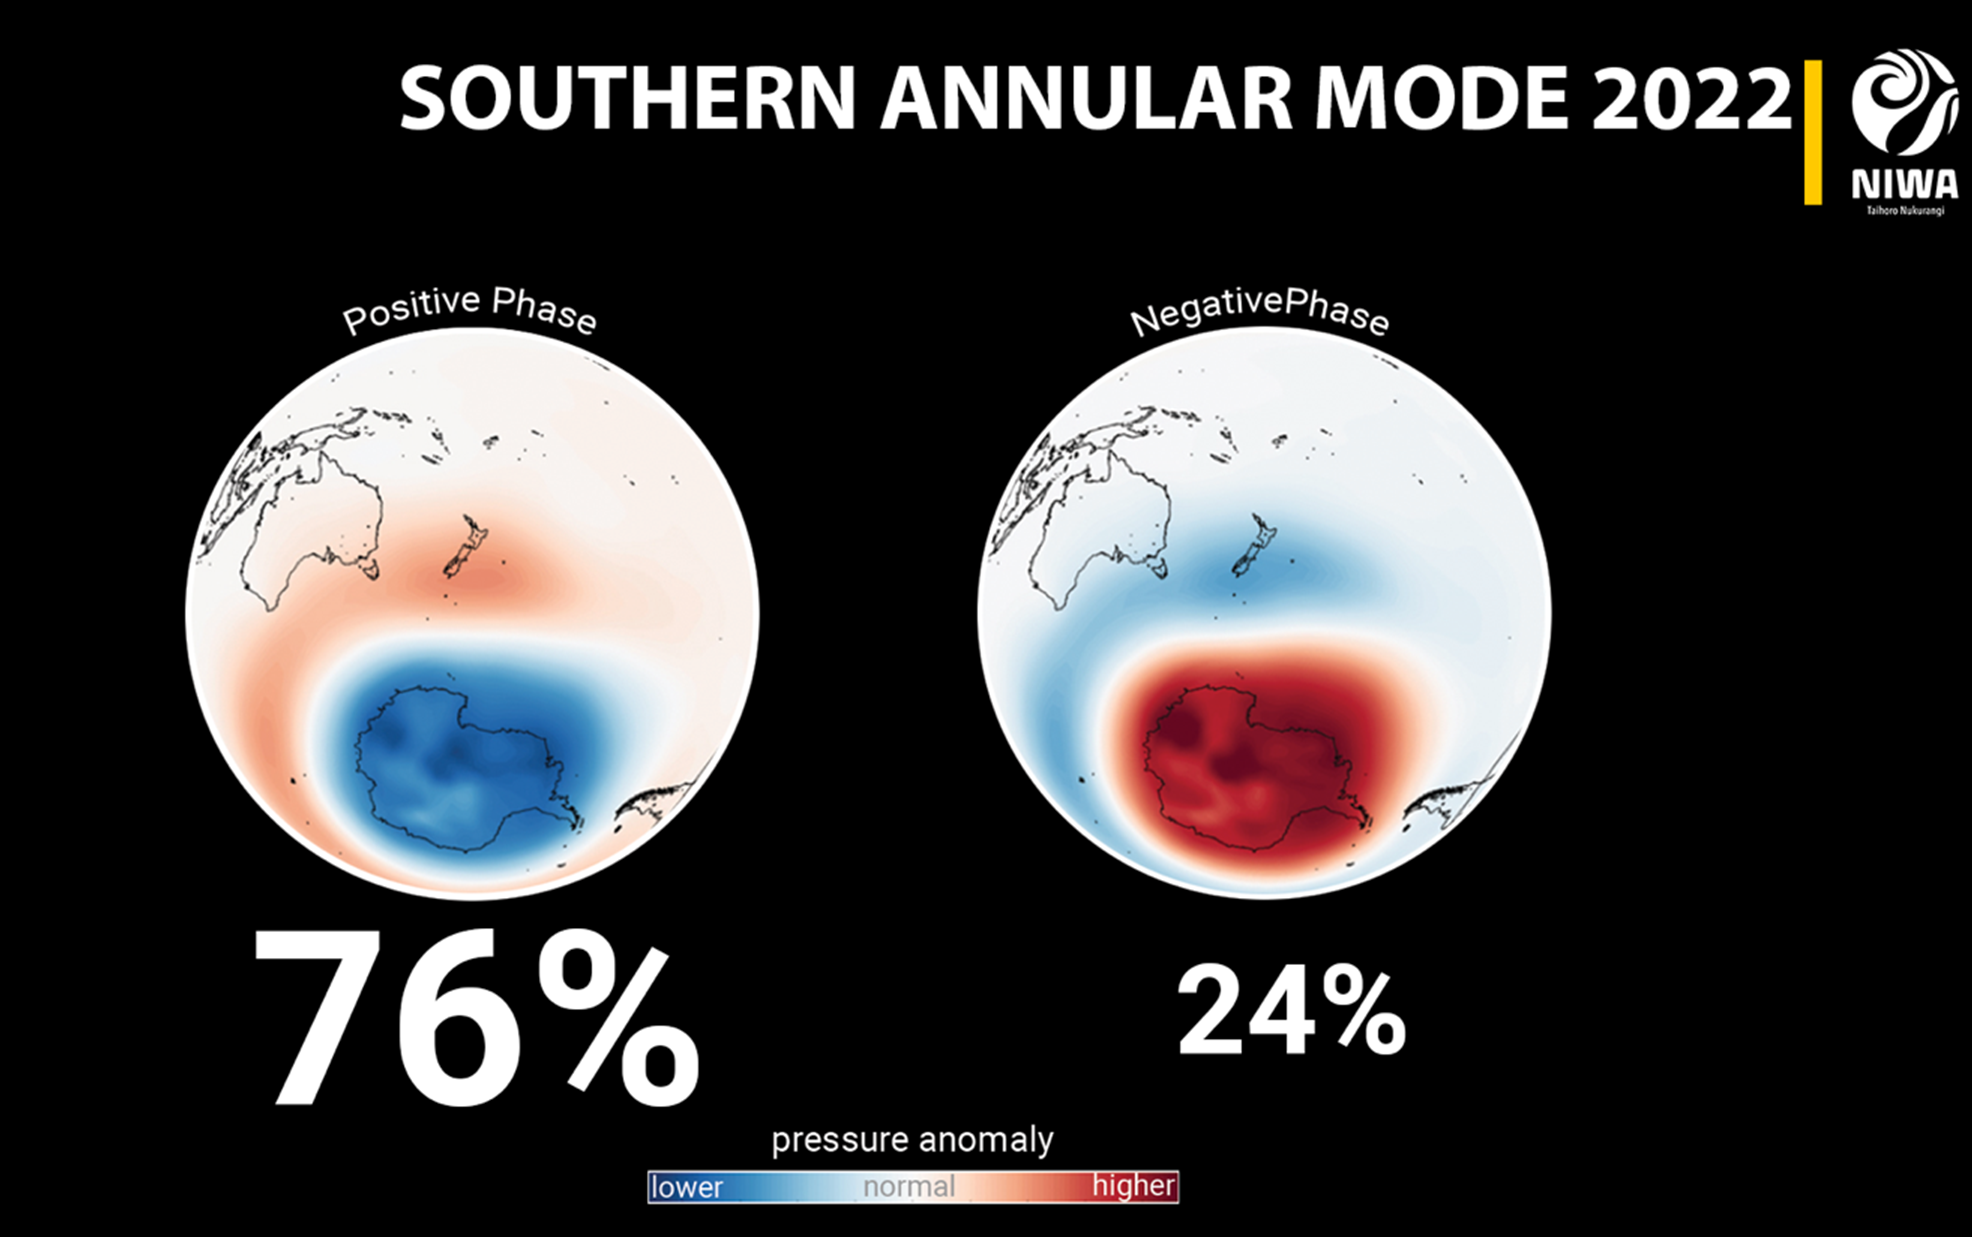
Another mode of variability, called the Southern Annular Mode (SAM), is a proxy for measuring the strength and position of the belt of westerly winds that encircle the Southern Ocean and bring storms to New Zealand. The SAM was positive 76.2% of the time in 2022, the highest annual percentage since at least 1979. A positive SAM is associated with higher-than-normal pressures over the New Zealand region, as shown by the schematic in Figure 6. The SAM has exhibited a trend toward the positive phase over the last 40 years which is consistent with climate change.
In the Indian Ocean, a sea surface temperature seesaw known as the negative phase of the Indian Ocean Dipole (IOD) developed during winter and continued through spring. This feature, marked by warmer (cooler) than average seas in the eastern (western) tropical Indian Ocean, was associated with above normal atmospheric moisture across the wider Australasia region. This extra moisture which was picked up and transported into New Zealand by mid-latitude low pressure systems and fronts.
Since New Zealand is an island nation, coastal sea surface temperatures (SSTs) have an important influence on weather conditions. Warmer than average SSTs can drive up humidity, lead to persistently above average air temperatures, especially near the coast, and contribute more moisture to approaching low pressure systems. During 2022, coastal SSTs were above or well above average every month, with December, November, and January ranking as the top three most unusually warm months. This culminated in a marine heatwave (MHW) event, or unusually warm ocean temperatures over thousands of kilometres, that lasted much of the year. MHW conditions were most persistent in Northland, Auckland, Waikato, Bay of Plenty, Taranaki, Tasman, West Coast, and Southland.
The presence of warmer-than-average regional SSTs, along with La Niña conditions and the negative IOD, were the primary natural reasons why New Zealand experienced warm and wet conditions through much of the year. Climate change continues to influence New Zealand’s long-term temperature trend, which is increasing at a rate of approximately 1.17˘C (± 0.2˘C) per century according to NIWA’s seven-station series.
Starting with January, abnormal dryness developed right across the country, along with pockets of meteorological drought - 16 locations experienced their driest January on record. This was coupled with unusual warmth as the January national temperature was +1.1 ˘C above average. Drought-breaking rain then arrived during February with a series of extreme rainfall events, including several landfalling atmospheric rivers (ARs) for the North Island and South Island, and ex-tropical cyclone (ex-TC) Dovi making landfall in the North Island. However, this rain missed much of Southland, where dryness and drought persisted.
Into autumn, dryness took over again for much of the country as warmth persisted, driven by warmer-than-average sea surface temperatures (SSTs) and a waning La Niña. However, a significant heavy rain event brought record-breaking rain to Auckland and flooding to parts of the upper North Island and the Gisborne area late in March. Additionally, rain was above normal in the lower South Island during April, alleviating the long-standing dryness. Autumn as a whole was the equal 2nd warmest autumn on record (since at least 1909).
Winter was the wettest and warmest winter on record. The most notable event of the season took place in August, when the 2nd strongest landfalling AR during winter since at least 1950 occurred in the middle part of the month. This AR event caused widespread flooding across the top of the South Island, Nelson in particular, triggering a state of emergency. It was responsible for generating the highest daily rainfall total of the year when 692 mm was recorded at North Egmont on 18 August. June also saw several significant thunderstorm outbreaks, some of which generated tornadoes and hail. The warm, wet conditions caused variable snow conditions for the South Island ski fields; measurements at Mueller Hut (Aoraki/Mt Cook National Park) saw the deepest snowpack on record (since 2010) in mid-July, just prior to a large rain-on-snow event that caused avalanching and flooding throughout the region. In the North Island, the warmer and frequently humid conditions resulted in extremely poor snow coverage for ski fields.
Notable winter-like cold snaps carried on into spring, particularly during the early parts of both September and October. During 5-6 October, snow fell to around 100 metres in the South Island and around 200-300 metres in the North Island. Above average warmth, owing to warmer seas and La Niña, occurred outside of these cold snaps resulting in near average nationwide spring temperatures. The warmth and wetness ramped up again in November, with frequent thunderstorm outbreaks for parts of the South Island and the North Island. It was the warmest November on record for the country.
The wet weather persisted into December, but eased in time for the holiday period, bringing a settled end to the year. Unusually warm conditions lingered, ranking as the 10th warmest December on record.