The year 2016: New Zealand’s warmest on record!
|
Temperature |
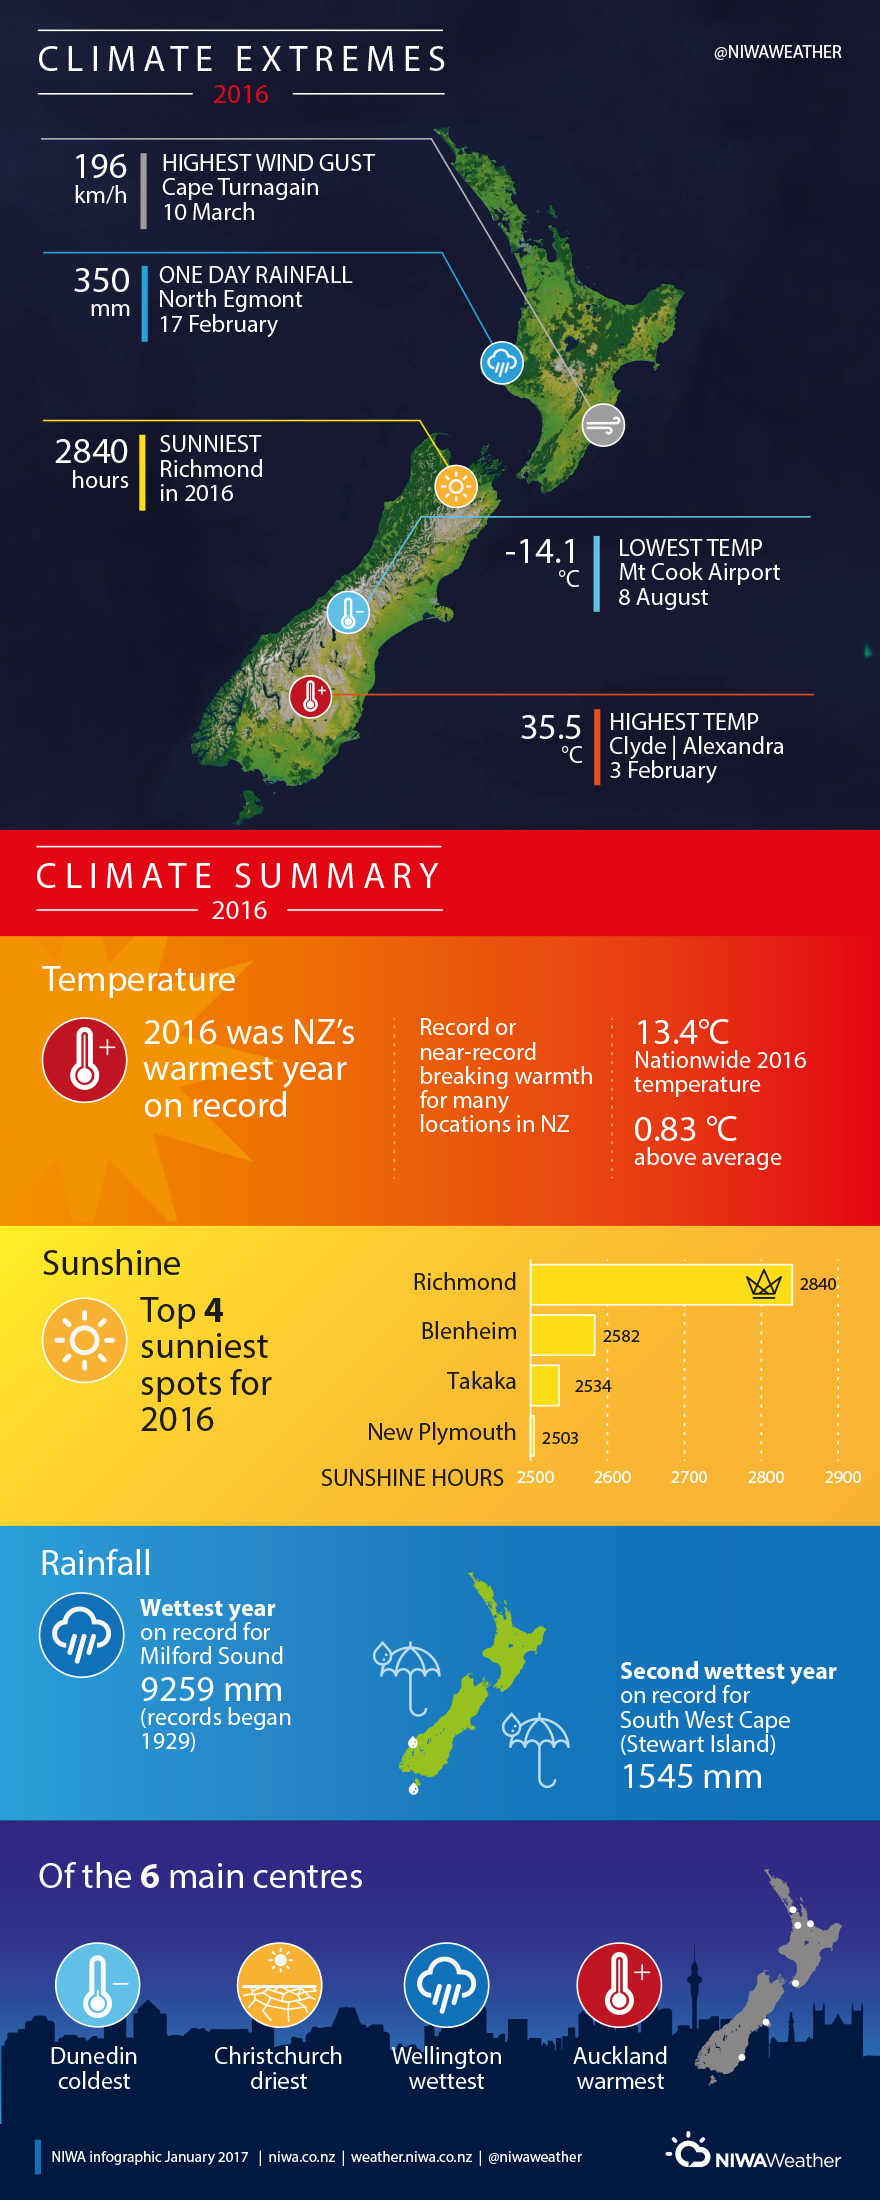
Annual temperatures were above average (0.51°C to 1.20°C above the annual average) throughout the country, with very few locations observing near average temperatures (within 0.5°C of the annual average) or lower. The year 2016 was the warmest on record for New Zealand, based on NIWA’s seven-station series which begins in 1909. |
|
Rainfall |
Yearly rainfall in 2016 was above normal (120-149% of the annual normal) for parts of Kapiti Coast, Tasman, West Coast and Fiordland. In contrast, rainfall was below normal (50-79% of the annual normal) in parts of the eastern North Island south of Napier, and parts of the eastern South Island north of Christchurch. Rainfall was near normal (within 20% of the annual normal) for the remainder of New Zealand. |
|
Soil moisture |
Below normal soil moisture levels prevailed in eastern parts of north Canterbury and eastern parts of the Wairarapa for much of the year. By the end of April, soil moisture levels were below normal for the time of year for eastern and inland parts of the South Island, and extensive parts of the North Island. Abundant November rainfall contributed to soil moisture levels that were above normal for the time of year in Bay of Plenty, Wellington, Tasman, Nelson, Marlborough, Otago and Southland. |
|
Sunshine |
Annual sunshine was predominantly near normal (90-109% of the annual normal) throughout New Zealand, although small sections of the country observed above average sunshine (110-125% of the annual normal). Richmond experienced New Zealand’s highest annual sunshine total on record. Sunshine was below normal (75-89% of the annual normal) in parts of Bay of Plenty. |
Overview
Overall, annual mean sea level pressures for 2016 were lower than normal to the southwest of New Zealand and slightly higher than normal to the east of the North Island. This pressure set-up produced more northerlies and northwesterlies than normal over the country, which contributed to the exceptional warmth experienced in New Zealand during the year. In addition, sea surface temperatures both surrounding and west of New Zealand were typically higher than normal, particularly from January to July. These warmer than normal sea surface temperatures enhanced the favourable conditions for warmer than average air temperatures to occur in New Zealand.
El Niño Southern Oscillation (ENSO)
El Niño Southern Oscillation (ENSO)-positive conditions were present at the beginning of the year, although the strong El Niño event weakened rapidly from February, and ENSO-neutral conditions prevailed by May.
Temperatures
Temperature-wise, 2016 as a whole was above average (0.51°C to 1.20°C above the annual average[1][1]) throughout the country. These temperature anomalies were especially high in Northland, Auckland, Bay of Plenty, Hawke’s Bay, Whanganui, Manawatu, Kapiti Coast, Wellington, West Coast, Otago and Southland. Near average temperatures (within 0.5°C of the annual average) were observed in only a few locations including parts of Tasman and south Otago, Timaru and Oamaru. No locations observed below average temperatures (0.51°C to 1.20°C below the annual average).
The first seven months of the year from January to July were remarkably warm, with the nation-wide average temperature higher than average for each month, respectively. The three warmest months in 2016 in terms of the seven-station temperature series were February (2.2°C above average), May (2.1°C above average) and June (1.6°C above average). Notably, these months were New Zealand’s warmest May, second-warmest February and third-warmest June on record. August (0.5°C below average) and December (0.3°C below average) were the only two months in 2016 when New Zealand’s nation-wide average temperature was cooler than average. The nation-wide average temperature for 2016 was 13.4°C (0.8°C above the 1981–2010 annual average), using NIWA’s seven-station temperature series which begins in 1909. 2016 was the warmest year since 1909, based on this seven-station series, and surpassed New Zealand’s previous warmest year on record which occurred in 1998.
Rainfall
As a whole, annual rainfall totals for 2016 were near normal (within 20% of the annual normal) for much of the country. However, annual rainfall totals were above normal (120-149% of the annual normal) for parts of Kapiti Coast, Tasman, West Coast and Fiordland. It was an especially wet year in Milford Sound which observed its wettest year on record (9259mm, 138% of the annual normal). In contrast, rainfall was below normal (50-79% of the annual normal) in parts of the eastern North Island south of Napier, and parts of the eastern South Island north of Christchurch. No locations observed record or near-record low annual rainfall totals.
The below average annual rainfall for some eastern parts of New Zealand was reflected in soil moisture levels during the year. Below normal soil moisture levels prevailed in eastern parts of north Canterbury and eastern parts of the Wairarapa for much of the year. By the end of April, soil moisture levels were below normal for the time of year for eastern and inland parts of the South Island, and extensive parts of the North Island. In June 2016, the drought classification for the east coast of the South Island was extended until the end of December 2016; the drought had been officially declared on 12 February 2015. Abundant November rainfall contributed to soil moisture levels that were above normal for the time of year in Bay of Plenty, Wellington, Tasman, Nelson, Marlborough, Otago and Southland. By the end of December, soil moisture levels were below normal for the time of year for much of the North Island. Soils were slightly drier than normal about Otago and Southland, with near normal soil moisture levels for the remainder of the South Island.
[1][1] Note all temperature, rainfall and sunshine anomalies reported in this document are relative to the 1981-2010 average/normal.
Download
Download the 2016 New Zealand Annual Climate Summary [PDF 1.66MB]
Download the 2016 Annual Climate Summary as an infographic [PDF 200KB]