Reducing your vehicle’s emissions may not be enough to protect your own health. Ian Longley describes new research that’s getting a fix on personal levels of exposure to air pollution.
PDF of this article (185 KB)


There’s a lot of discussion these days about vehicle emissions, and lots of data helping us to compare one car with another. But, what about your exposure to those emissions? Is the air inside a modern hybrid that’s stuck behind a smoky old banger clean or polluted? Do cyclists breathe in more or less exhaust fumes than drivers? Is riding the train a healthier option?
Most of us in New Zealand experience air pollution in a couple of ways: the pungent smell of woodsmoke on a winter’s night and, especially in our larger cities, the foul sniff of traffic exhaust. While woodsmoke may be more noticeable,international research increasingly points the finger at traffic pollution as the more insidious contaminant. This complex cocktail of gases and particles is largely invisible, but there is increasing evidence linking exposure to vehicle emissions with illnesses such as asthma in infants and heart attacks in the elderly. New Zealand has among the world’s highest rates of both childhood asthma and car ownership. Coincidence?
In order to determine how big a threat traffic fumes are to our health, we need to understand why some people suffer from the effects of these emissions while others don’t. Are sufferers from respiratory disease exposed to more of the stuff than the rest of us? Who unwittingly exposes themselves more to this risk factor for cancer, pulmonary, and heart disease? Is it where we live, or how or when we travel that matters? These are some of the questions we’re tackling in collaborative projects with several agencies and universities.
Getting a move on
In most major cities, air quality is conventionally monitored at permanent stations. Auckland, for example, has more than ten sites, including one at NIWA’s former offices on busy Khyber Pass Road in Newmarket. However, from the perspective of understanding the causes and effects of pollution-related illness, this stationary monitoring suffersfrom a couple of weaknesses: people do not spend their whole lives at a single location, and pollution levels vary enormously from one street to another, even within a few metres. These stations monitor levels of pollution, but not people’s exposure to it.
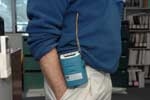
Conventional air quality instruments are not portable and are housed in an air-conditioned shed. They do a great job of monitoring emissions, but only for a relatively small area. However, with the parallel development of miniaturised instruments and computing (such as palmtop computers), a person can now carry a monitoring station in a backpack, and NIWA has made a substantial investment in developing this capability.
Initial studies in Auckland
In order to better understand how pollutant emissions (and which emissions in particular) are linked to illness, NIWA’s Air Quality and Health team have launched a major effort to observe and describe the exposure of New Zealanders to air pollution – to find out the who, where, and when, with a particular focus on traffic emissions. A pilot study in 2007 confirmed findings from overseas research that pollutant levels inside cars can be substantially higher than those recorded at fixed monitoring stations. In our pilot study, we recorded remarkably high levels of fine particles on certain kinds of diesel trains.
This past September we conducted a feasibility study in which volunteer students carried personal pollution monitors and GPS receivers while involved in ordinary activities that exposed them to traffic: walking, riding in cars and buses, and visiting car parks, street cafes, and shopping centres. Twice-daily blood sampling revealed rises in carbon monoxide dissolved in the blood which could be related to their daily exposure record. We’ll use the results of this study to provide biological validation for future non-invasive techniques which will let us link emission levels to real effects in the body.
These studies have shown that the transport choices we make – whether we drive or find some other mode of transport – might be our most important everyday decisions in terms of determining our exposure to air pollution. This summer we’ll begin a pilot study comparing exposures of commuters travelling in Christchurch by car, bus, and bicycle. Follow-up campaigns in Auckland will also compare commuting journeys from New Lynn to Auckland CBD, including by train.
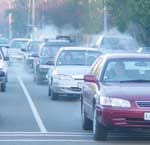
So far, these projects have suggested that some of Auckland’s highest traffic pollution levels can be found inside vehicles – not because of the vehicle’s own emissions, but because of the emissions from the vehicles in front of it. Like passive smoking, it seems we’re all responsible for each other’s exposure as much as our own.
Watch this space
By the end of 2009, we aim to combine these observations with others in the home and workplace to build up a general picture of how the exposure to air pollution of real (and mobile) New Zealanders differs from what a monitor fixed to the ground will report. Over subsequent years we’re committed to investigating what our results will mean for health research, public health policy, and the future of air quality management, so that the risk to your health can be identified, understood, and reduced.
Looking for the links
- Vehicle emissions are being linked with illnesses ranging from infant asthma to cancer and heart disease.
- New technology permits portable air quality monitoring so that exposure to emissions can be measured at a personal level.
- A suite of projects will investigate our emissions exposure at several New Zealand cities and look for correlations in public health statistics.
Dr Ian Longley works in NIWA’s Air Quality and Health team, based in Auckland. He is a specialist in the composition of the urban atmosphere, pollution exposure, and health.
The projects described in this article are funded by the Health Research Council (HRC), the New Zealand Transport Agency (NZTA), the Foundation for Research, Science and Technology (FRST), and NIWA. Some of this work is conducted in collaboration with Dr Simon Kingham (University of Canterbury), and Dr Kim Dirks and Dr Jenny Salmond (University of Auckland).
Teachers’ resource for NCEA Achievement Standards or Unit Standards: Geography Level 1 AS90207, Level 2 AS90336, Level 3 AS90706 Science Level 2 US6352, Level 3 US6355
