-
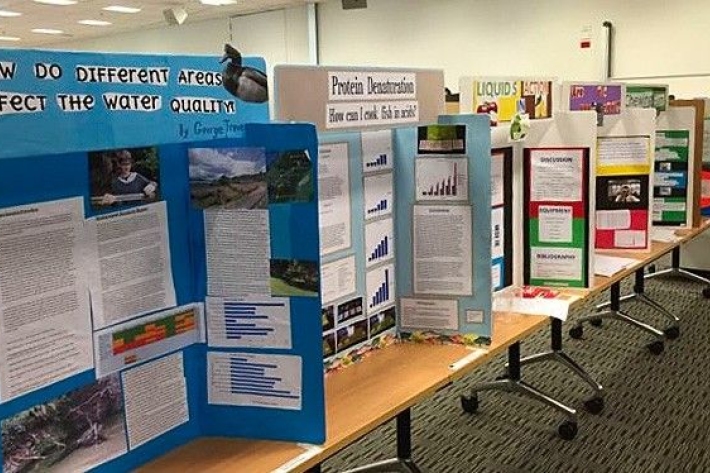
Science and Technology Fairs
NIWA is a major sponsor of the Auckland, Manukau City, North Harbour, Waikato, Wellington, Canterbury and Bay of Plenty – Science & Technology Fairs. -

Weather plots: temperature and relative humidity
Objective: to observe the relationship between temperature and relative humidity. -
Cloud Imagery
On this page
NZ Region Cloud Analysis Australasian Region Infrared Hemispheric Infrared NZ High-res Visible Contact
All transmissions from GMS-5 are no longer received at NIWA’s satellite reception station in Wellington. We are working on an alternative data feed and will be able to bring back these images later this year. Once we start receiving data again, it will then be calibrated, re-mapped onto standard map projections, and archived. -
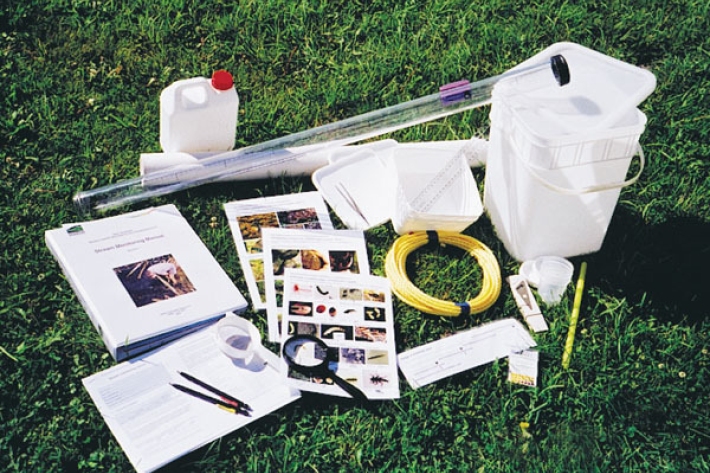
Stream Health Monitoring and Assessment Kit
ServiceHow healthy is your stream? SHMAK - the New Zealand Stream Health Monitoring and Assessment Kit - has been designed to help you find out. -
Mussels: more, fresher, better
Feature story06 June 2017The seafood counter at your local supermarket has changed. -
Toitoi
One of the most common species of freshwater fish in Aotearoa is the common bully or toitoi. -
Standardised Precipitation Index (SPI)
The Standardised Precipitation Index (SPI) is a simple measure of drought (and also of very wet conditions) and is based solely on the accumulated precipitation for a given time period. -
Impacts of water dams
What are the impacts of water dams on water quality and mahinga kai? -

Multibeam swath system
Hull-mounted on the RV Tangaroa, the EM302 multibeam echosounder maps the seafloor using a fan of 288 acoustic beams, producing up to 864 soundings per ping in dual swath mode, providing 100% coverage of the seabed. -
New Zealand's Marine Realm
News article06 June 2017NIWA has transformed 1.5 million square kilometres of data into the most accurate and detailed map yet of the land underneath the sea around New Zealand.