-

Graphing with Microsoft Excel
How do I create a graph?
Using Microsoft® Excel is easy because the Chart Wizard does all the work for you!
Simply enter the data for your data table.
Highlight the cells you want to graph.
Click on the Chart Wizard icon on the Tool Bar.
Select the chart type you want to use and click Next.
Click Next to confirm the range of cells.
Give your graph a title, label x- and y-axis and click Next.
Click on the gridlines tab to remove or add gridlines.
Click Finish and graph is complete!
Help, my graph is too small!
When the chart wizard creates your graph it will probably be too smal -
Kōaro
Kōaro are excellent climbers and like clear, swiftly flowing, forested streams. -
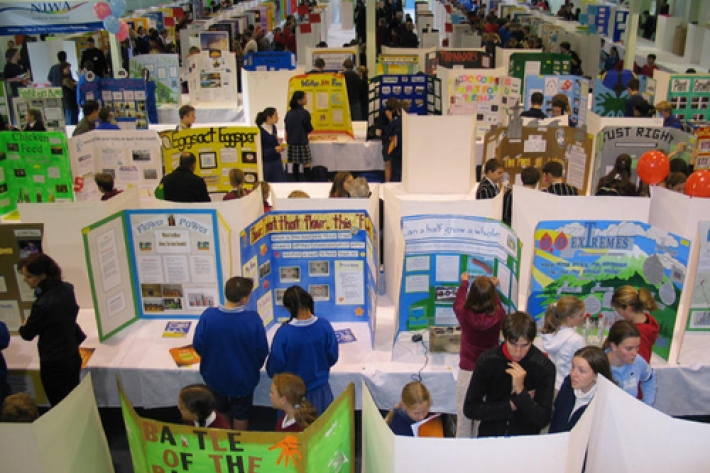
Working with schools
We sponsor regional science and technology fairs around New Zealand and support learning programmes that bring science into the classroom. -
Map I South
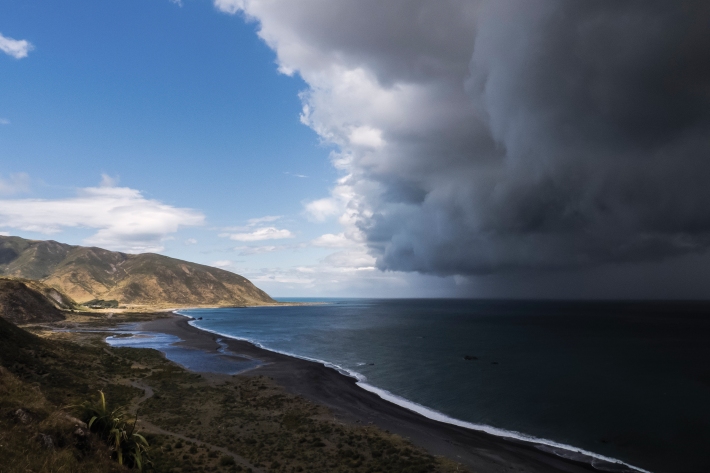
Education ResourceThe climate of this zone is largely dependent on the lie of the Southern Alps to the west, but many areas are also sheltered by high country to the south and east. -
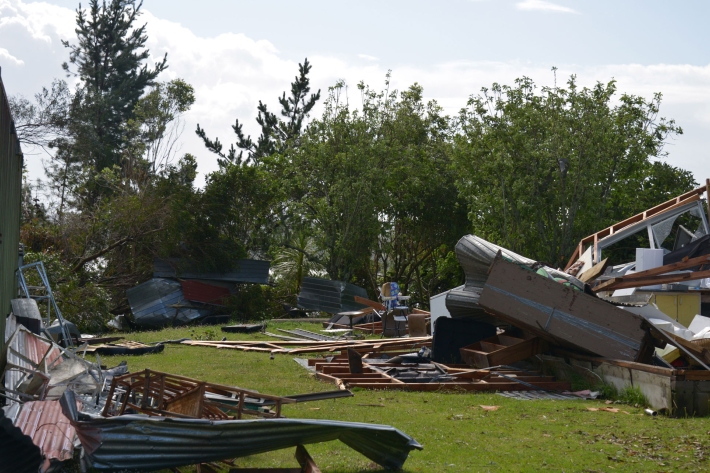
Extreme weather - winds and tornadoes
Education ResourceDue to its position in the 'Roaring Forties', a belt of strong winds in the Southern Hemisphere which generally occur between the latitudes of 40 and 49 degrees, as well as its small size, New Zealand is a windy country. -
Scholarships
Scholarships available to both Masters and undergraduate students in the fields of fisheries science and marine biology. -
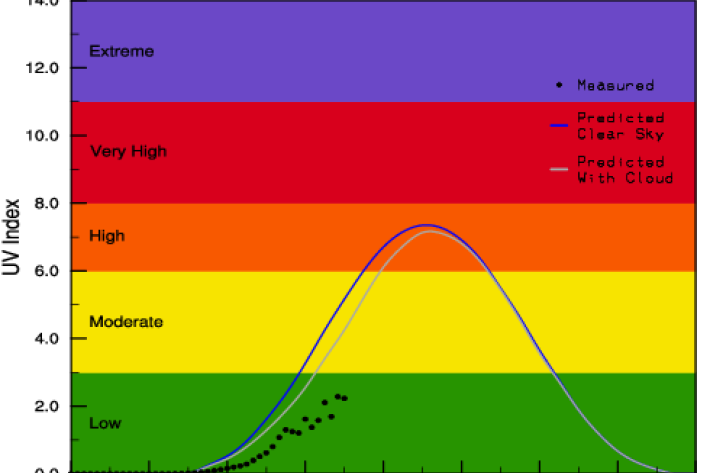
Daily climate maps
These climate maps are updated daily and are based on data from our National Climate Database. -
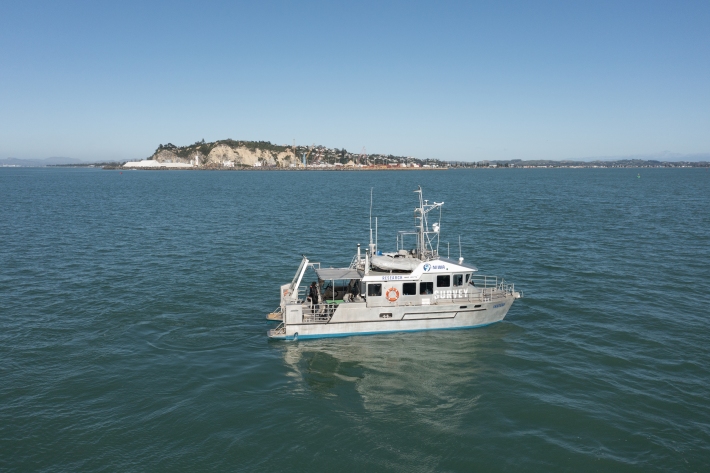
RV Ikatere
FacilityA versatile inshore vessel, RV Ikatere is equipped with high-precision multibeam and sub-bottom profiler transducers for surveying and mapping the seabed. -
Common climate and weather terms
Education ResourceConfused about El Niño, or can't tell the difference between an Anticyclone and an Isobar? Let us help. -
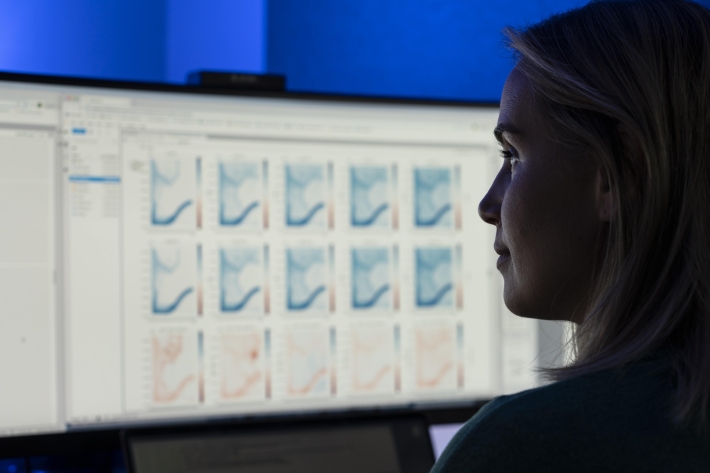
'Eleven-station' series temperature data
Research ProjectTemperature trends from 1930s to present day