A weekly update describing soil moisture patterns across the country to show where dry to extremely dry conditions are occurring or imminent. Regions experiencing significant soil moisture deficits are deemed “hotspots”. Persistent hotspot regions have the potential to develop into drought.
Facts: soil moisture
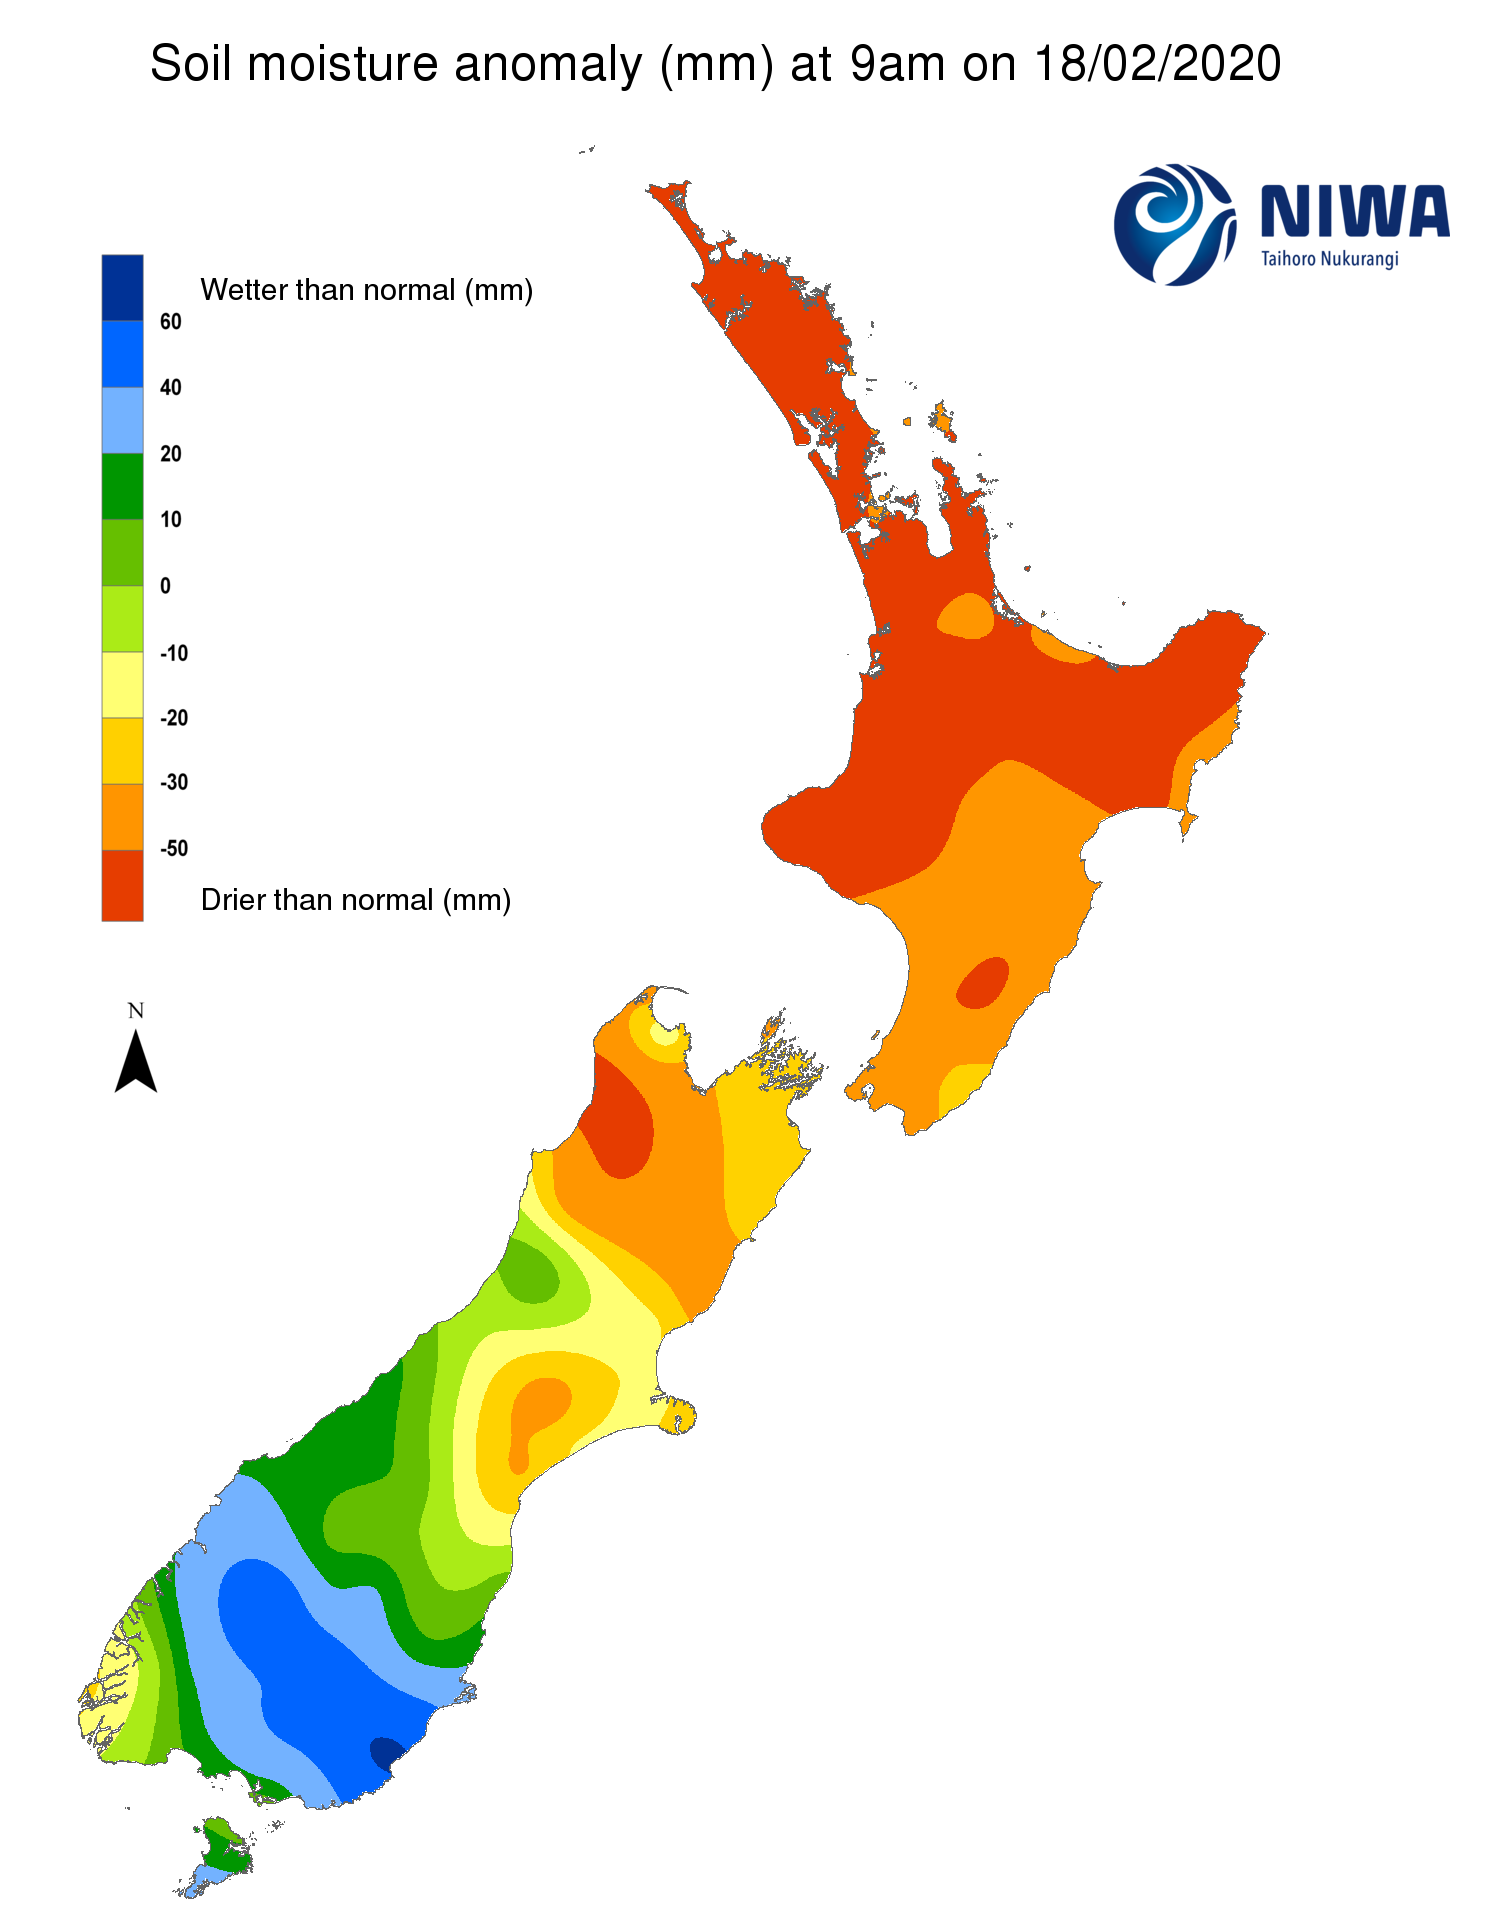
Across the North Island, slight soil moisture increases were observed during the past week as a front brought much needed rain to drought affected areas. The largest increases were found in coastal Manawatu-Manganui where soil moisture levels are back to near normal for the time of year. However, soil moisture levels continue to be well below normal across the vast majority of the island. The New Zealand Drought Index (NZDI) shows that all of the upper North Island as well as East Cape are experiencing severe meteorological drought, while the southern Waikato and eastern Taranaki to Manawatu-Whanganui and western Bay of Plenty are experiencing meteorological drought (see NZDI map).
The driest soils across the North Island, when compared to normal for this time of the year, are generally found from Northland to northern Auckland, and from western Waikato to East Cape and in the Coromandel. The wettest soils for this time of year are found in coastal Manawatu-Whanganui. For the second consecutive week, hotspots can be found in nearly all of the North Island.
Across the South Island, soil moisture levels generally increased in the north and decreased in the south during the past week. The largest increases were found in coastal northern Canterbury where soil moisture levels went from well below normal to slightly above normal.
The driest soils in the South Island compared to normal for this time of the year are located across parts of Buller District and southern Tasman, while the wettest soils are found in the Clutha district in eastern Otago. The New Zealand Drought Index (NZDI) shows that severe meteorological drought is found across parts of southern Marlborough and interior Kaikoura District, with meteorological drought also affecting northern Hurunui District and isolated parts of Tasman (see NZDI map). Current hotspots in the South Island include Nelson and nearby parts of Tasman, western Marlborough, along with Banks Peninsula, and parts of Ashburton district.
Outlook and soil moisture
In the North Island, a weakening front may bring showers to western and lower North Island on Saturday (30 February) with rainfall totals up to 10 mm possible. The prospect for rainfall next week is increasing. Recent information suggests about even odds chance for a total of at least 10 mm of rain from Tuesday – Friday (2-6 March) for much of the North Island, with the probability even greater from interior Hawke’s Bay to the Central Plateau. Therefore, the greatest soil moisture increases are likely in the central and eastern part of the island, with only modest improvement for the remainder of the North Island. Therefore, most hotspots are expected to improve or weaken in the next week. Though it should be noted, due to the uncertainty of the rainfall forecast next week, confidence is lower than average.
In the South Island, a front will move up the West Coast on Thursday-Friday (27 March) bringing rounds of moderate to heavy rain. Showers are possible east of the divide on Friday but rainfall totals will likely stay below 10 mm. The start of next week (2-3 March) is expected to be unsettled with widespread rain possible in the west and far south while the Alps may shield the east coast from most of the rain.
Weekly rainfall totals may exceed 200-300 mm in parts of the West Coast, up to 75 mm in parts of western Tasman, Southland, western Otago and Canterbury high country. Meanwhile, rainfall totals less than 20 mm are expected in far eastern areas of the South Island. Due to the expected rainfall, soil moisture levels are set to increase from Tasman to Fiordland and decrease from coastal Marlborough to coastal Otago. Overall, hotspots from Tasman to Nelson may weaken slightly during the next week, while those in eastern Canterbury may strengthen.
Background:
Hotspot Watch: a weekly advisory service for New Zealand media. It provides soil moisture and precipitation measurements around the country to help assess whether extremely dry conditions are imminent.
Soil moisture deficit: the amount of water needed to bring the soil moisture content back to field capacity, which is the maximum amount of water the soil can hold.
Soil moisture anomaly: the difference between the historical normal soil moisture deficit (or surplus) for a given time of year and actual soil moisture deficits.
Definitions: “Extremely” and “severely” dry soils are based on a combination of the current soil moisture status and the difference from normal soil moisture. See soil moisture maps.
Hotspot: A hotspot is declared if soils are "severely drier than normal" which occurs when Soil Moisture Deficit (SMD) is less than -110 mm AND the Soil Moisture Anomaly is less than -20 mm.

Soil moisture anomaly maps, relative to this time of year. The maps show soil moisture anomaly for the past two weeks.
New Zealand Drought Index
As of 24 February, the New Zealand Drought Index (NZDI) map shows that all of the upper North Island as well as East Cape are experiencing severe meteorological drought, while central Waikato to Manawatu-Whanganui and western Bay of Plenty are experiencing meteorological drought. In the South Island, severe meteorological drought is found across parts of southern Marlborough and interior Kaikoura District, with meteorological drought affecting northern Hurunui District and isolated parts of Tasman.
Please note: some hotspots in the text above may not correspond with the NZDI map. This difference exists because the NZDI uses additional dryness indices, including one which integrates the rainfall deficit over the past 60 days. Changes are therefore slower to appear in the NZDI compared to soil moisture anomaly maps that are instantaneously updated.
