A weekly update describing soil moisture patterns across the country to show where dry to extremely dry conditions are occurring or imminent. Regions experiencing significant soil moisture deficits are deemed “hotspots”. Persistent hotspot regions have the potential to develop into drought.
NIWA has recently developed a new 35-day drought forecasting tool that is available at https://shiny.niwa.co.nz/drought-forecast/
Facts: Soil Moisture
In the North Island, early January featured heavy rainfall for many locations, especially the Coromandel Peninsula, Gisborne, and the east coast, where rainfall amounts of more than 200 mm and flooding were observed in some areas, particularly due to ex-tropical cyclone Hale. Almost all of the remainder of the North Island saw substantial rainfall, generally with 50 mm or more. The one outlier was Cape Reinga, where amounts were 15 mm or less. This rainfall resulted in significant soil moisture increases across the entire island, with the exception of Cape Reinga where changes were minimal. The driest soils across the North Island, when compared to normal for this time of the year, are found at Cape Reinga, while the wettest soils for this time of the year are found in eastern Northland, Auckland, the Coromandel Peninsula, western Bay of Plenty, Gisborne, Hawke’s Bay, and Wairarapa.
No hotspots are currently located in the North Island.
In the South Island, a few discrete areas saw substantial rainfall of 50-100 mm, namely in Marlborough Sounds, Tasman, the central West Coast, and parts of far northern and interior Canterbury. Amounts of 30-50 mm were also observed in interior Otago and southern Fiordland. However, the rest of the South Island saw much lighter rainfall, generally less than 25 mm. While the areas that received the heaviest rainfall generally saw moderate soil moisture increases, the rest of the South Island typically observed moderate soil moisture decreases. The driest soils in the South Island, when compared to normal for this time of the year, are located in the upper West Coast, Banks Peninsula, Fiordland, coastal Southland, and Stewart Island, while the wettest soils for this time of the year are found in Tasman and interior central Canterbury.
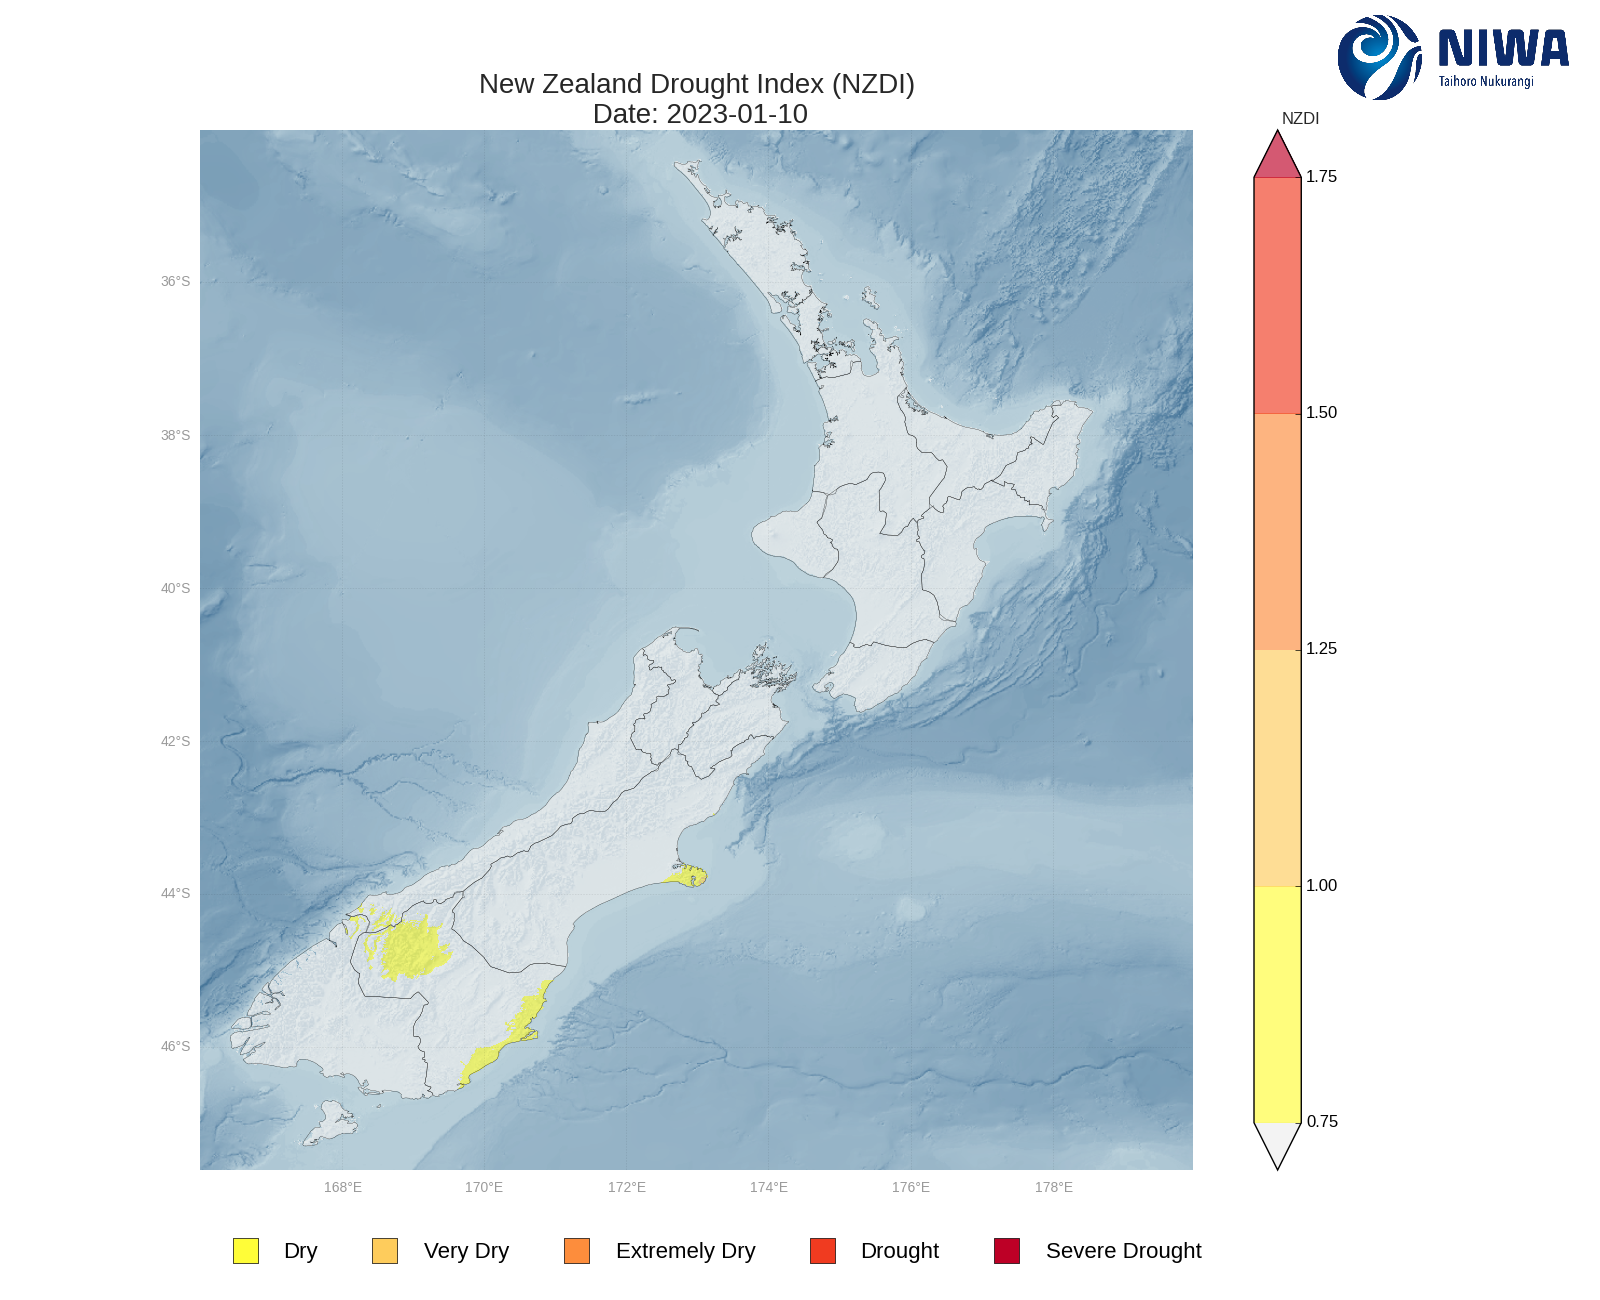
South Island hotspots are currently located in Banks Peninsula, southern Canterbury, and coastal Otago and Southland. As of 10 January, the New Zealand Drought Index (NZDI) map below shows that dry conditions are currently located in Banks Peninsula, parts of coastal and interior Otago, and a small portion of the lower West Coast. In addition, eastern Banks Peninsula is experiencing very dry conditions.
Outlook and Soil Moisture
In the North Island, moderate rain across Waikato and Bay of Plenty today (12 January) will dissipate overnight. Thereafter, an area of high pressure near the country will provide mostly dry weather over the next week, particularly for the western North Island. However, a developing easterly wind flow will result in near daily isolated to scattered showers in the upper and eastern North Island over the next week or so. Weekly rainfall totals could reach 20-40 mm in parts of the upper North Island, Bay of Plenty, Gisborne, and Hawke’s Bay, with minimal rainfall expected from Taranaki to Wellington and Wairarapa.
Due to the expected rainfall in the next week, only small changes to soil moisture levels are likely in the upper North Island, Bay of Plenty, Gisborne, and Hawke’s Bay. However, substantial decreases may occur in the western and lower North Island where little rainfall is expected in the next week.
In the South Island, high pressure will be the main weather feature over the next week, resulting in dry weather for many locations. However, interior and western portions of the island will likely see almost daily pop-up afternoon showers in the coming days. The rainfall from these showers will be highly localised, but some locations could see 20-40 mm. However, rainfall elsewhere will typically be meagre, with totals of generally 10 mm or less.
Due to the expected rainfall in the next week, soil moisture levels may decrease substantially in much of the South Island. In localised areas that see heavier rainfall, small increases may occur. The current hotspots in the eastern and lower South Island are likely to strengthen and expand during the next week.
Background:
Hotspot Watch: a weekly advisory service for New Zealand media. It provides soil moisture and precipitation measurements around the country to help assess whether extremely dry conditions are imminent.
Soil moisture deficit: the amount of water needed to bring the soil moisture content back to field capacity, which is the maximum amount of water the soil can hold.
Soil moisture anomaly: the difference between the historical normal soil moisture deficit (or surplus) for a given time of year and actual soil moisture deficits.
Definitions: “Extremely” and “severely” dry soils are based on a combination of the current soil moisture status and the difference from normal soil moisture (see soil moisture maps at https://www.niwa.co.nz/climate/nz-drought-monitor/droughtindicatormaps)
Hotspot: A hotspot is declared if soils are "severely drier than normal" which occurs when Soil Moisture Deficit (SMD) is less than -110 mm AND the Soil Moisture Anomaly is less than -20 mm.
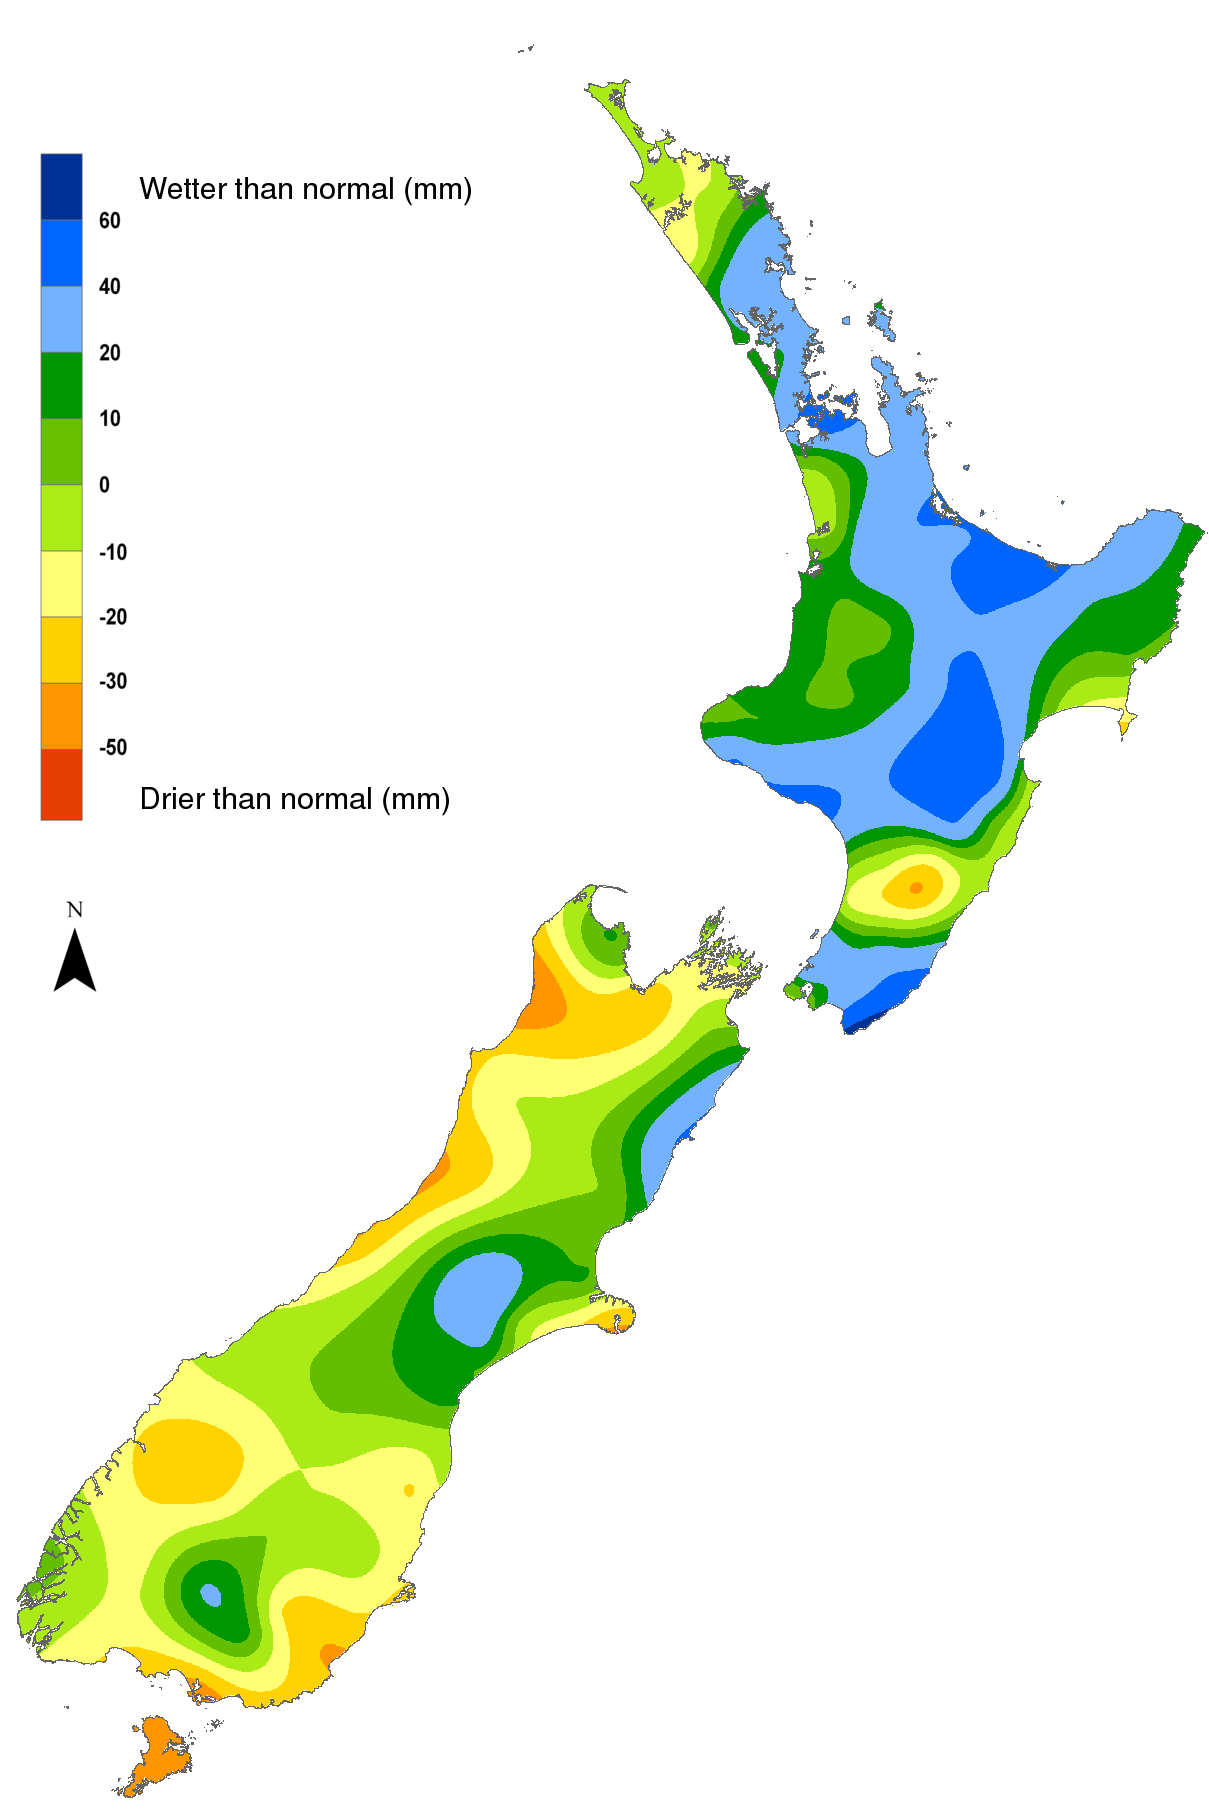
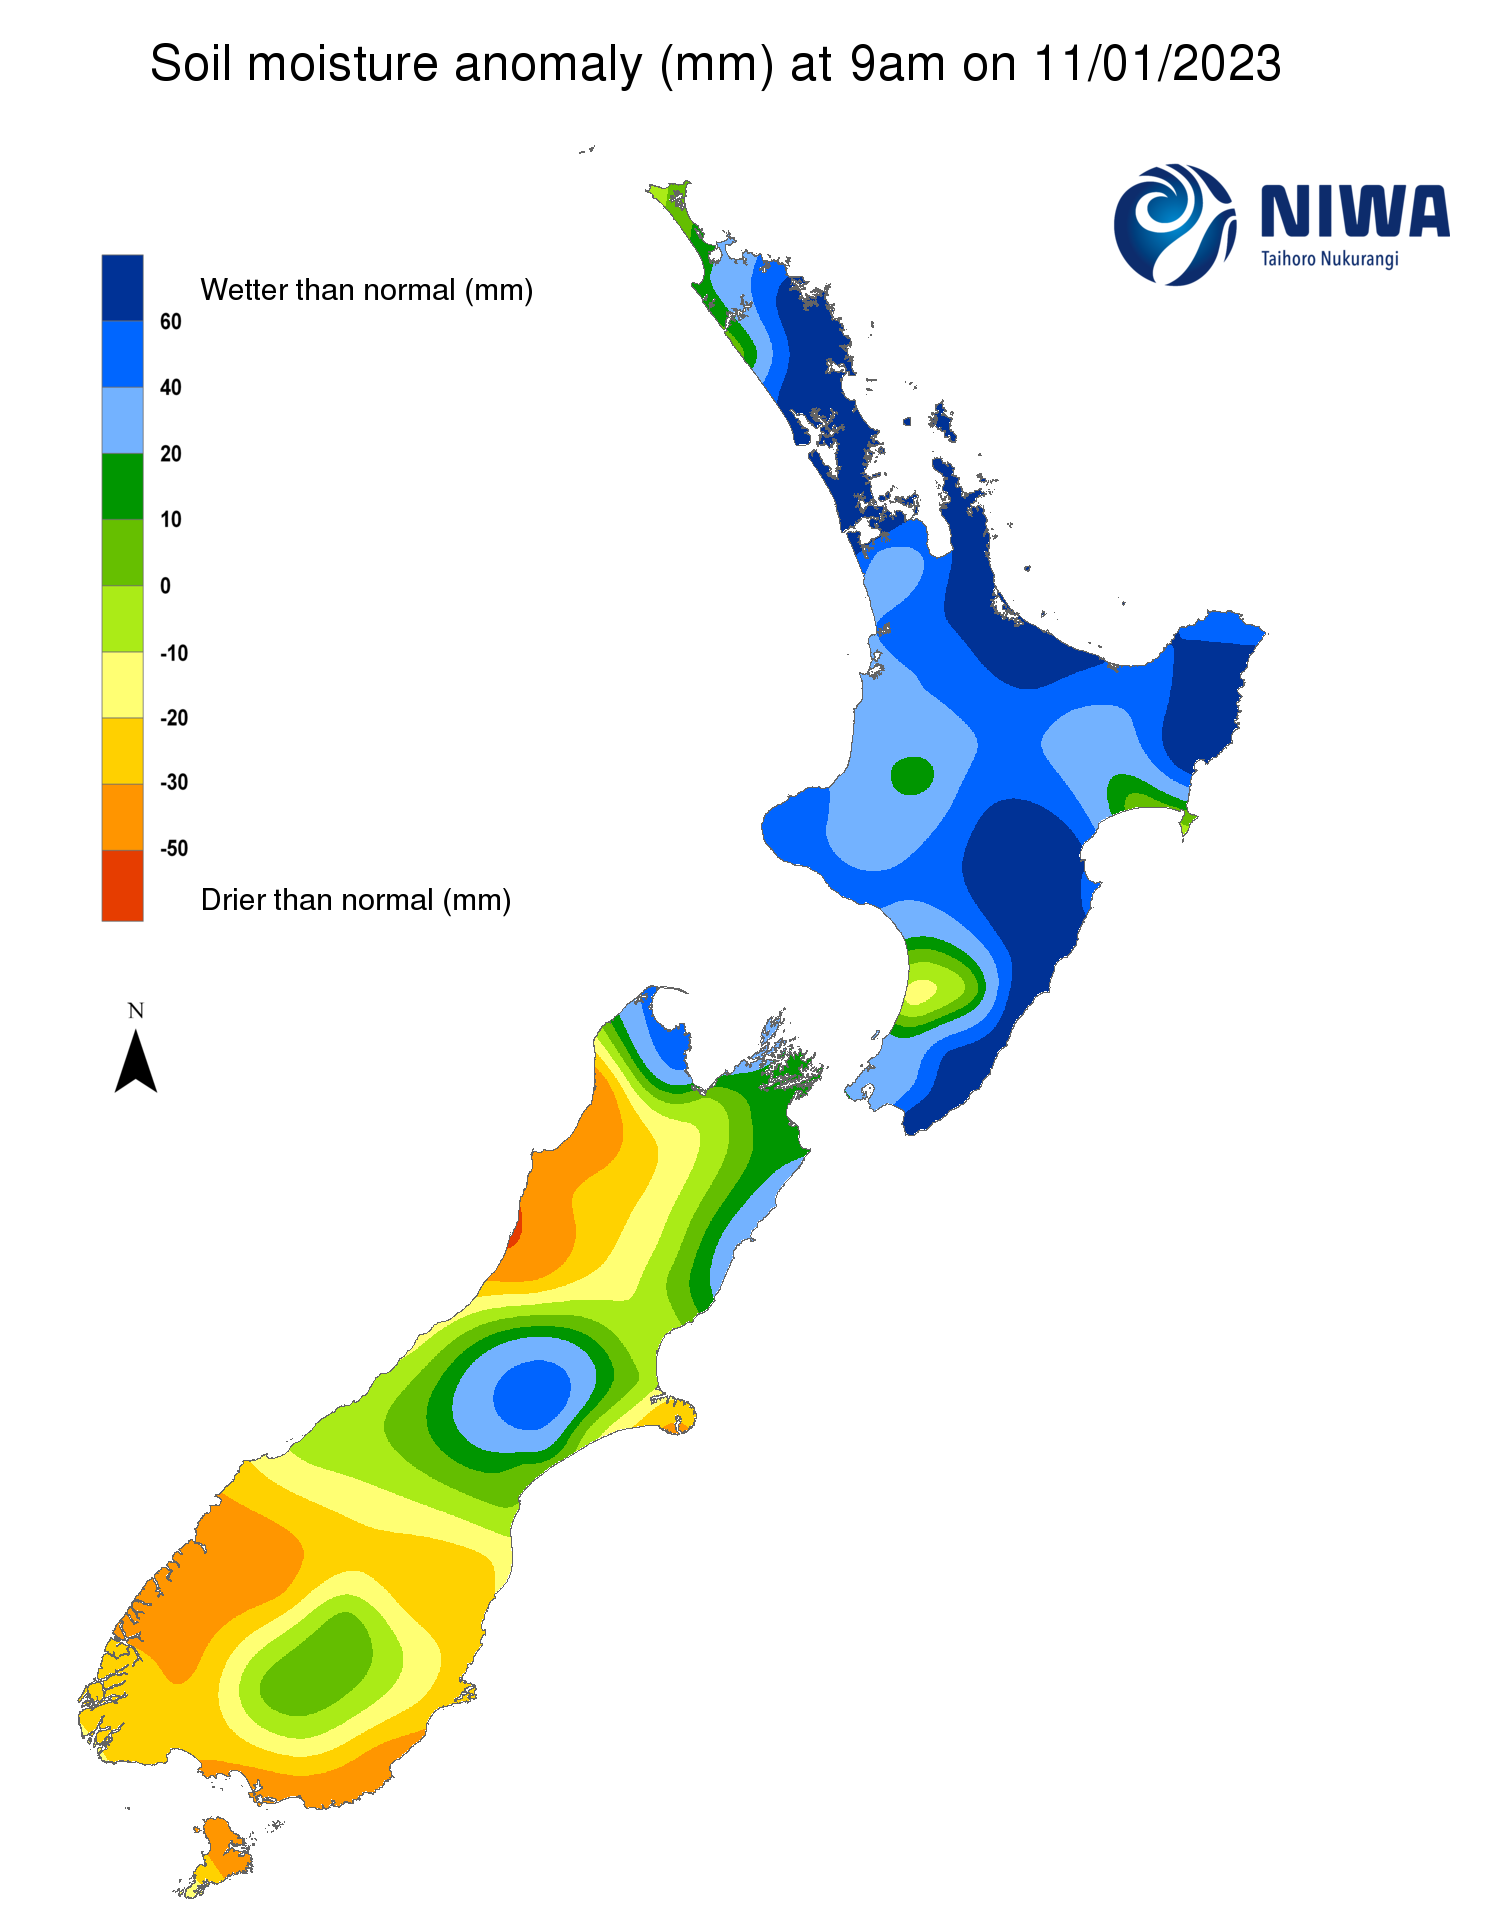
Pictured above: Soil Moisture Anomaly Maps, relative to this time of year. The maps show soil moisture anomaly on 1 January and 11 January.
New Zealand Drought Index (NZDI)
As of 10 January, the New Zealand Drought Index (NZDI) map below shows that dry conditions are currently located in Banks Peninsula, parts of coastal and interior Otago, and a small portion of the lower West Coast. In addition, eastern Banks Peninsula is experiencing very dry conditions. Please note: some hotspots in the text above may not correspond with the NZDI map. This difference exists because the NZDI uses additional dryness indices, including one which integrates the rainfall deficit over the past 60 days. Changes are therefore slower to appear in the NZDI compared to soil moisture anomaly maps that are instantaneously updated.