PDF of this article (655 KB)

Brett Mullan Melissa Bowen Stephen Chiswell
“Coupled global climate models” currently provide our best predictions of the effects of increasing greenhouse gases on global and local climates.
The climate system has so many complex interacting components that predicting the Earth’s response to increased greenhouse gas emissions requires the use of sophisticated computer models. Only in the last few years has it been possible to make computer models that realistically couple the atmosphere and the ocean, allowing each to move and influence each other. These coupled climate models keep track of winds in the atmosphere, currents in the ocean, and the resulting transport of heat and gases around the earth. They also keep track of sea ice and land vegetation cover.
Coupled models are computationally expensive. They are typically run on supercomputers where it can take up to two months of computing to simulate one century. There are less than a dozen research centres worldwide capable of running these models.

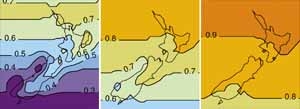
Scenarios of annual change in mean temperature over the next 50 years from six coupled models. The centre panel gives the six-model average, from which warming in New Zealand ranges from 0.6° to 0.8°C (compared to a model-average global temperature increase of 1.25°C over the same period), with changes increasing south to north and west to east. The side panels indicate reasonable lower and upper limits to the changes, from the minimum warming (left panel) to the maximum warming (right panel), for the assumed mid-range increases in greenhouse gas concentration.
The models are typically started with estimates of gas concentrations in around 1850. Gases are added into the atmosphere at various rates to model different potential scenarios. In the most common scenario, carbon dioxide in the model atmosphere is increased at 1% every year, which represents mid-range future emissions.
The Intergovernmental Panel on Climate Change (IPCC) has recently released its Third Assessment Report, which summarises results for a variety of scenarios and model runs. Globally averaged surface temperatures are projected to increase between 1.4 and 5.8°C over the next century, and sea level is projected to rise between 9 and 88 cm. These projections depend on how much greenhouse gas is put into the atmosphere over the next 100 years, as well as the particular model used. Most scientists believe values in the middle of these ranges are more likely than the extremes.
The model predictions suggest that global temperatures will increase faster over land than over the oceans. Global precipitation is predicted to increase overall, with a larger percentage of the annual total occurring as intense rainfall events. Fewer frosts and a smaller range of daily temperatures are likely, with higher risks of summer droughts in mid-latitude continents.
The models predict that warming of the surface waters in the Southern Ocean will be slow because water sinking near the Antarctic carries the heat away from the surface to the deeper ocean. Thus, the Southern Hemisphere will warm more slowly than the globe as a whole, increasing the temperature difference between the tropics and the Antarctic and causing the westerly winds to speed up.

Measurements over the last 30 years show that, on average, westerly winds of about 10 km/h blow over most of the country (left). The westerly winds increase in strength to the south of New Zealand and become easterly farther north (negative numbers). The right panel shows the average prediction of changes in the wind field 50 years in the future from four coupled models. The average westerlies are predicted to increase (positive numbers) by about 10%, or 1 km/h, over the country.
For New Zealand, the models suggest faster warming in the north of the country than in the south (as illustrated in the scenarios shown lower left page) and increasing westerly winds over the country (shown in the diagrams above).
Extrapolating the 50-year warming shown in the centre panel of the lower left illustration to the end of the century would give a New Zealand warming of about 2°C by 2100, assuming mid-range increases in greenhouse gas concentrations.
The models also suggest precipitation decreasing in the east of the North Island and increasing in the south-west of the South Island. Droughts are likely to become more frequent in the east of both islands. At the same time, an increase in flooding risk in some parts of the country is possible due to more intense rainfall events.
Although the coupled models do not include enough detail to show the strong, narrow ocean currents that flow around New Zealand, the changes of the winds hold clues as to what might be expected in the ocean. The warm currents flowing along the eastern coast of the North Island are driven primarily by the twisting action of winds over the subtropical South Pacific. These wind patterns show little change in the model runs, suggesting no major modifications to the warm-water currents. However, the projected increased westerlies – especially south of the country – are likely to slightly accelerate the cold Antarctic Circumpolar Current (see pages 15–17, this issue).
On the year-to-year time-scale, climate is dominated by seasonal and El Niño–Southern Oscillation variations. (For more on ENSO see page 9, this issue.) Nevertheless, the gradual long-term warming has the potential to alter the climate on short time-scales. The strength of tropical cyclones could increase – a concern for northern New Zealand – although there is little existing evidence for an increase in numbers. The projections show little change or a small increase in amplitude of ENSO events. The intensity of mid-latitude storms affecting New Zealand could potentially increase, given the increase in their energy sources from the large-scale temperature gradients and condensation of moisture. These conclusions are still being debated but we all have a stake in the answers.
Brett Mullan, Melissa Bowen and Stephen Chiswell are based at NIWA in Wellington.
