PDF of this article (1 MB)

Philip Sutton
The ocean is so variable that identifying subtle, long-term trends – like climate change – is far from straightforward.
The ocean changes on all scales of time and distance. However, some scales are more important than others, because they have large variations – or “signals” – associated with them. For instance, tides have a very clear cycle with a dominant 12.4-hour period. The annual cycle is also obvious as the ocean warms and cools once a year with the seasons. Similarly, some length scales dominate. Just as atmospheric weather systems over New Zealand tend to be 1,000 km across, there are characteristic length scales associated with ocean “weather”. Around New Zealand ocean features such as eddies typically have scales of 100–200 km.
To study how the ocean is changing, it is necessary to measure it regularly over time. For temperature changes, this is no mean feat, since the interior of the ocean is opaque to satellite measurements of temperature. Direct measure-ments must be made from ships.
Changing scales: an example

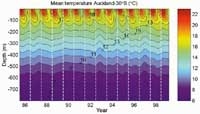
Average temperature vs. depth along a line between Auckland and 30°S. See text for explanation.
The graph to the right of temperature vs. depth is from data collected four times per year by dropping expendable probes (XBTs) off container ships sailing north from Auckland (see Water & Atmosphere 8(4): 11–12). The graph shows how the average temperature along a line between Auckland and 30°S changes with time. Averaging along the line averages over the spatial variability. Each temperature – at intervals of 1°C – is represented by one colour. The largest signal is the annual cycle: the warming and cooling of the top 150 m each year. However, more subtle changes can also be seen. For example, the summers of 1992–94 were cooler than 1995/96 and 1998/99 and winter 1991 was cool while winter 1988 and winter 1998 were relatively warm.
The ocean is stratified, with lighter water overlaying denser water. Lighter water is typically warmer and/or fresher, while denser water is colder and/or saltier. The uppermost layer of the ocean, or mixed layer, has uniform temperature and salinity and is in direct contact with the atmosphere. Close examination of the graph shows that the mixed layer is as shallow as 20–30 m in summer, while in winter it extends down to over 100 m. There are two reasons for this. Winter cooling makes surface waters denser so that they sink; and stronger winds in winter result in deeper mechanical stirring.
The deeper waters, below the mixed layer, have been “formed” at the surface somewhere distant from New Zealand and then carried into the region by currents, sliding below the surface as they travelled. Below the mixed layer is the thermocline in which the water cools markedly (and hence density increases) with depth.

Phil Wiles drops an XBT from the Australian research vessel RV Franklin. (Photo: Matt Walkington)
Because light water floats on top of heavier (denser) water, the water in this layer, called intermediate water, is locked in this depth range. This water was last in contact with the atmosphere in the Southern Ocean, well to the south of New Zealand.
Finally, the deepest waters (>2,500 m) have nearly constant properties. These waters last contacted the atmosphere in the Greenland Sea or around Antarctica as much as thousands of years ago. These deep waters are critical in climate stability and change because they store heat and carbon dioxide (CO2) for such long periods.
Water temperatures and climate cycles

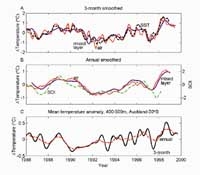
The effect of looking at temperature data (as variations from a given temperature) on different scales. See text for explanation.
The characteristics of the mixed layer and thermocline are evident in the figure on the right, but show up much more clearly in the graph to the right. In this second graph, changes caused by the annual cycle have been removed to allow us to examine the more subtle, longer-term, year-to-year variability.
The top panel shows the average mixed-layer temperature (blue), average air temperature from northern land sites around New Zealand (red) and the average sea-surface temperature (SST) along the line as measured by satellite (black dashed). On longer time scales, all three lines are very similar, and indicate that the year-to-year variability in the upper ocean is of the order of ±1.5°C. On shorter time scales, the SST resembles the air temperature more closely than the mixed-layer temperature.
The second panel shows the mixed layer (blue) and air (red) temperatures, this time smoothed to accentuate differences between years. The Southern Oscillation Index (SOI) (green) is also plotted. The SOI is an indicator of the El Niño–Southern Oscillation (ENSO), with negative SOIs associated with El Niños and positive SOIs with La Niñas. This shows that the changes in the upper ocean temperature can largely be explained by the ENSO cycle, with conditions generally being cooler in El Niños and warmer in La Niñas.
Importantly, this correlation breaks down during the warm conditions since 1998. These conditions began during an El Niño, when cooling would have been expected. In addition to ENSO, the ocean around New Zealand is expected to respond to longer-period cycles such as the Antarctic Circumpolar Wave (~7 year period) and the Interdecadal Pacific Oscillation (IPO) (~50-year period). At this stage, not enough data exist to test the effects of these interactions.
The bottom panel of the graph shows the average temperature changes at 400–500 m deep, in the thermocline, with 3-month and annual resolutions. Year-to-year temperature changes at these depths are around ±0.3°C, much smaller than at the surface. The main signal here is a cooling until 1990 and then a gradual warming. There is no similarity with either the upper ocean or the SOI.
Climate change in the ocean?
Can we see climate change in the ocean? From this example, it is clear that the main problem in measuring climate change is discriminating the signal from the noise. Predictions of warming in the ocean due to global warming are 0.5°C per decade. If this is correct, then in the 15-year ocean temperature time-series shown here we would need to discriminate a signal of 0.75°C from the noise. The noise includes: 5°C from the annual cycle; ±1.5°C variability on 4–8-year time scales apparently resulting from ENSO; and other unknown responses from longer-period changes. The sheer variability of the ocean makes the subtle signals of global warming extremely hard to discern.
Philip Sutton is based at NIWA in Wellington.
