2021: New Zealand’s warmest year on record
|
Temperature |
Annual temperatures were above average (+0.51°C to +1.20°C above the annual average) for much Aotearoa New Zealand. Well above average temperatures (>1.20˘C above the annual average) occurred in parts of Auckland, Bay of Plenty, Tasman and Fiordland. Near average (within -0.50°C to +0.50°C of average) temperatures occurred in western Waikato, coastal Wairarapa and parts of northern Canterbury and Otago. 2021 was the warmest year on record for New Zealand, based on NIWA’s seven-station series which began in 1909. |
|
Rainfall |
Rainfall was near normal (80-119% of annual normal) for most of the country. Above normal rainfall (120-149% of annual normal) occurred in parts of Taranaki, coastal Manawatū-Whanganui and western Greater Wellington. Parts of Nelson, interior Canterbury and Otago also experienced above normal rainfall. |
|
Soil moisture |
The majority of the country experienced below normal soil moisture levels during the first three months of the year. Meteorological drought was present for a time in the Far North during January and February. By June, soil moisture had recovered and was largely near normal with the exception of parts of the Hawke’s Bay where dryness persisted. Near normal soil moisture persisted through to September. By the end of December, soils were drier than normal across much of the upper North Island and Southland while above normal soil moisture levels were present in much of Taranaki, central and southern Manawatū-Whanganui, Wellington, coastal Marlborough, eastern Canterbury and parts coastal Otago. |
|
Sunshine |
Taranaki experienced New Zealand’s highest annual sunshine total during 2021 (2592 hours recorded at New Plymouth). |
Overview
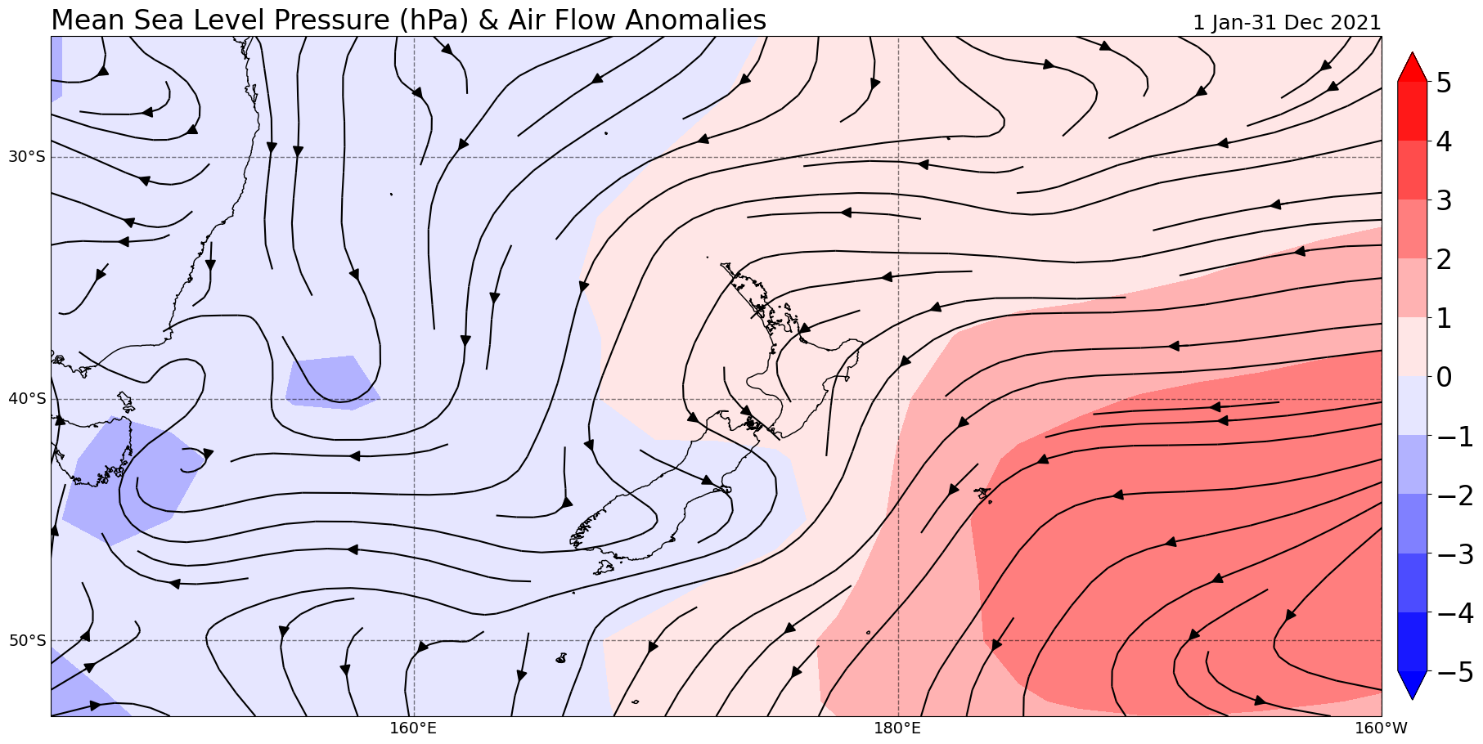
2021 was Aotearoa New Zealand’s warmest year on record, surpassing the previous record set in 2016. Seven of the past nine years have been among New Zealand’s warmest on record. This trend is consistent with the overall pattern of global warming. The nationwide average temperature for 2021, calculated using stations in NIWA’s seven-station temperature series which began in 1909, was 13.56°C (0.95°C above the 1981–2010 annual average). Based on the seven-station series, 2021 featured three months (January, February and September) with near average temperatures (within -0.50°C to +0.50°C of average), nine months with above average temperatures (greater than +0.50°C of average), and no months with below average temperatures (less than -0.50°C of average). Daily data based on NIWA’s Virtual Climate Station Network shows that for the country as a whole, 26% of days in 2021 featured below or well below average temperatures, 19% of days had near average temperatures and 55% of days featured above average or well above average temperatures. The Southern Annular Mode (SAM), an indicator of Southern Hemisphere climate variability, was positive 73% of the time during 2021. The positive SAM phase is associated with higher than normal air pressure around New Zealand, which tends to bring more tranquil weather conditions to the country. Frequent high pressure over the North Island and east of New Zealand, which caused more northerly quarter winds than normal, was a contributor to New Zealand’s warmest year on record. Figure 1 shows the air pressure and wind flow as a difference from normal during 2021.
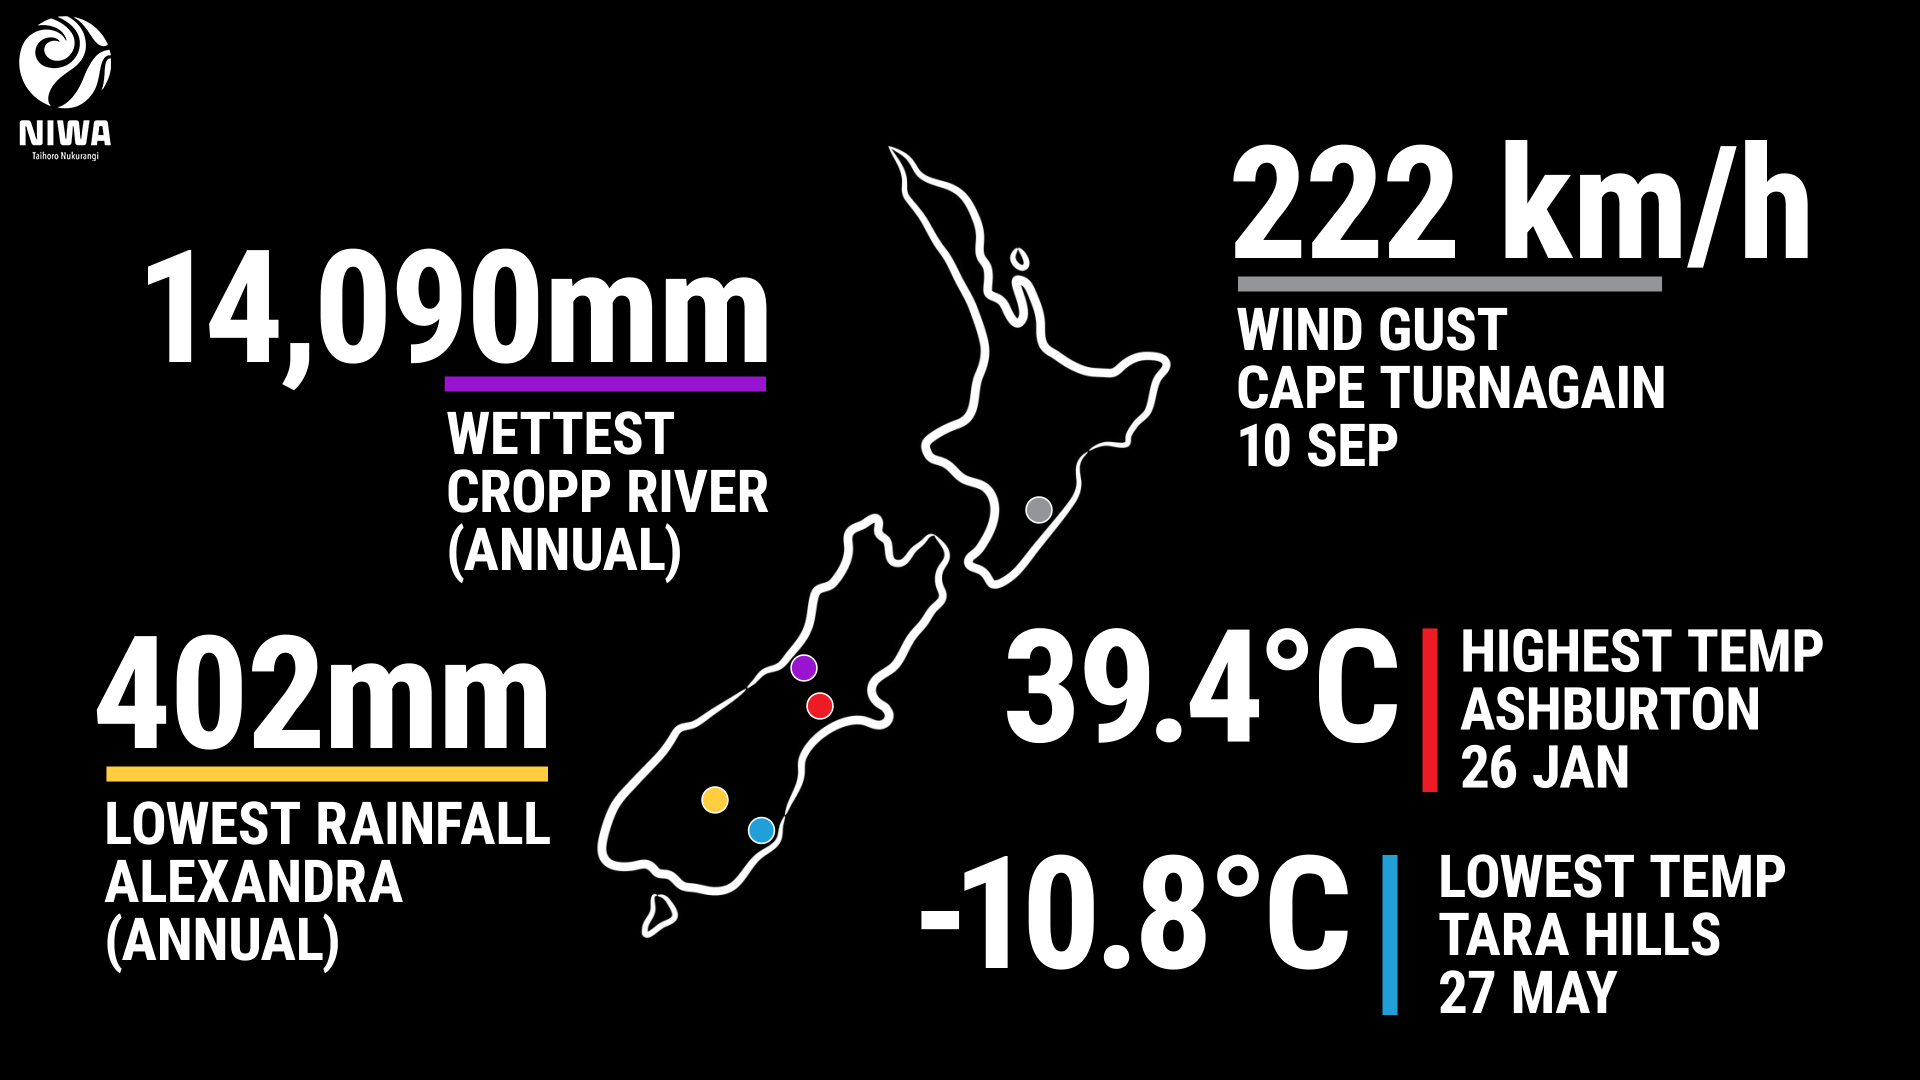
The hottest spell of the year took hold over New Zealand from 25-28 January, with several locations observing record or near-record high daily maximum and daily minimum temperatures. The highest temperature of 2021 was recorded on 26 January at Ashburton. The maximum temperature there reached 39.4°C, which is New Zealand’s 2nd-highest January temperature on record, and the country’s 10th-equal hottest temperature on record for all months. The start of the year also featured extended dry spells in the North Island. Meteorological drought developed in the Far North district during January (based on the NZ Drought Index) while very dry to extremely dry conditions became widespread across large parts of the North Island as well as Marlborough and northern Canterbury during February. Water restrictions were temporarily implemented in Northland, Auckland, Wairarapa and the Hastings District. During January and February, moderate La Niña conditions in the central Pacific (which began in October 2020) gradually eased. La Niña in New Zealand is often associated with north-easterly winds and warmer weather, however the weather patterns from this climate driver at the start of 2021 were generally not consistent with those expected. January featured more south-westerly winds than usual and February featured easterlies. Both months were some of our coolest of the year (relative to the time of year). The atypical impacts can be attributed, in part, to a non-traditional central Pacific type of La Niña, whereby the minimum sea surface temperature anomalies are located in the central Pacific rather than the east.
Autumn 2021 was characterised by long dry spells and warmth, interspersed by bursts of heavy rainfall. This was because La Niña began its transition to an El Niño Southern Oscillation neutral phase in March and the dominant climate driver became the Madden-Julian Oscillation (MJO), an eastward moving “pulse” of cloud and rain in the tropics. The MJO was often active over Africa and the western Indian Ocean, leading to spells of high pressure over New Zealand. As a result, much of New Zealand experienced warm days, but chilly nights. However, on the occasions when the MJO pulsed across the Maritime Continent (north of Australia) and into the Pacific, notable rain and storm outbreaks occurred, including the Canterbury flood event at the end of May where heavy and persistent rain led to severe flooding in the foothills and a State of Emergency declaration. Research after the event carried out by the Extreme Weather Event Real-time Attribution Machine (EWERAM) project found that the extreme rainfall during this event was 10-15% more intense as a result of human influence on the climate system.
Winter 2021 was the warmest winter on record in New Zealand, surpassing the record recently set in winter 2020, owing to more northerly quarter winds than normal. Several atmospheric rivers, or long, narrow regions in the atmosphere that transport most of the water vapour outside the tropics, affected New Zealand during winter, causing extreme rainfall in some regions. This was typically associated with the active phase of the MJO in the Indian Ocean, Maritime Continent, and western Pacific. This was likely connected to the emergence of a negative Indian Ocean Dipole, which refers to warmer than average ocean temperatures in the tropical eastern Indian Ocean. For New Zealand, this may have allowed for more tropical moisture to become available to passing weather systems in the mid-latitudes. The most notable event occurred in July, when an atmospheric river brought heavy rain to the West Coast, Tasman, Nelson and Marlborough. This event led to the Buller River recording the highest flow rate ever recorded in a New Zealand river. The flooding required evacuations and resulted in an estimated $132.4 million in privately insured damage according to the NZ Insurance Council.
Re-developing La Niña conditions during spring resulted in a transition from a westerly air flow, near average temperatures and widespread wet weather during September to more north-easterly winds during October-December, bringing frequent warm and humid weather and contributing to the country’s 5th-warmest October, warmest November and 4th-warmest December on record. A warm end to the year was helped along by increasing coastal sea surface temperatures (SSTs), particularly in November when marine heatwave (MHW) conditions emerged and persisted through December. During December, daily SSTs reached as high as 4˚C to 5˚C above average around the western and northern North Island, qualifying as one of the strongest MHW events in the last four decades in the North Island’s coastal waters.
Find out more by visiting Annual Climate Summary 2021 - a recap of the climatic facts and figures for Aotearoa New Zealand
Download
- Download the 2021 New Zealand Annual Climate Summary [PDF 1.57 MB]