Climate Mode Indices
Southern Oscillation Index (SOI) (Read me)
------- PLOTS: Monthly; Last 4 years; Daily; Last 3 months
------- DATA: Monthly; Last 4 years; Daily; Last 20 years (includes Tahiti and Darwin MSLP)
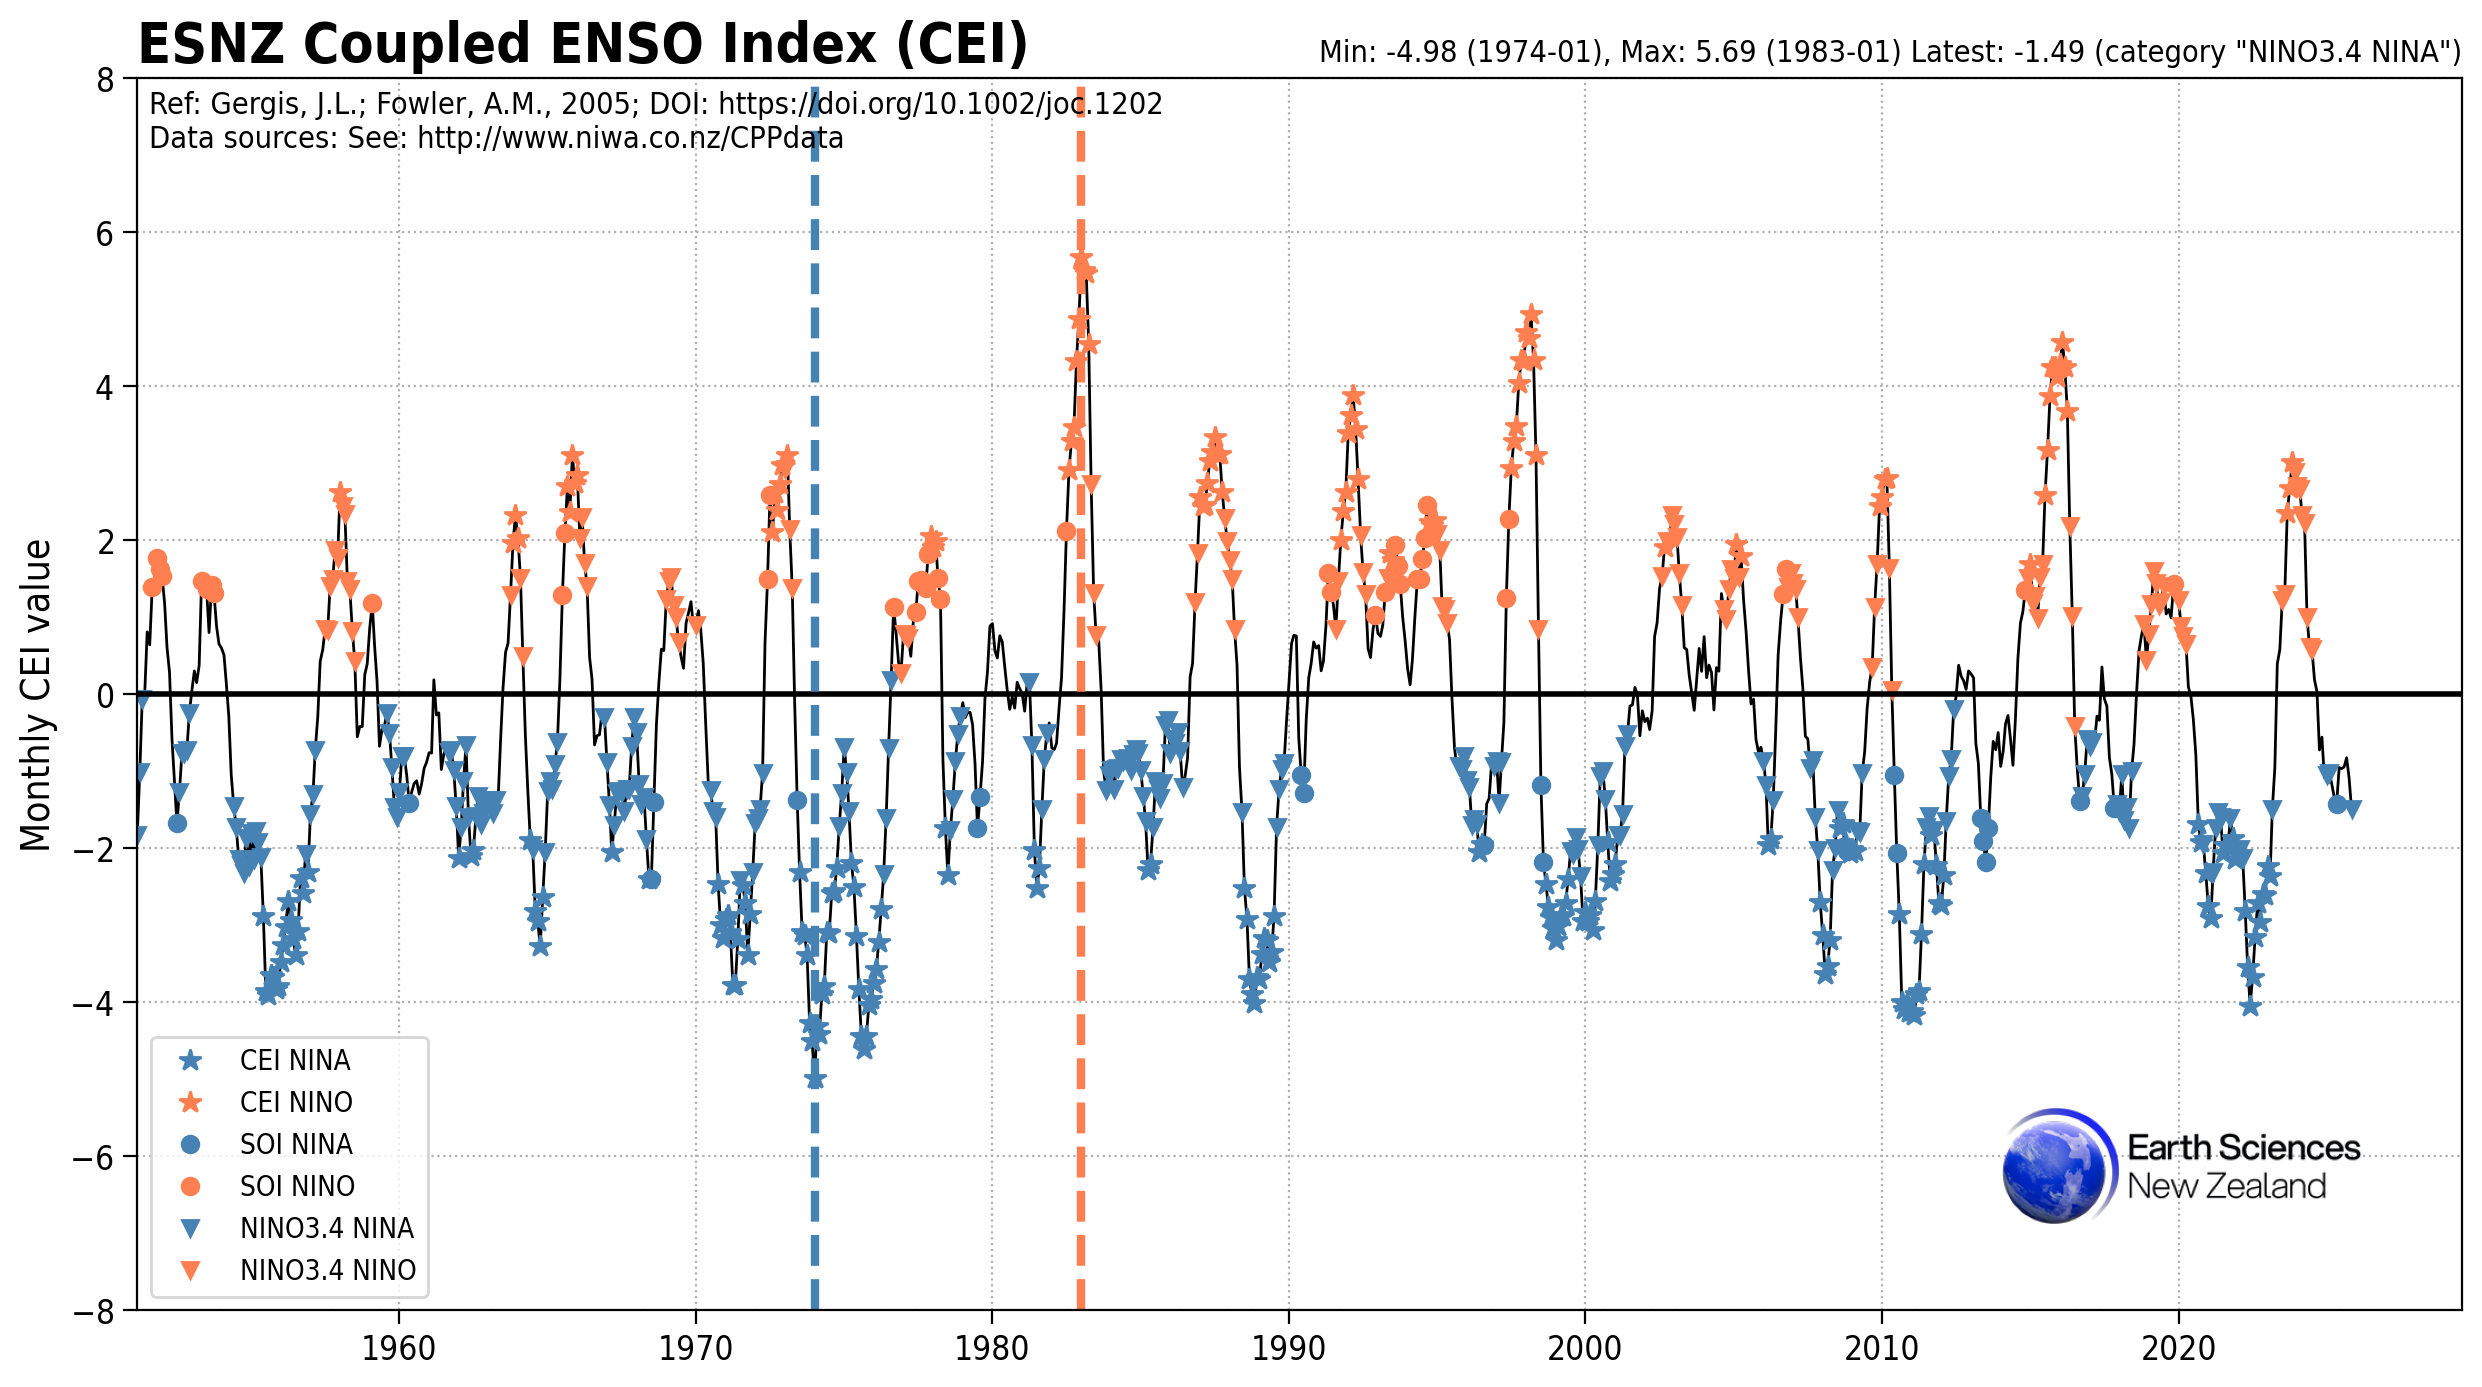
Coupled ENSO Index (CEI) (Read me)
------- PLOTS: Monthly; from May 1950
------- DATA: Monthly (from May 1950)
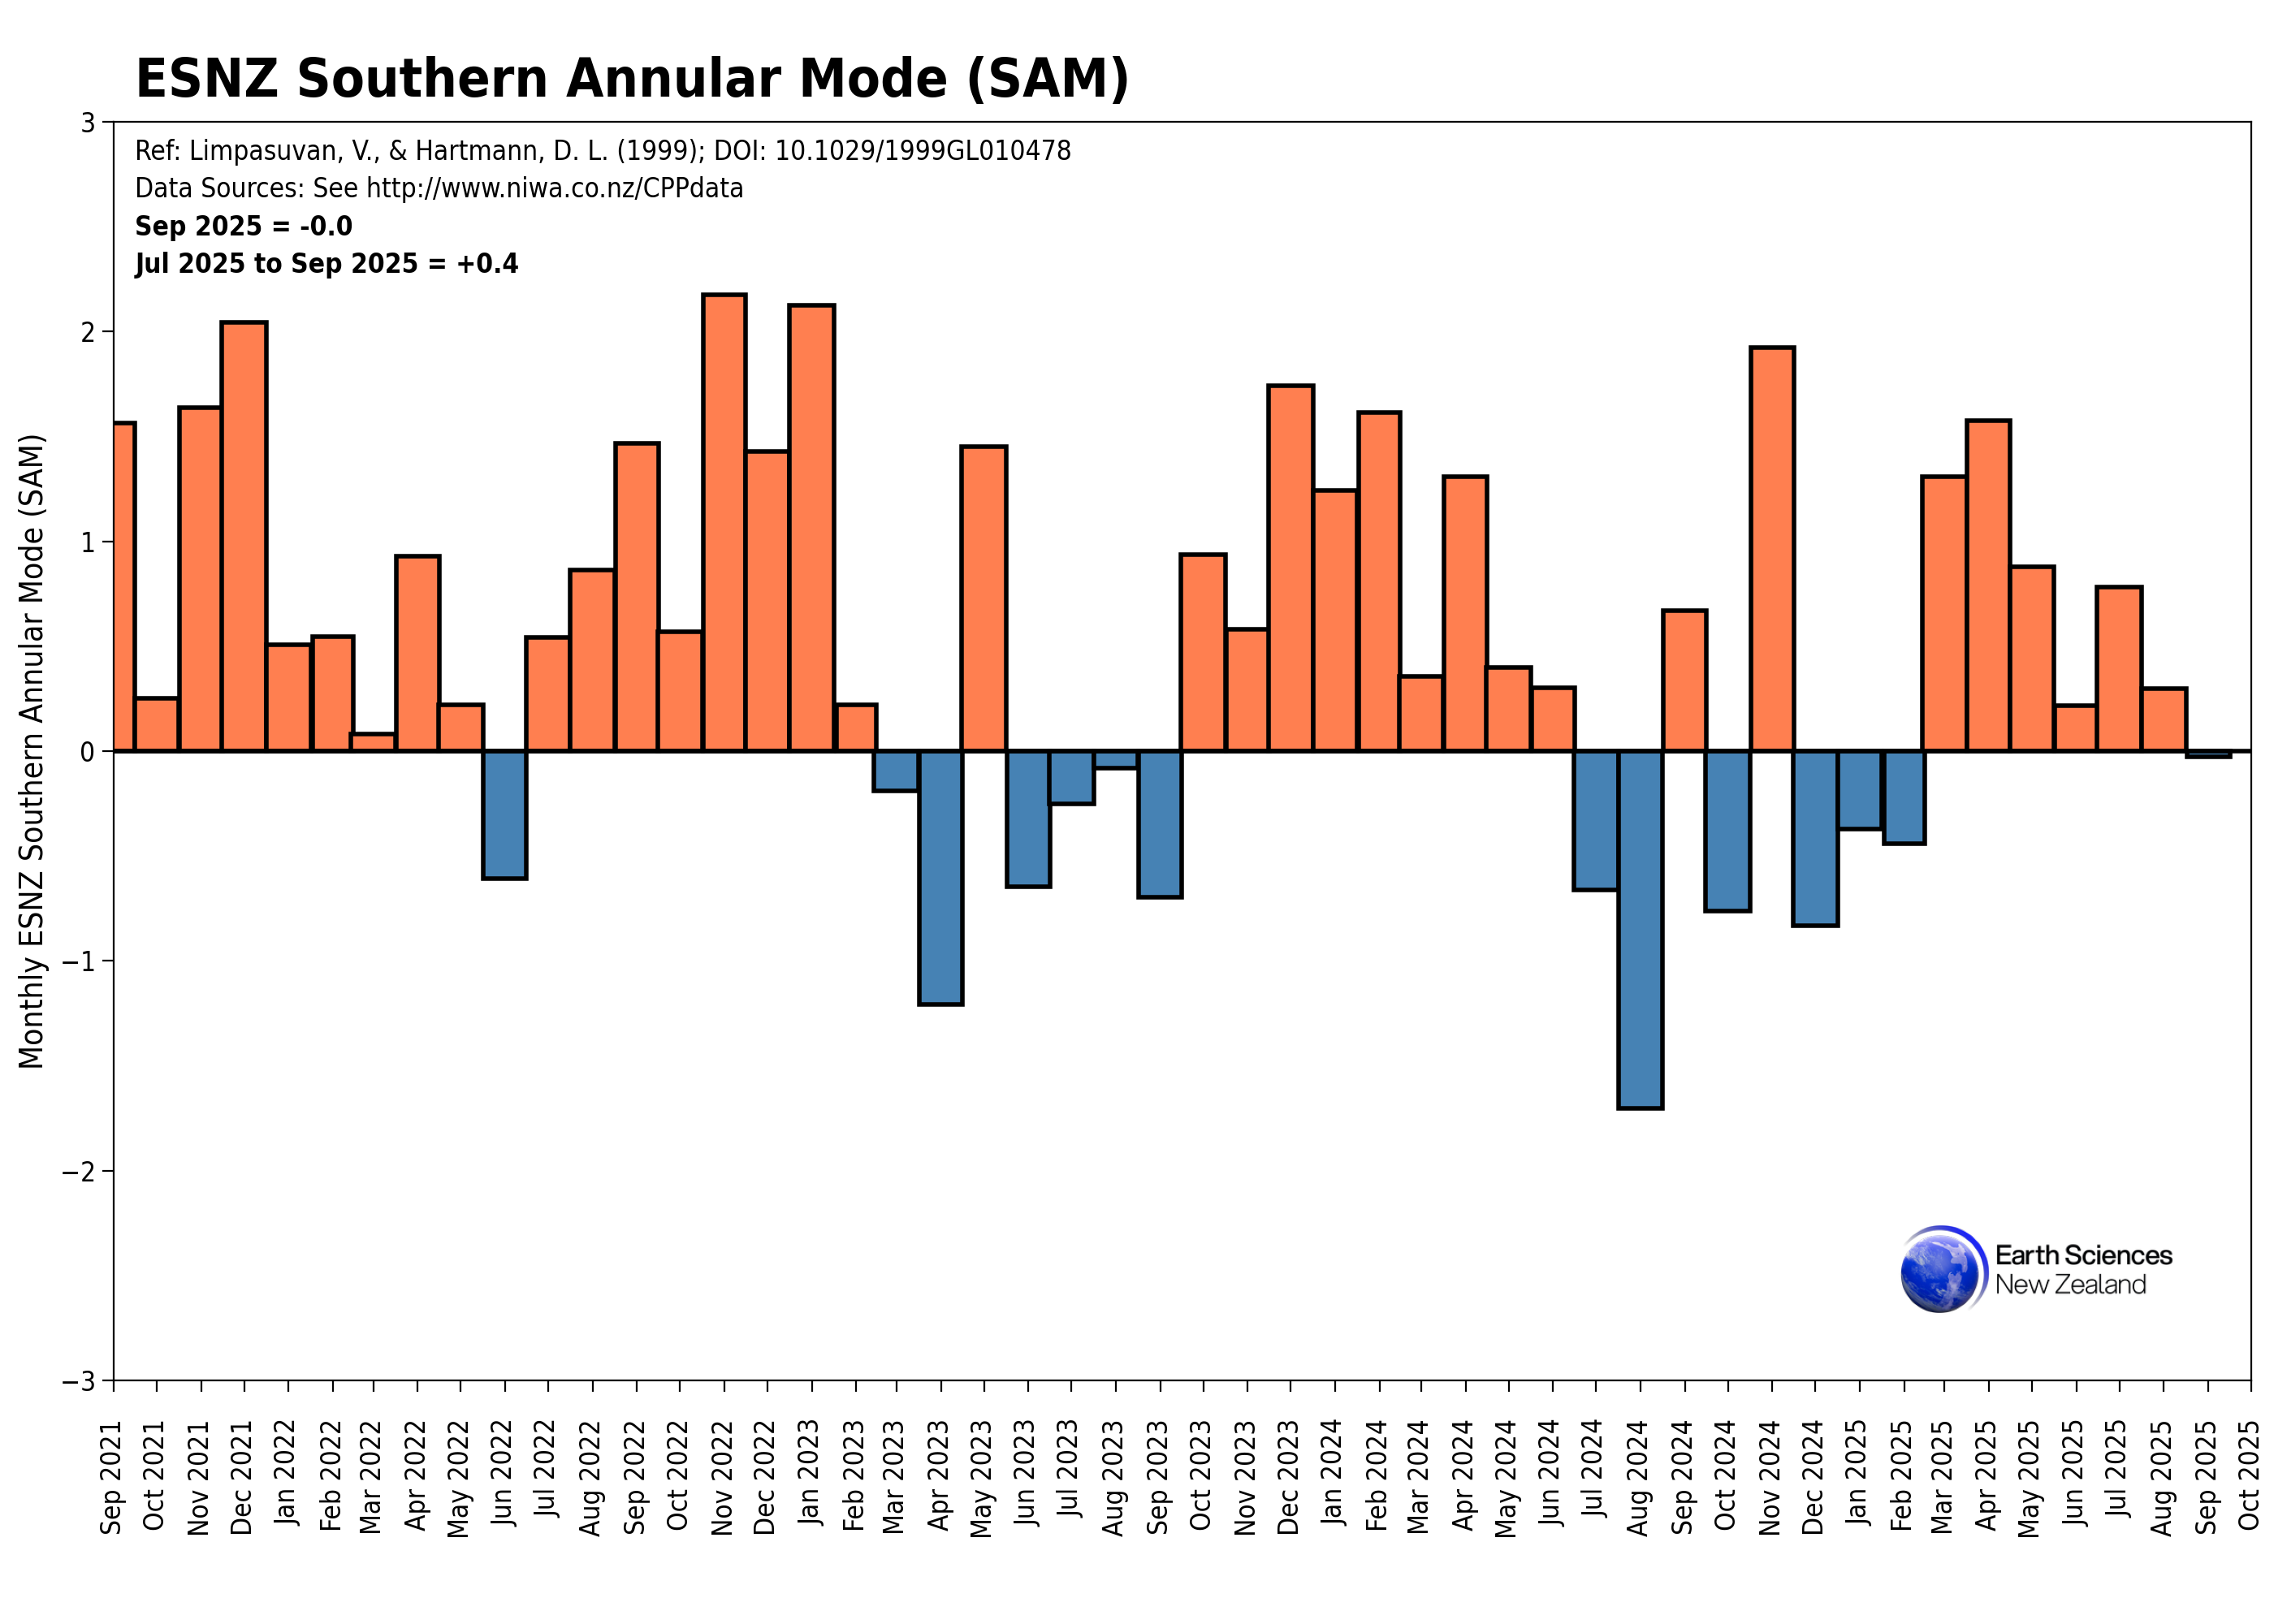
Southern Annular Mode (SAM) (Read me)
------- PLOTS: Monthly; Last 4 years
------- DATA: Monthly (from January 1979)
Madden-Julian Oscillation (MJO) (coming soon)
Interdecadal Pacific Oscillation (IPO) (coming soon)
Zonal Wave 3 (ZW3) Index (coming soon)
South Pacific Blocking Index (coming soon)
Pacific South American mode (PSA) (coming soon)
Oceanic climate indices
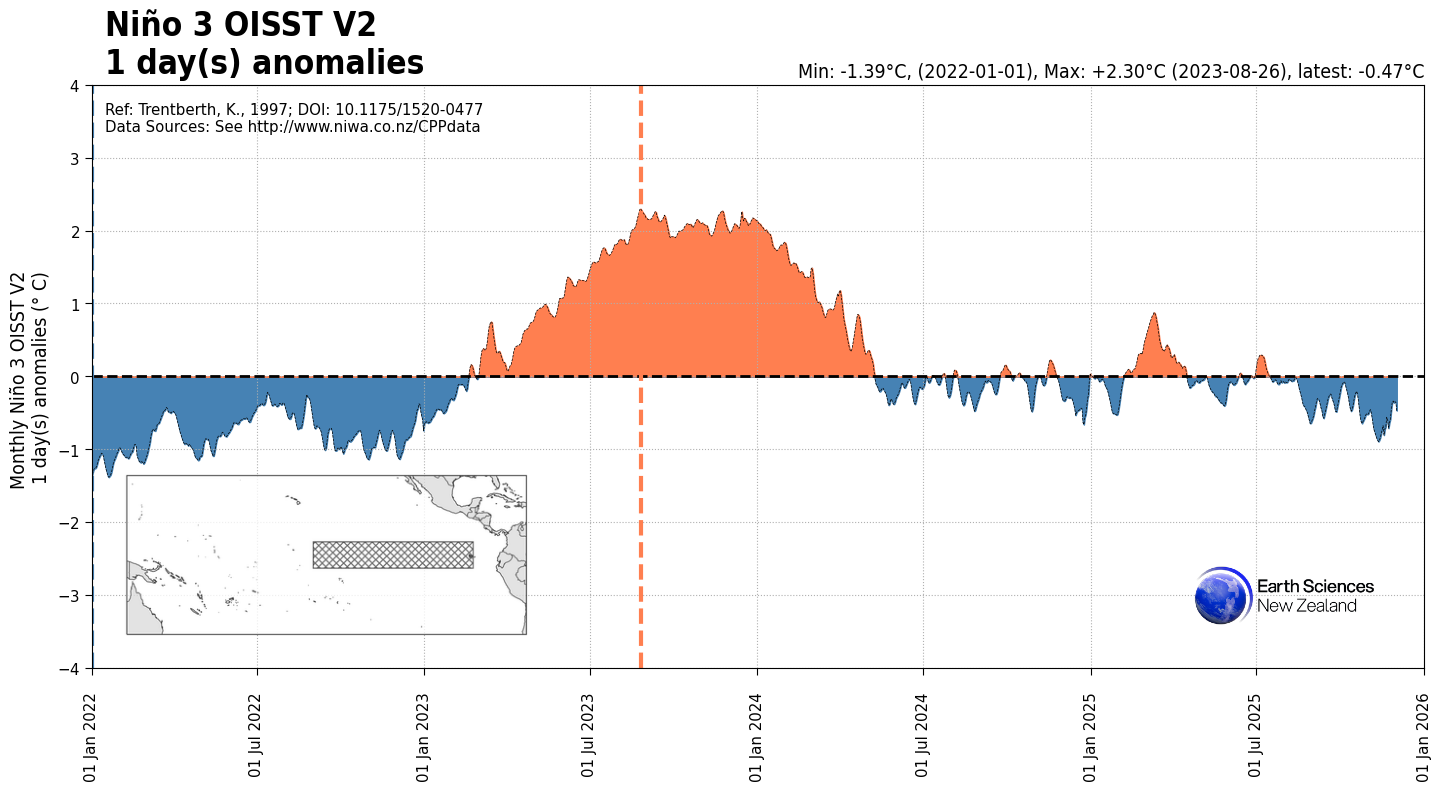
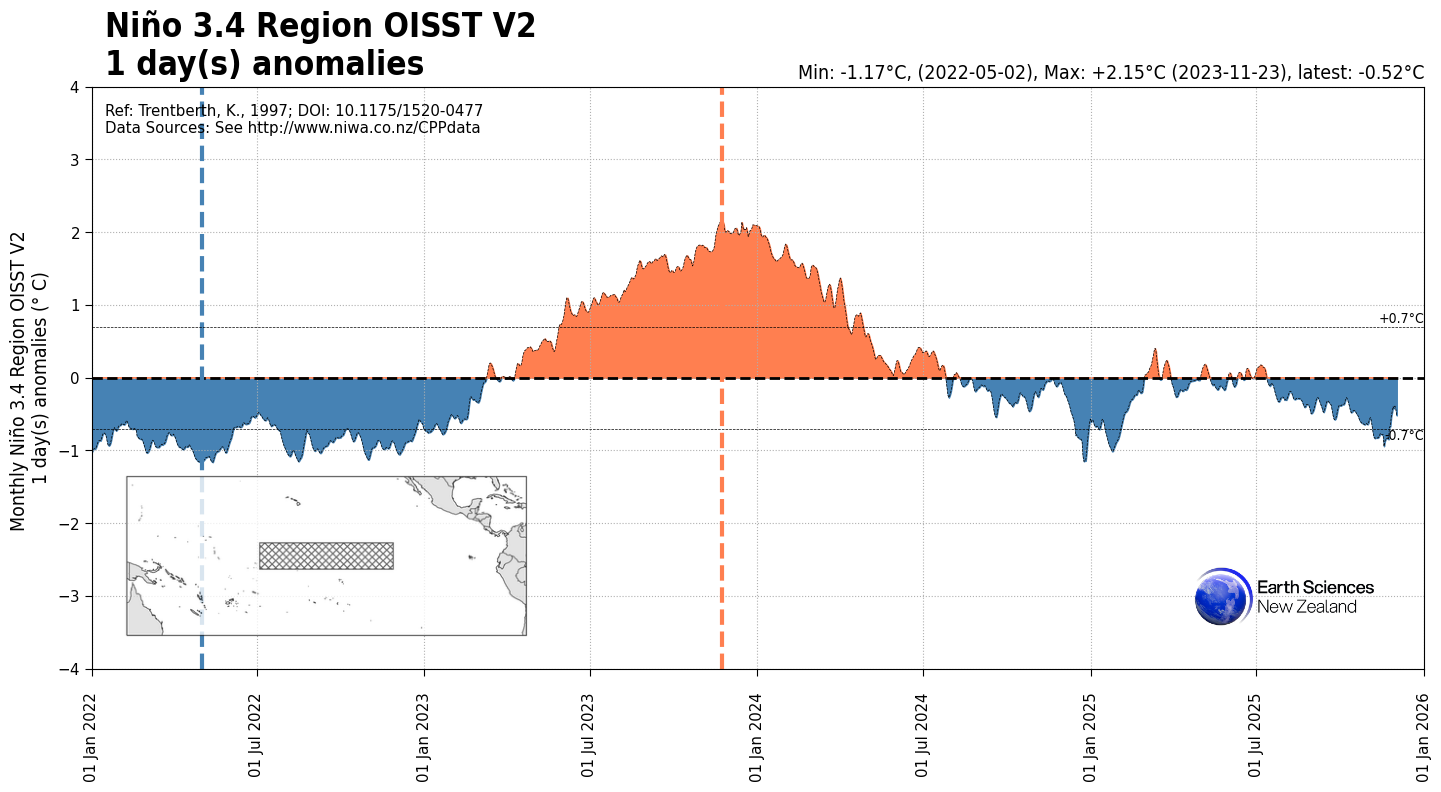
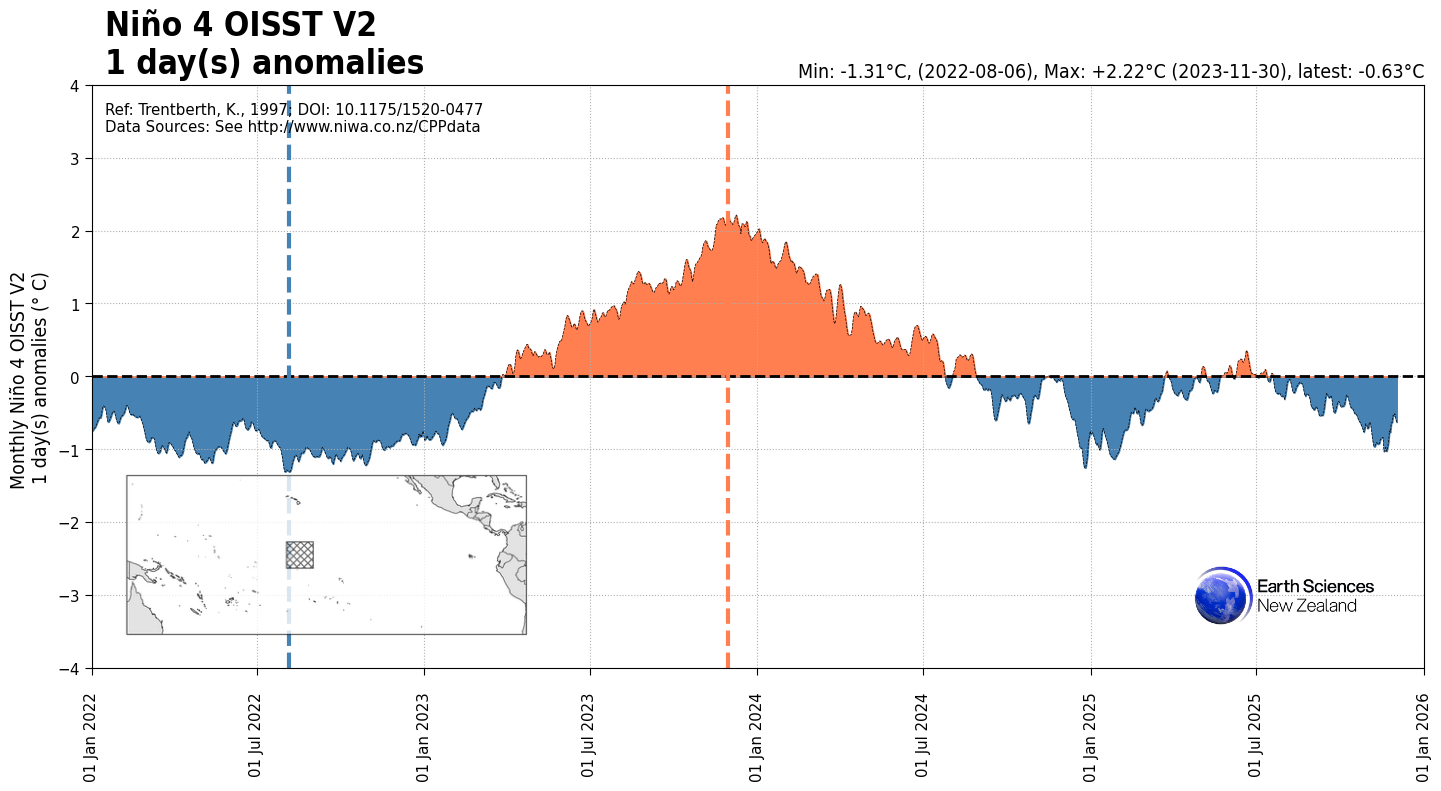
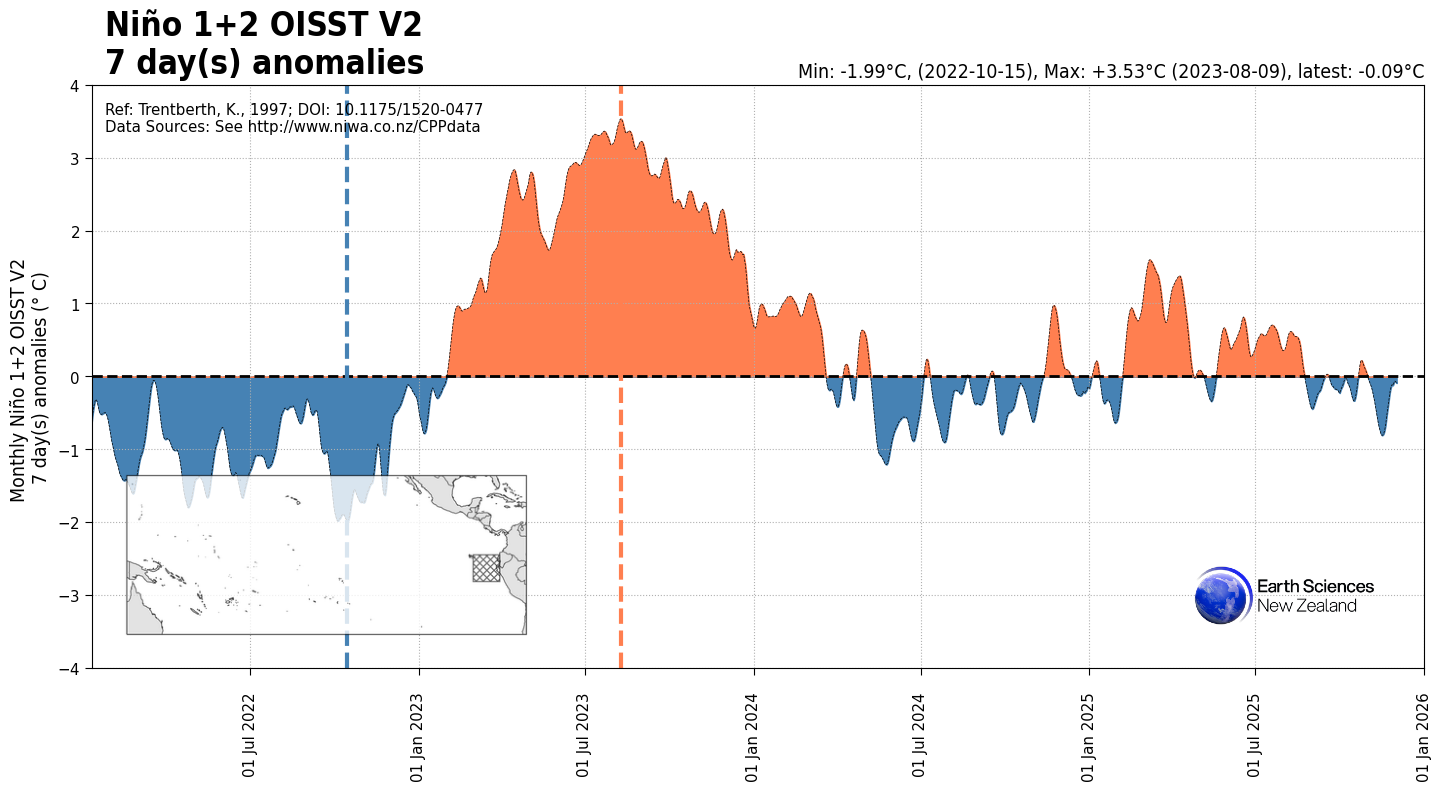
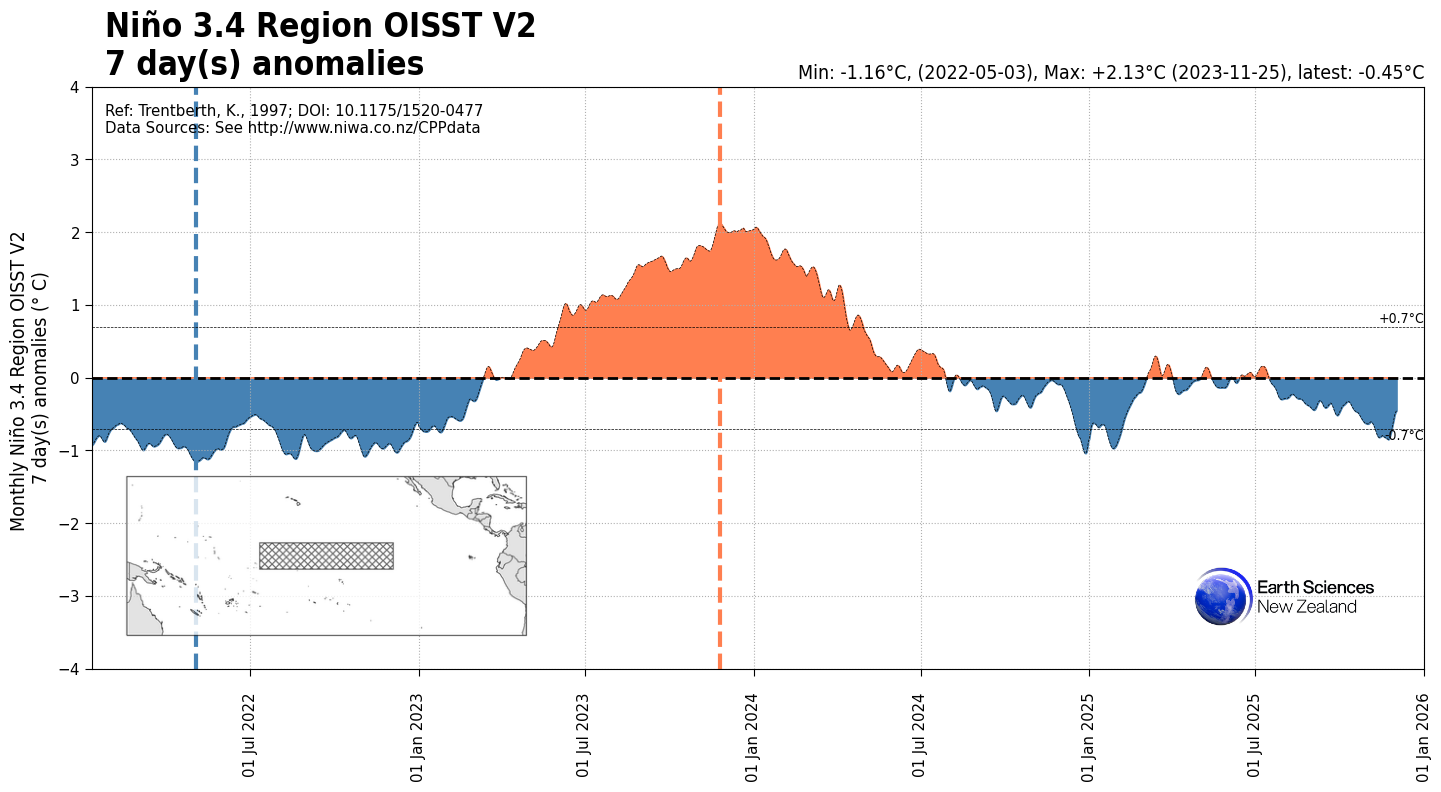
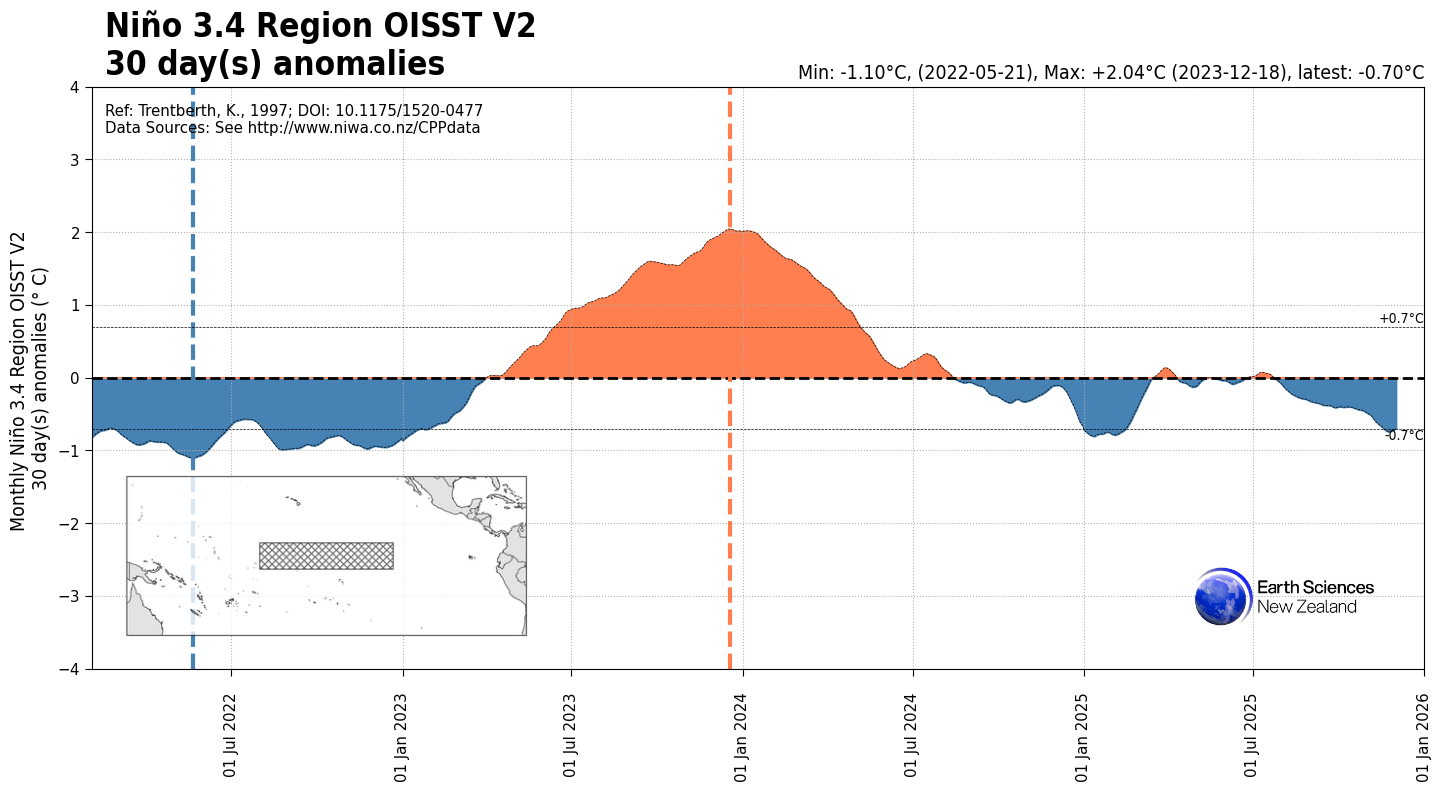
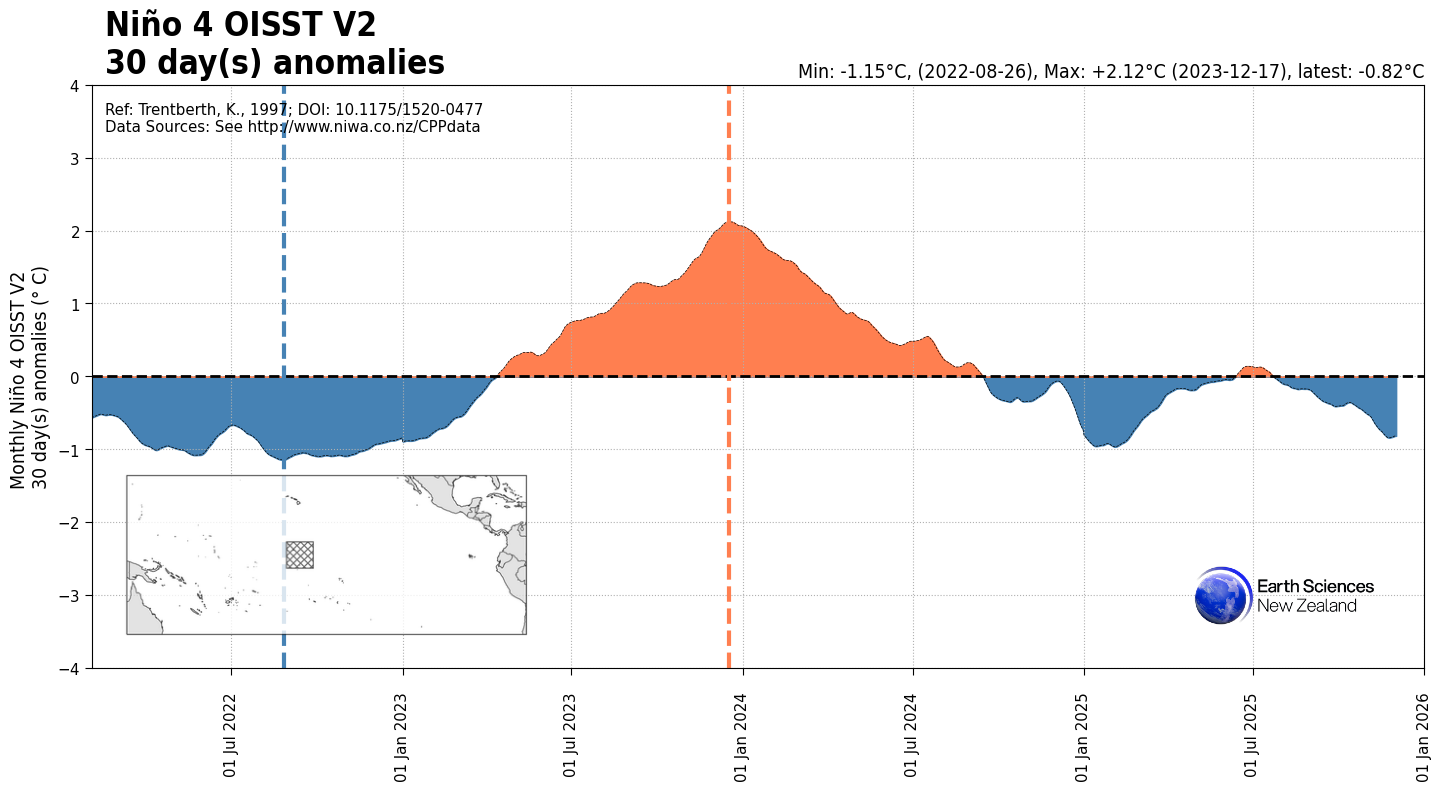
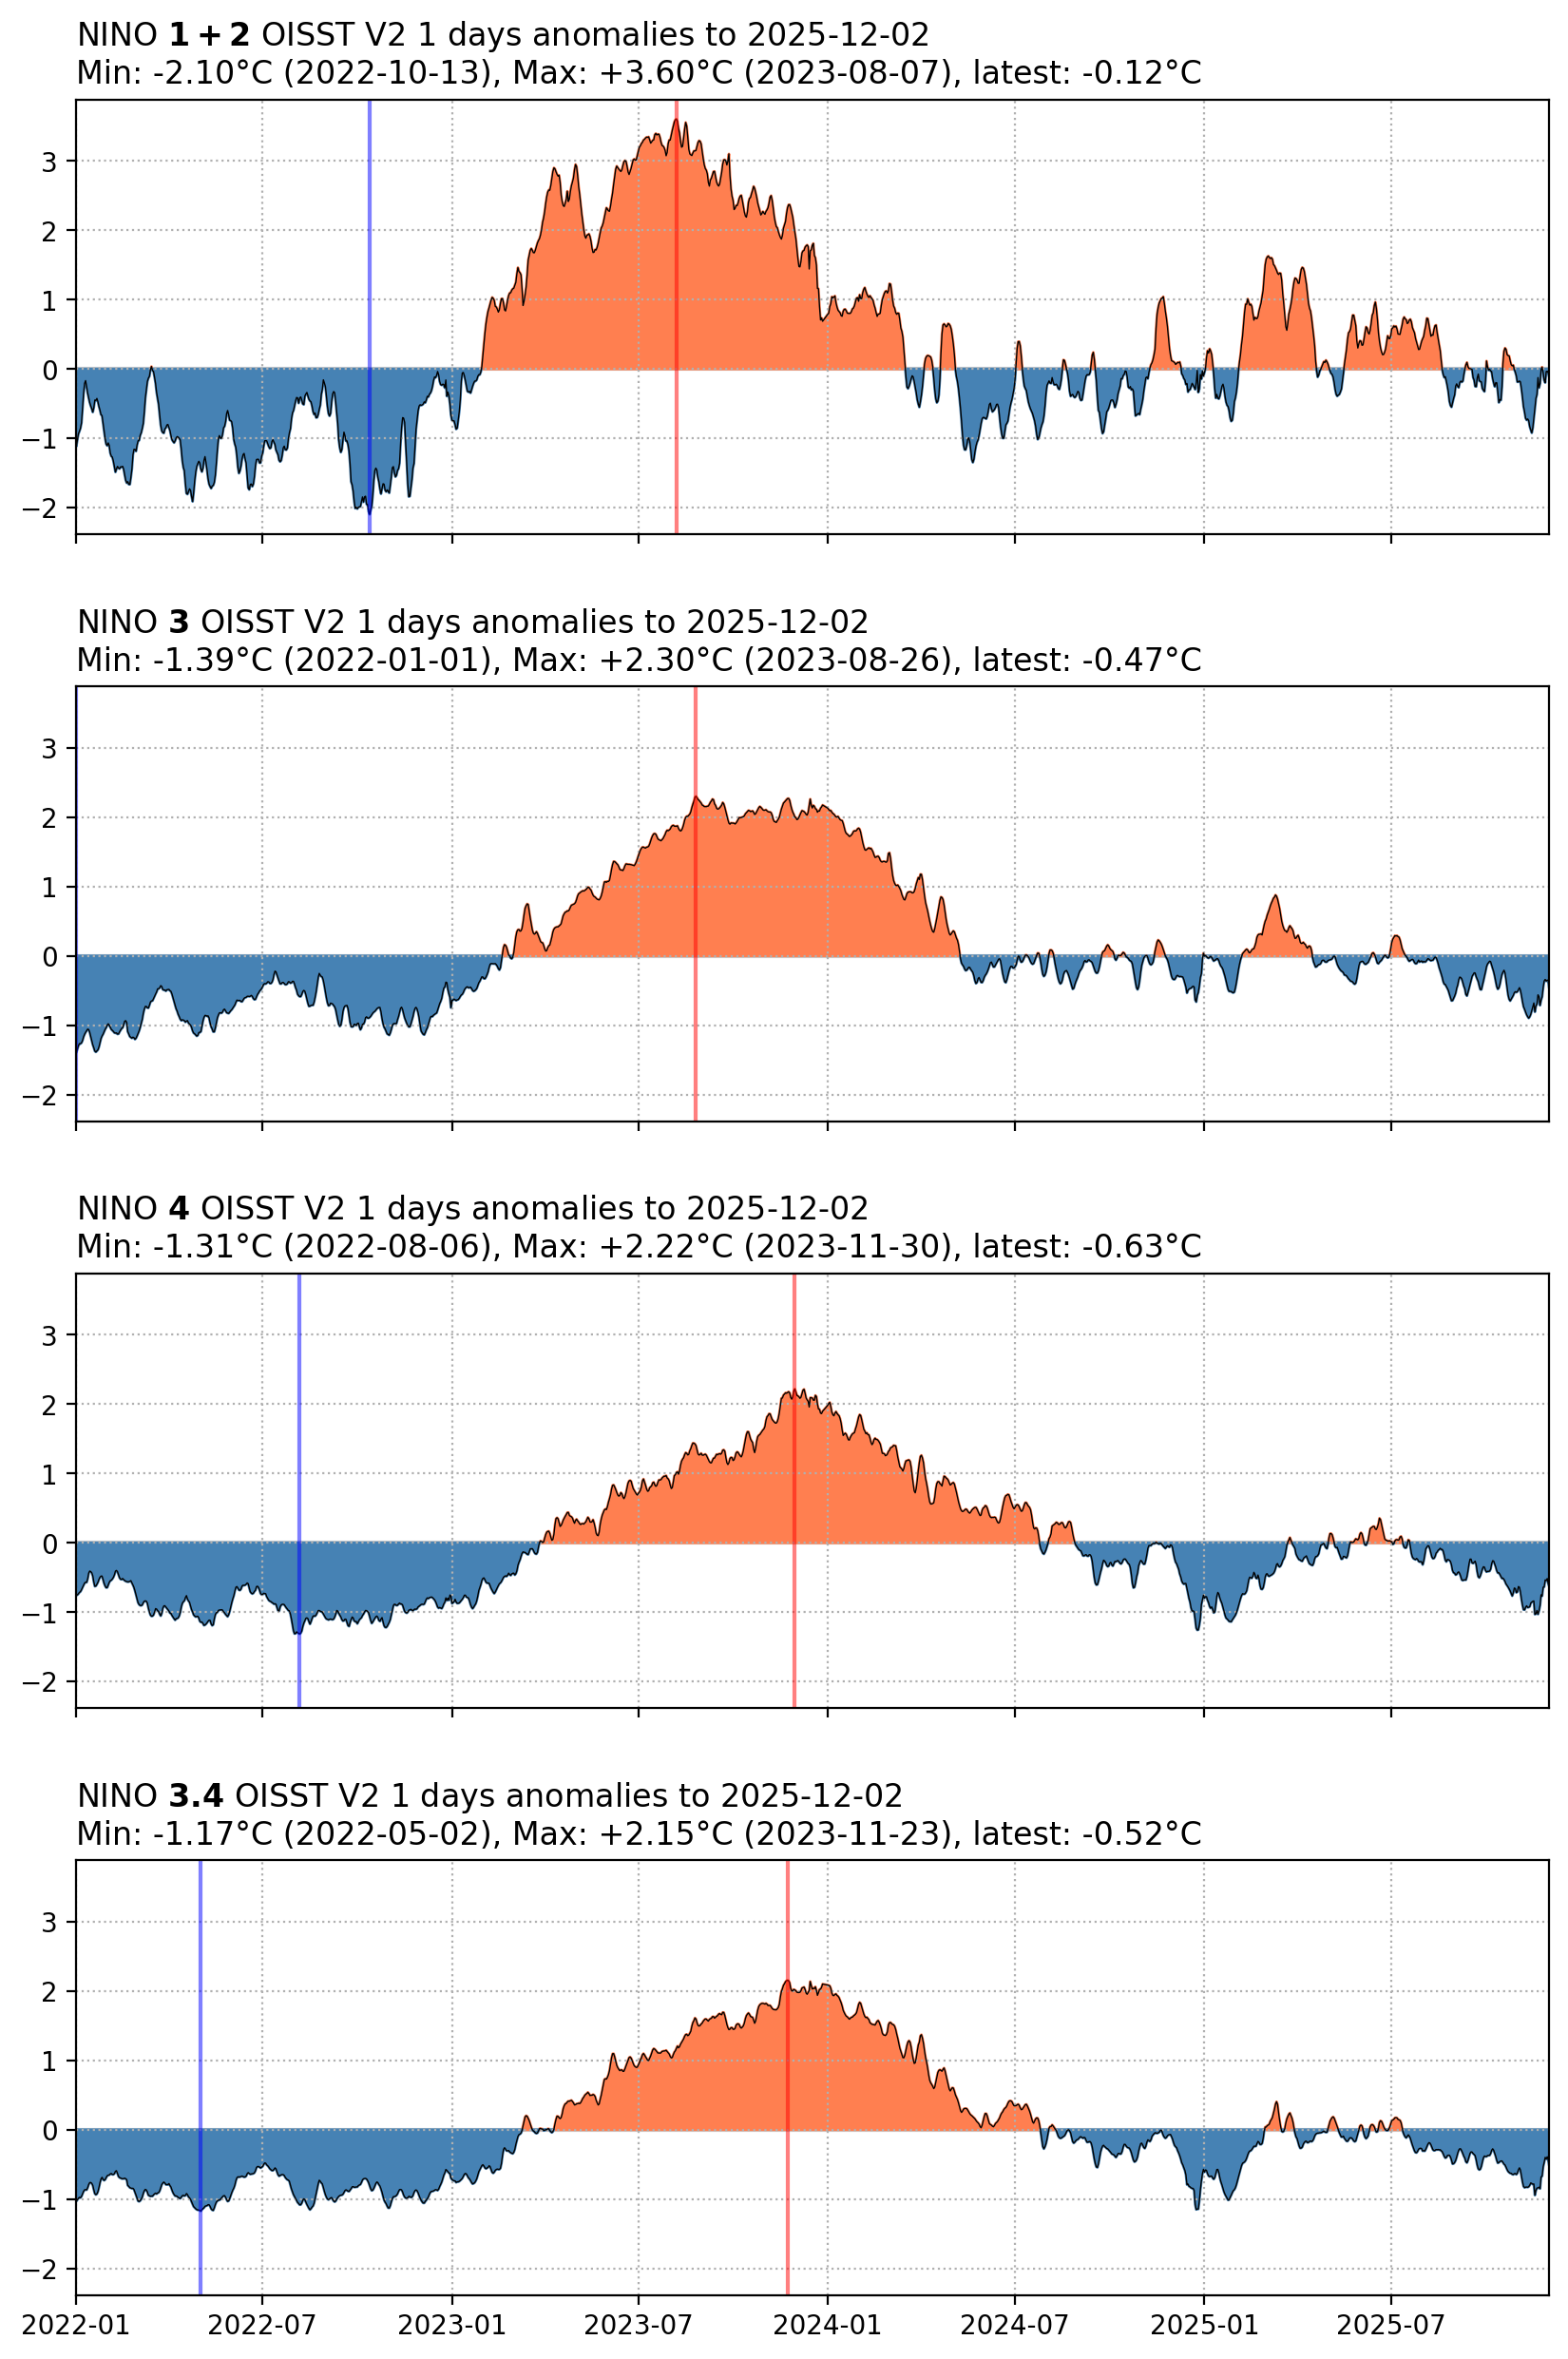
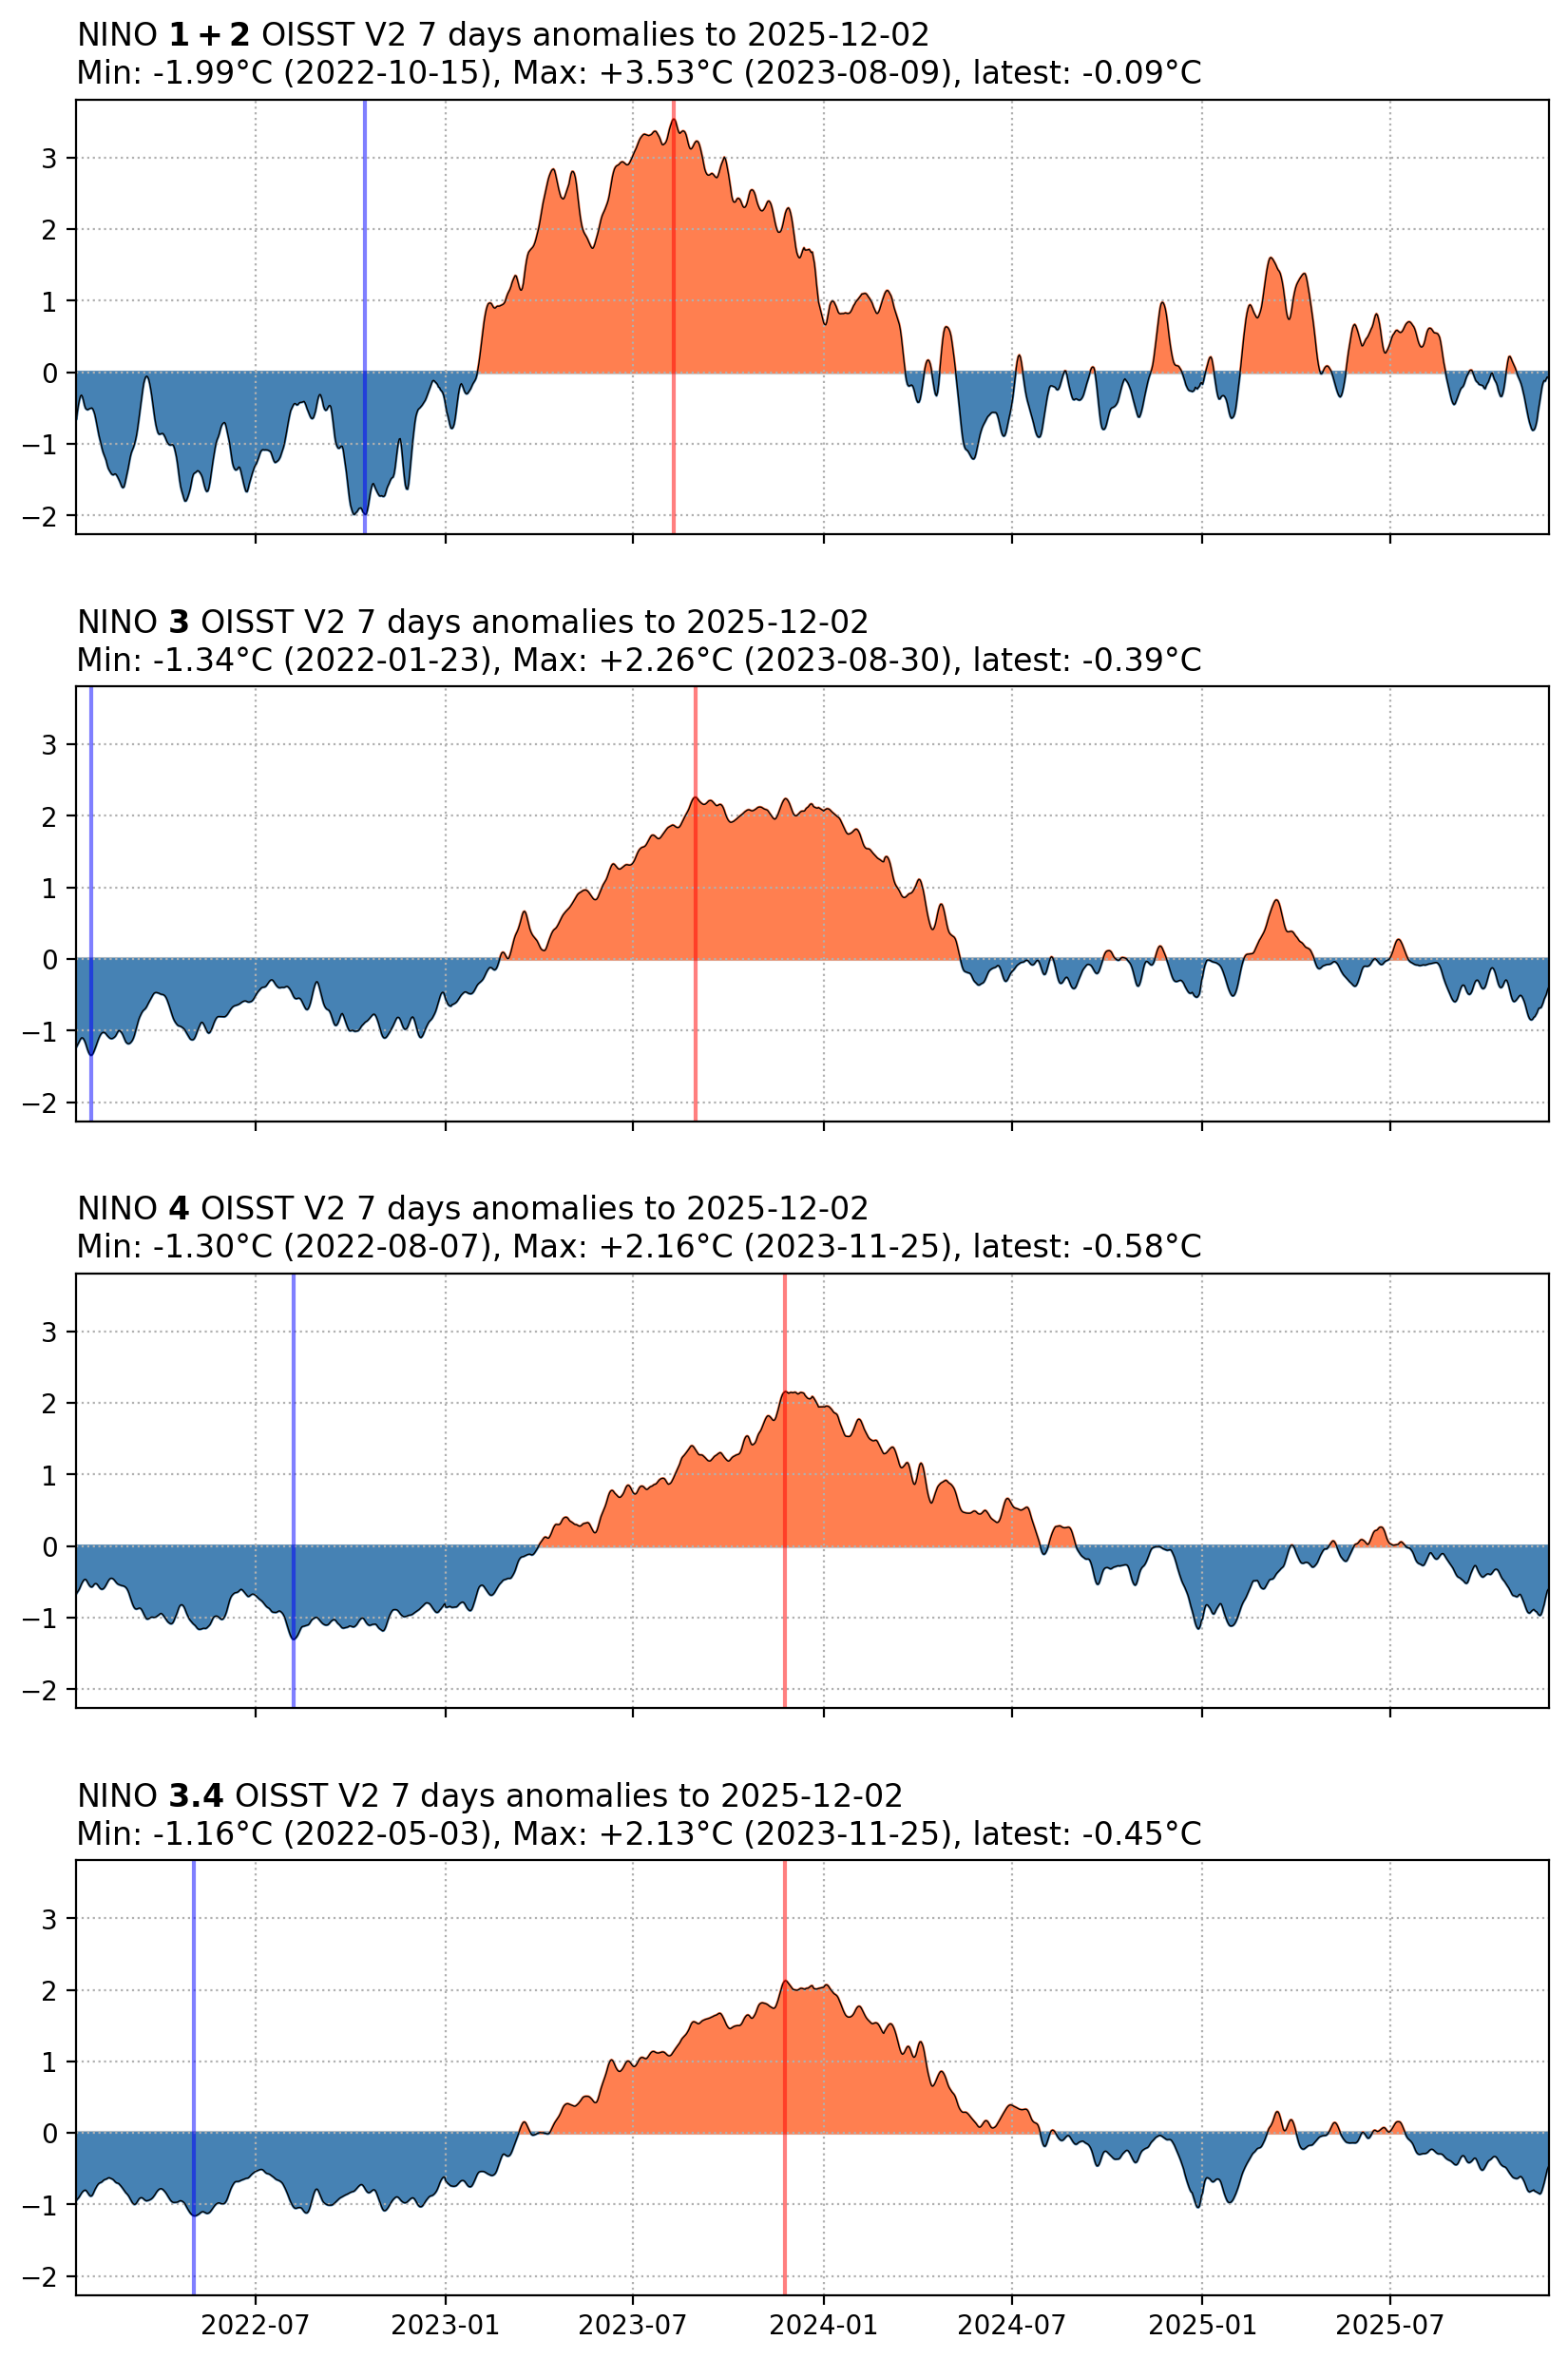
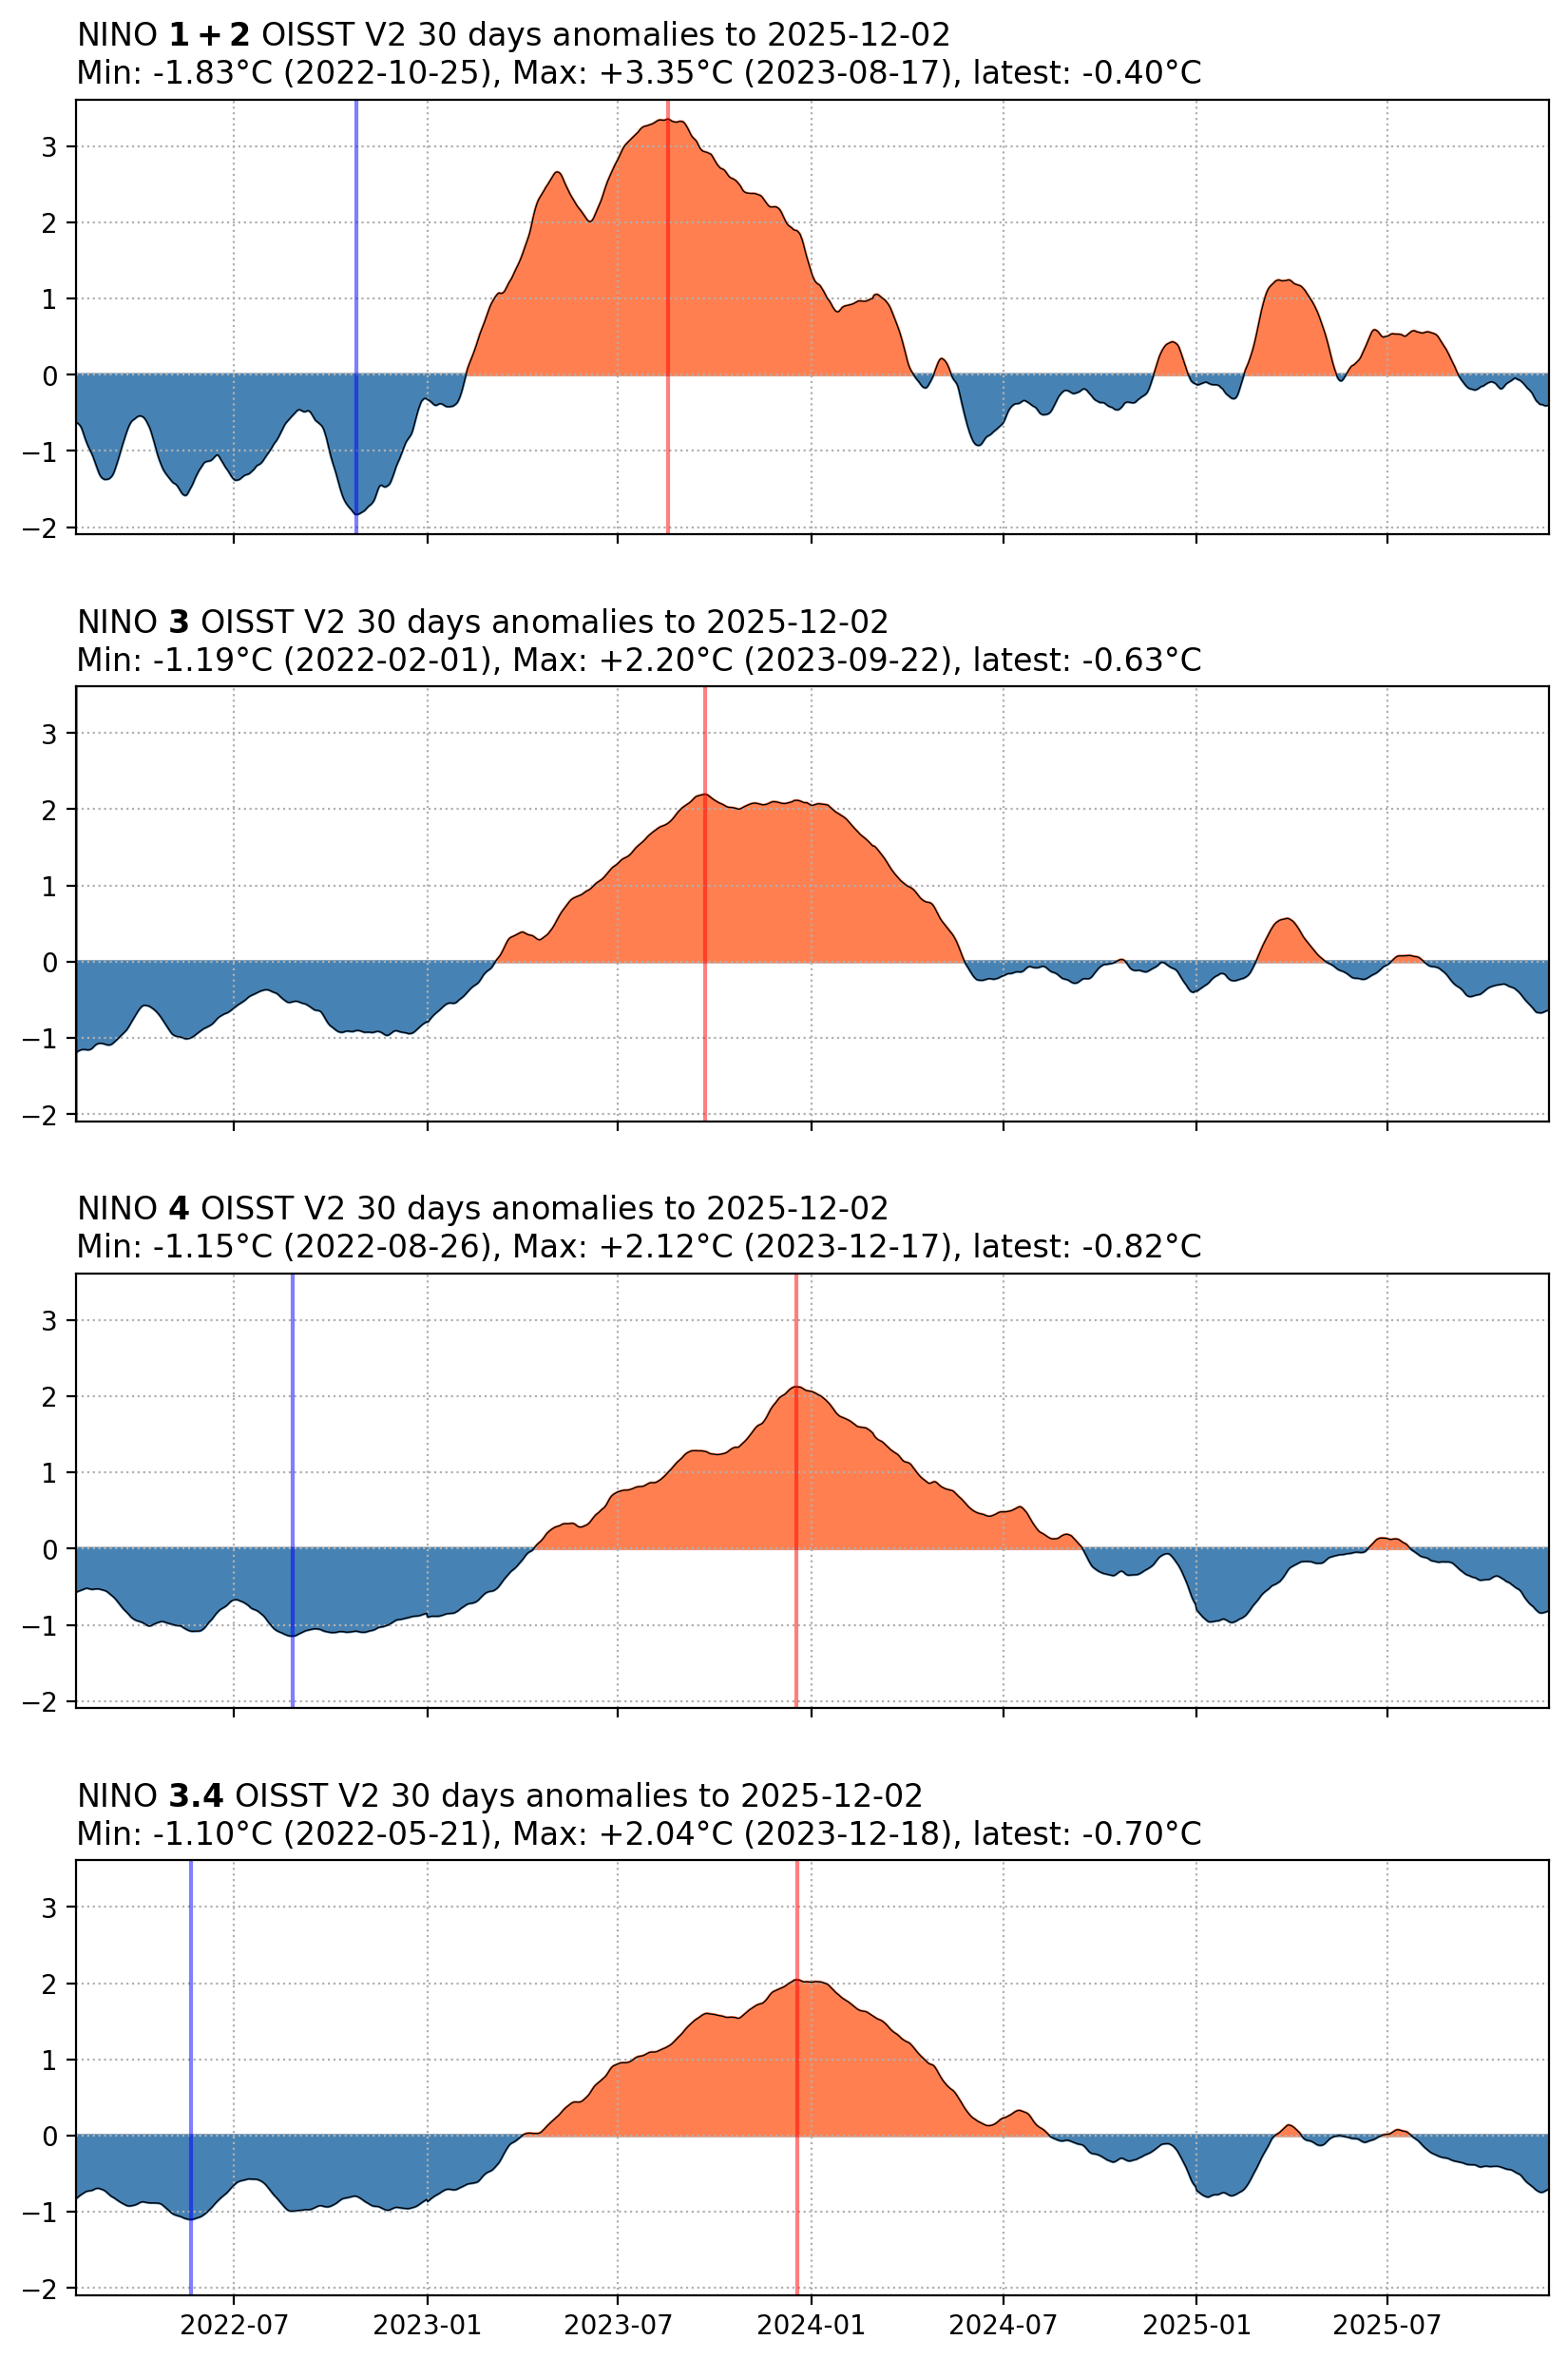
NINO regions (Read me)
-------- PLOTS:
1-day anomalies ---> (NINO1+2) (NINO3) (NINO3.4) (NINO4)
7-day anomalies ---> (NINO1+2) (NINO3) (NINO3.4) (NINO4)
30-day anomalies ---> (NINO1+2) (NINO3) (NINO3.4) (NINO4)
Stack; anomalies all NINO regions ---> (1-day) (7-day) (30-day)
-------- DATA: Anomalies for NINO regions, last 4 years
1-day ---> (Nino1+2, NINO3, NINO3.4, NINO4, ONI)
7-day ---> (Nino1+2, NINO3, NINO3.4, NINO4, ONI)
30-day ---> (Nino1+2, NINO3, NINO3.4, NINO4, ONI)
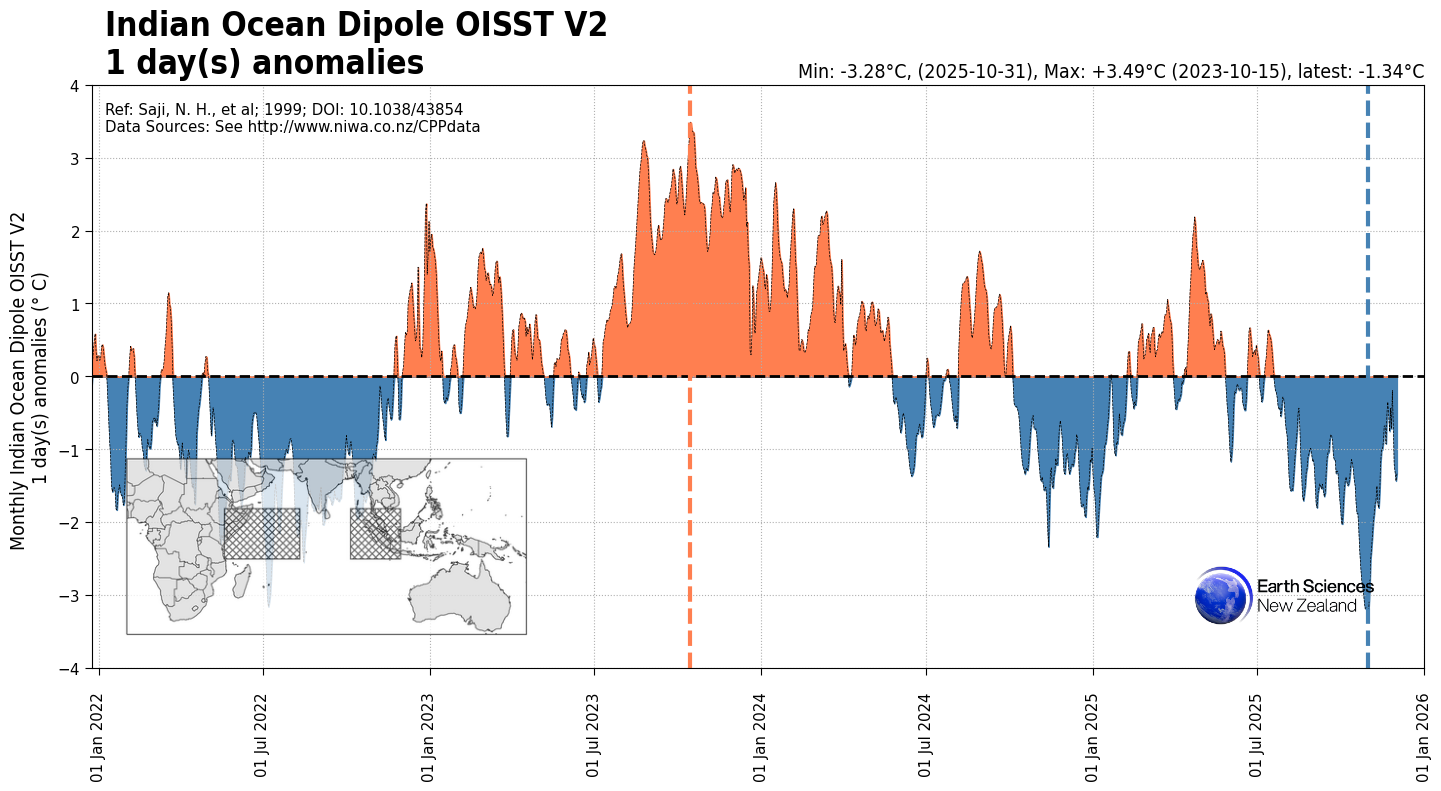
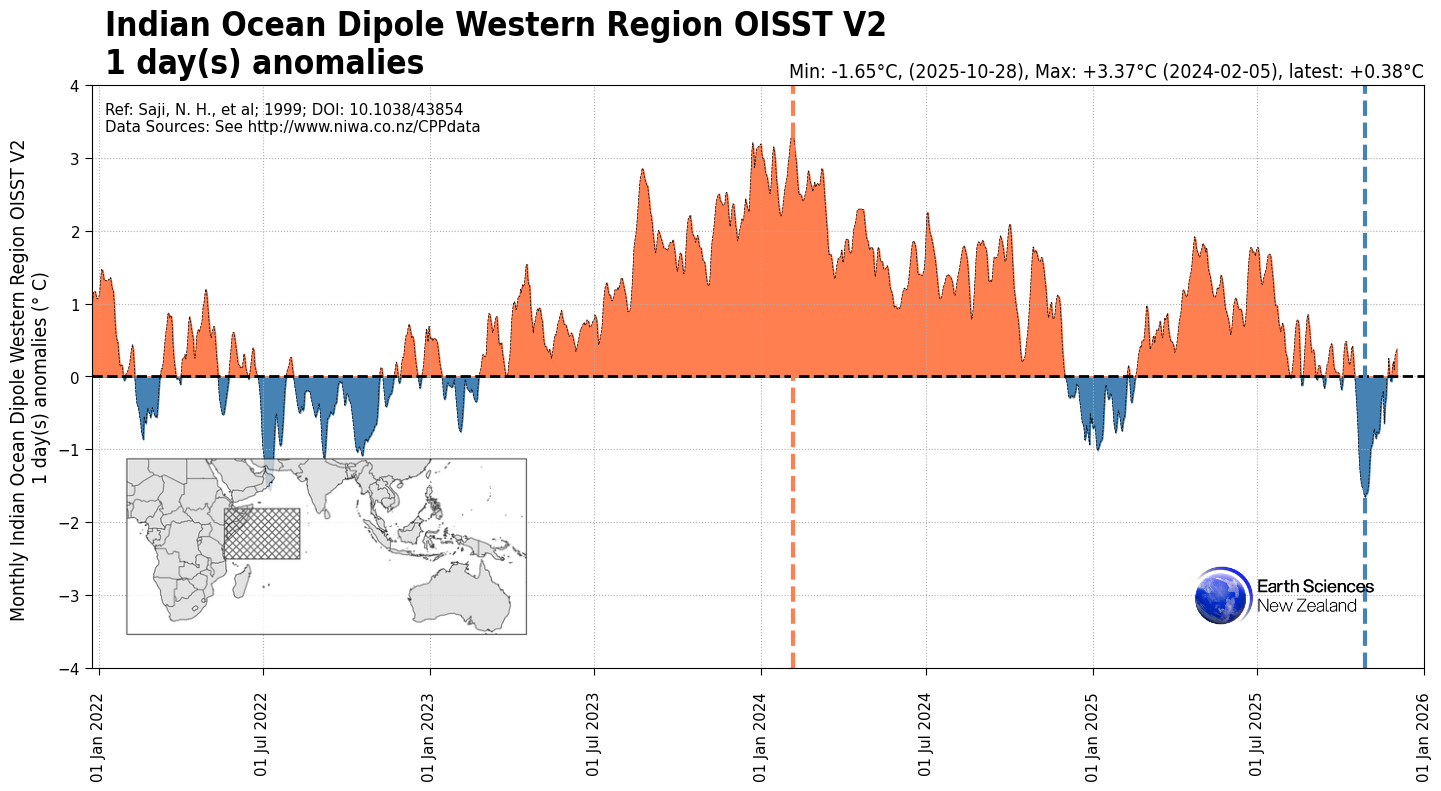
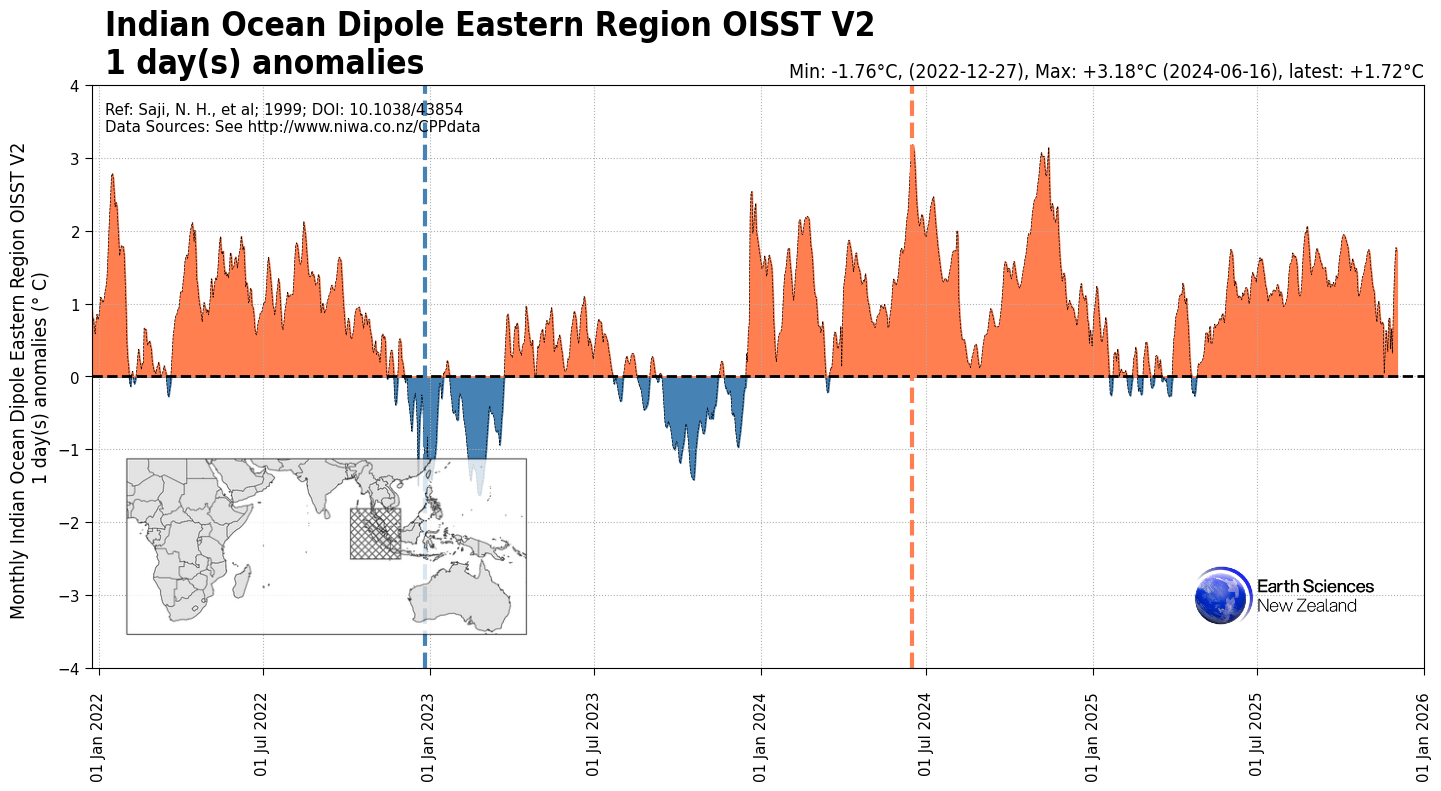
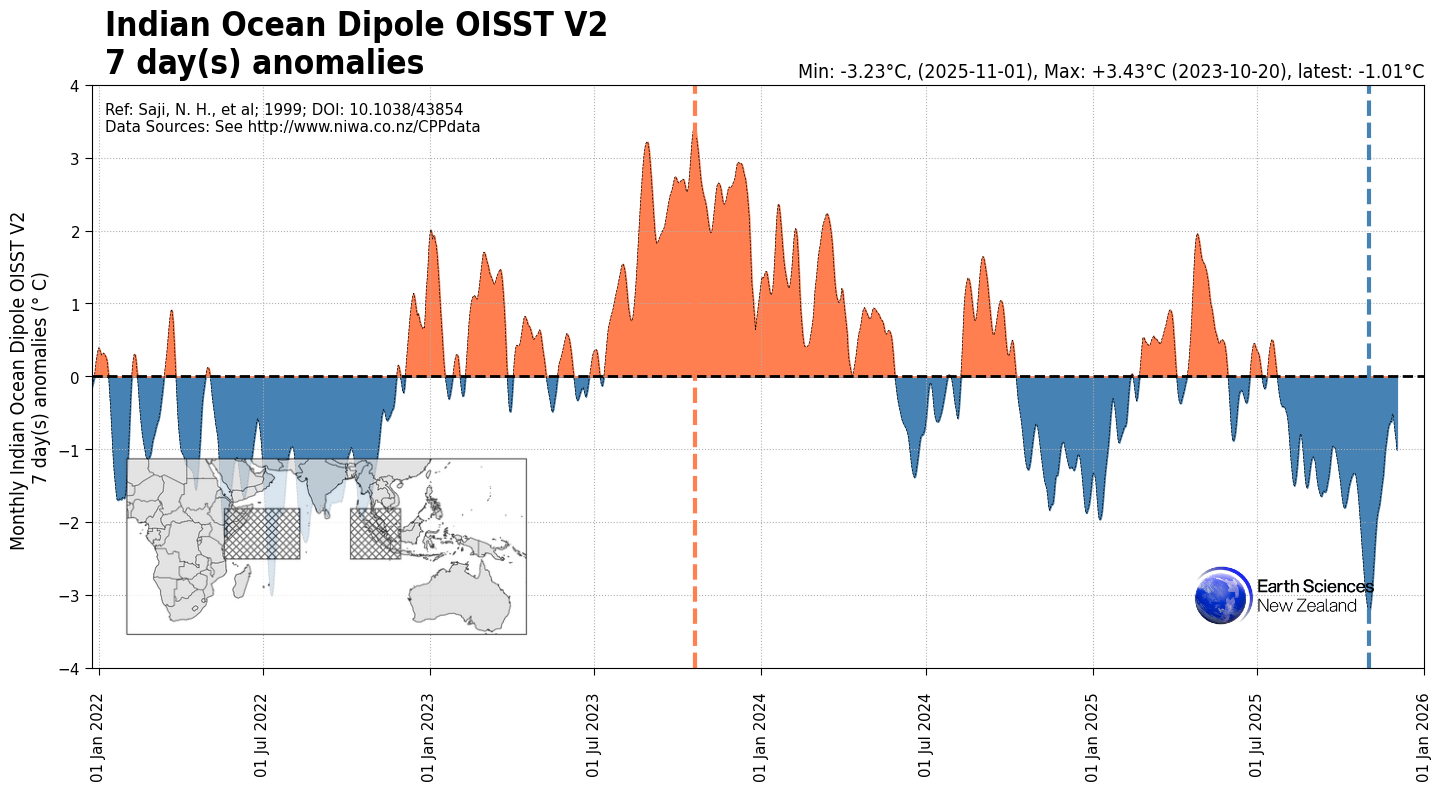
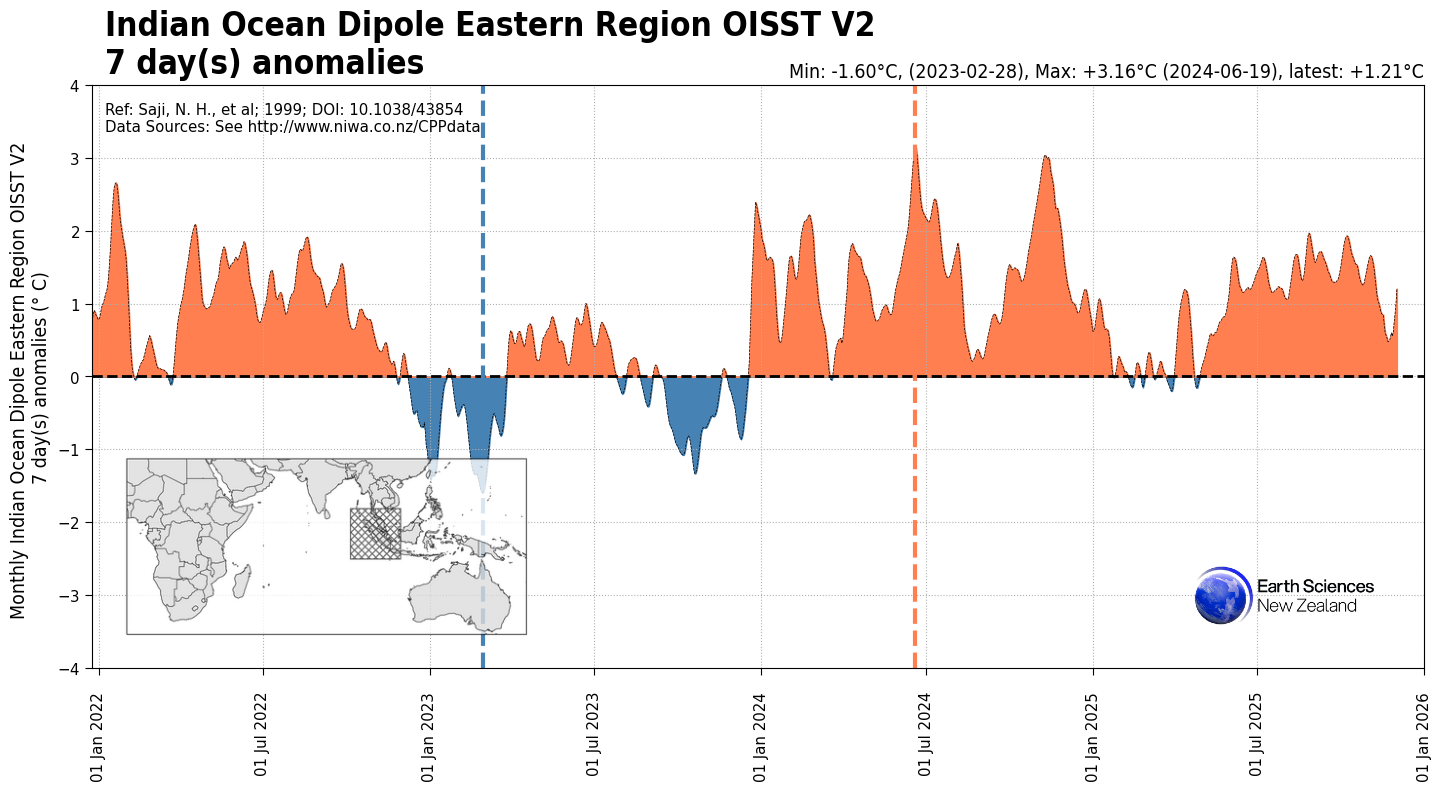
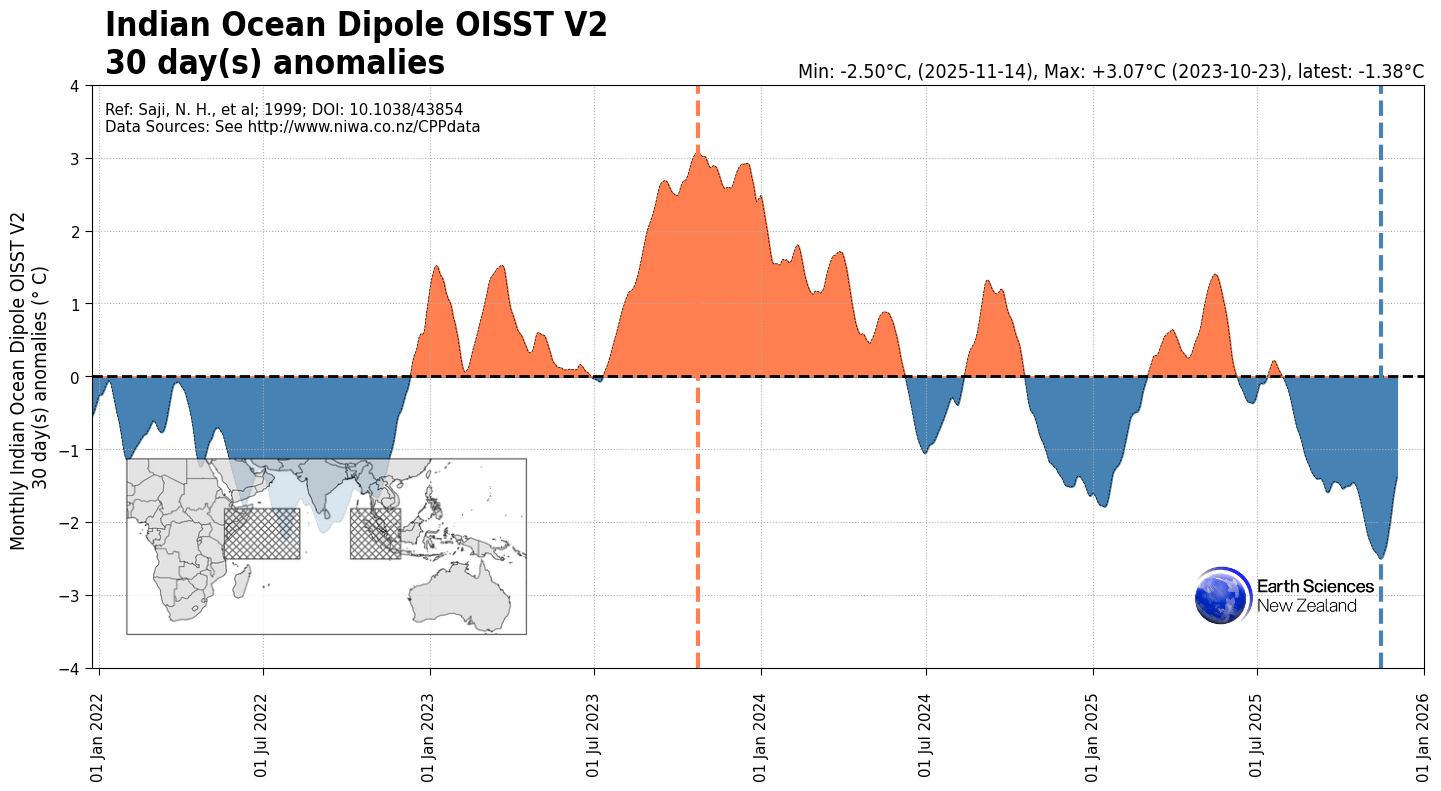
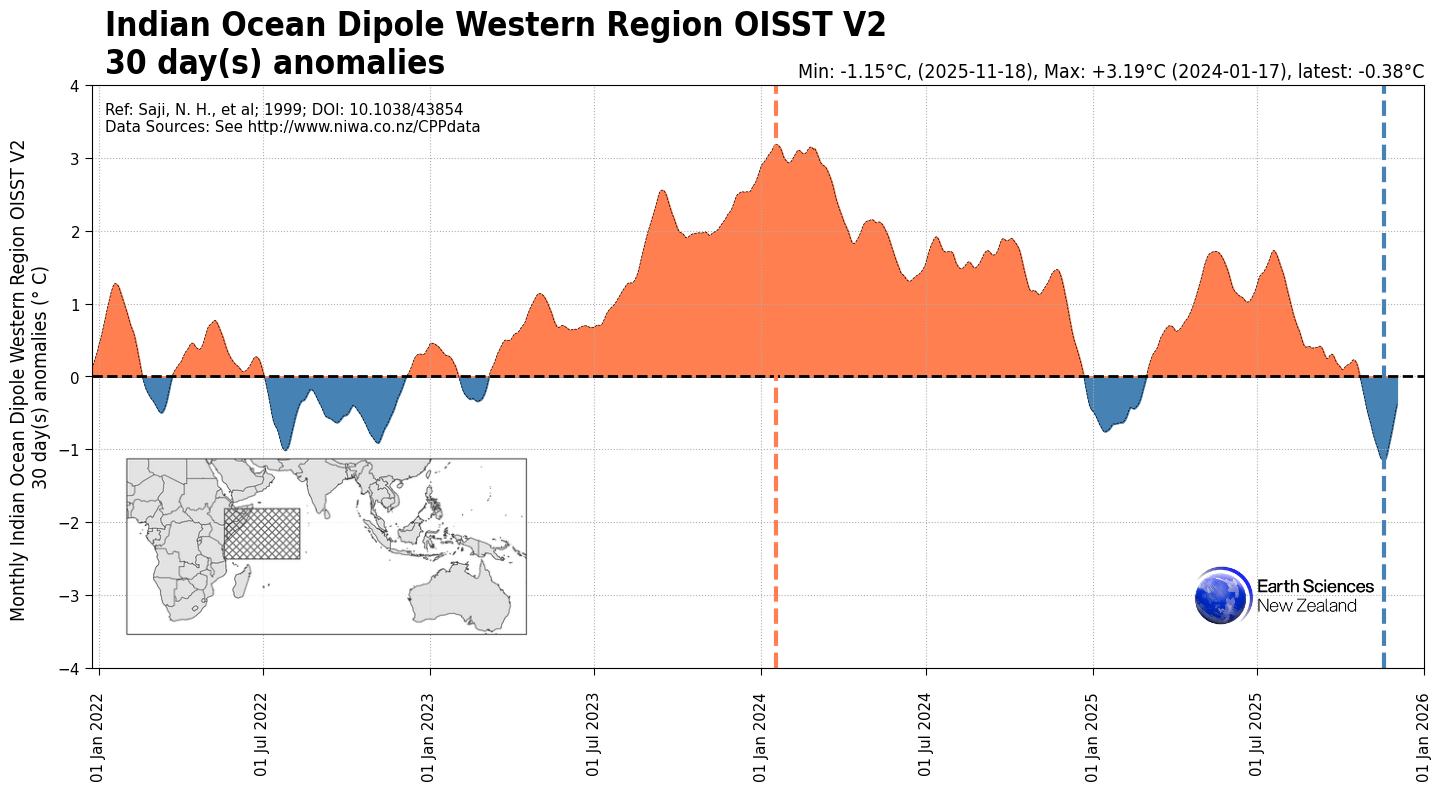
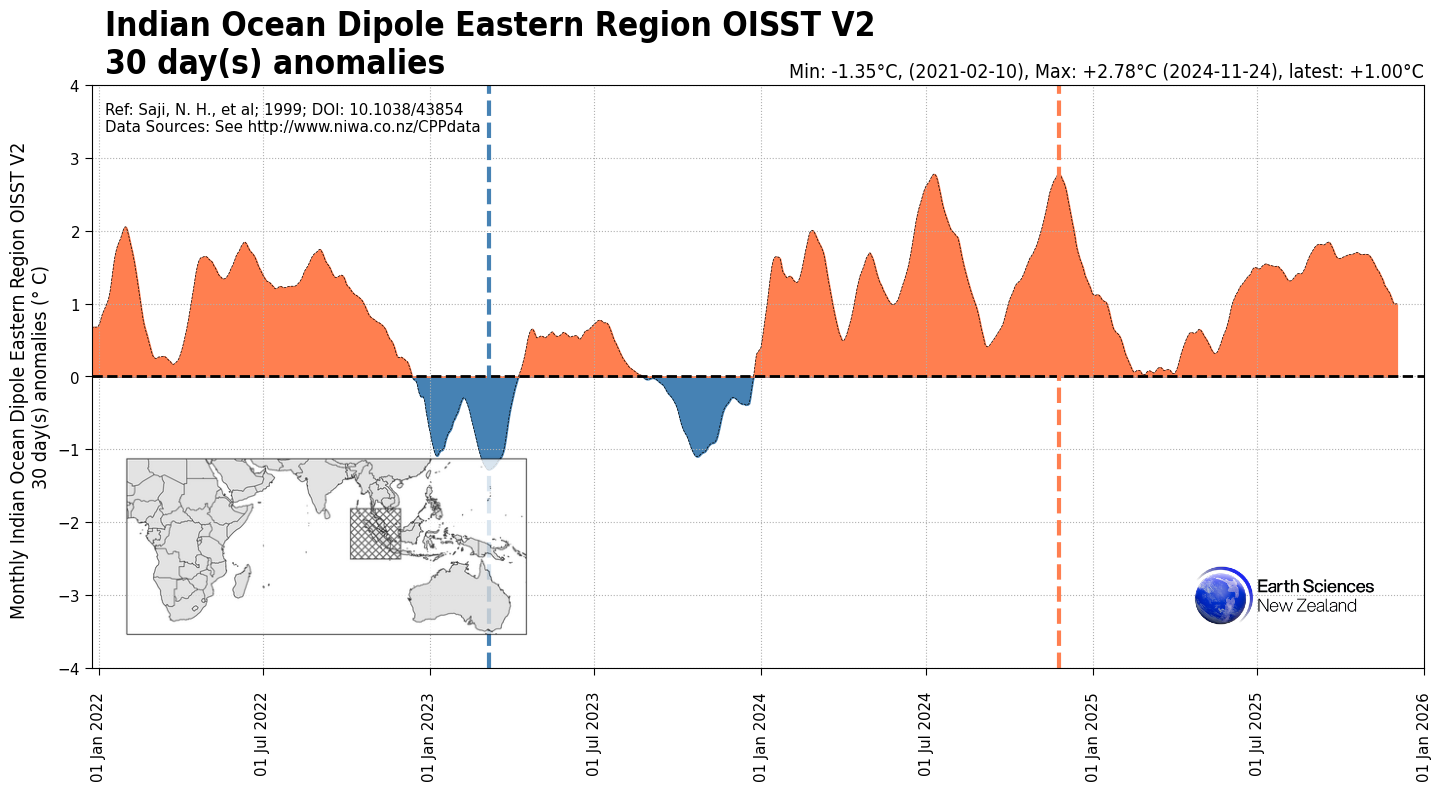
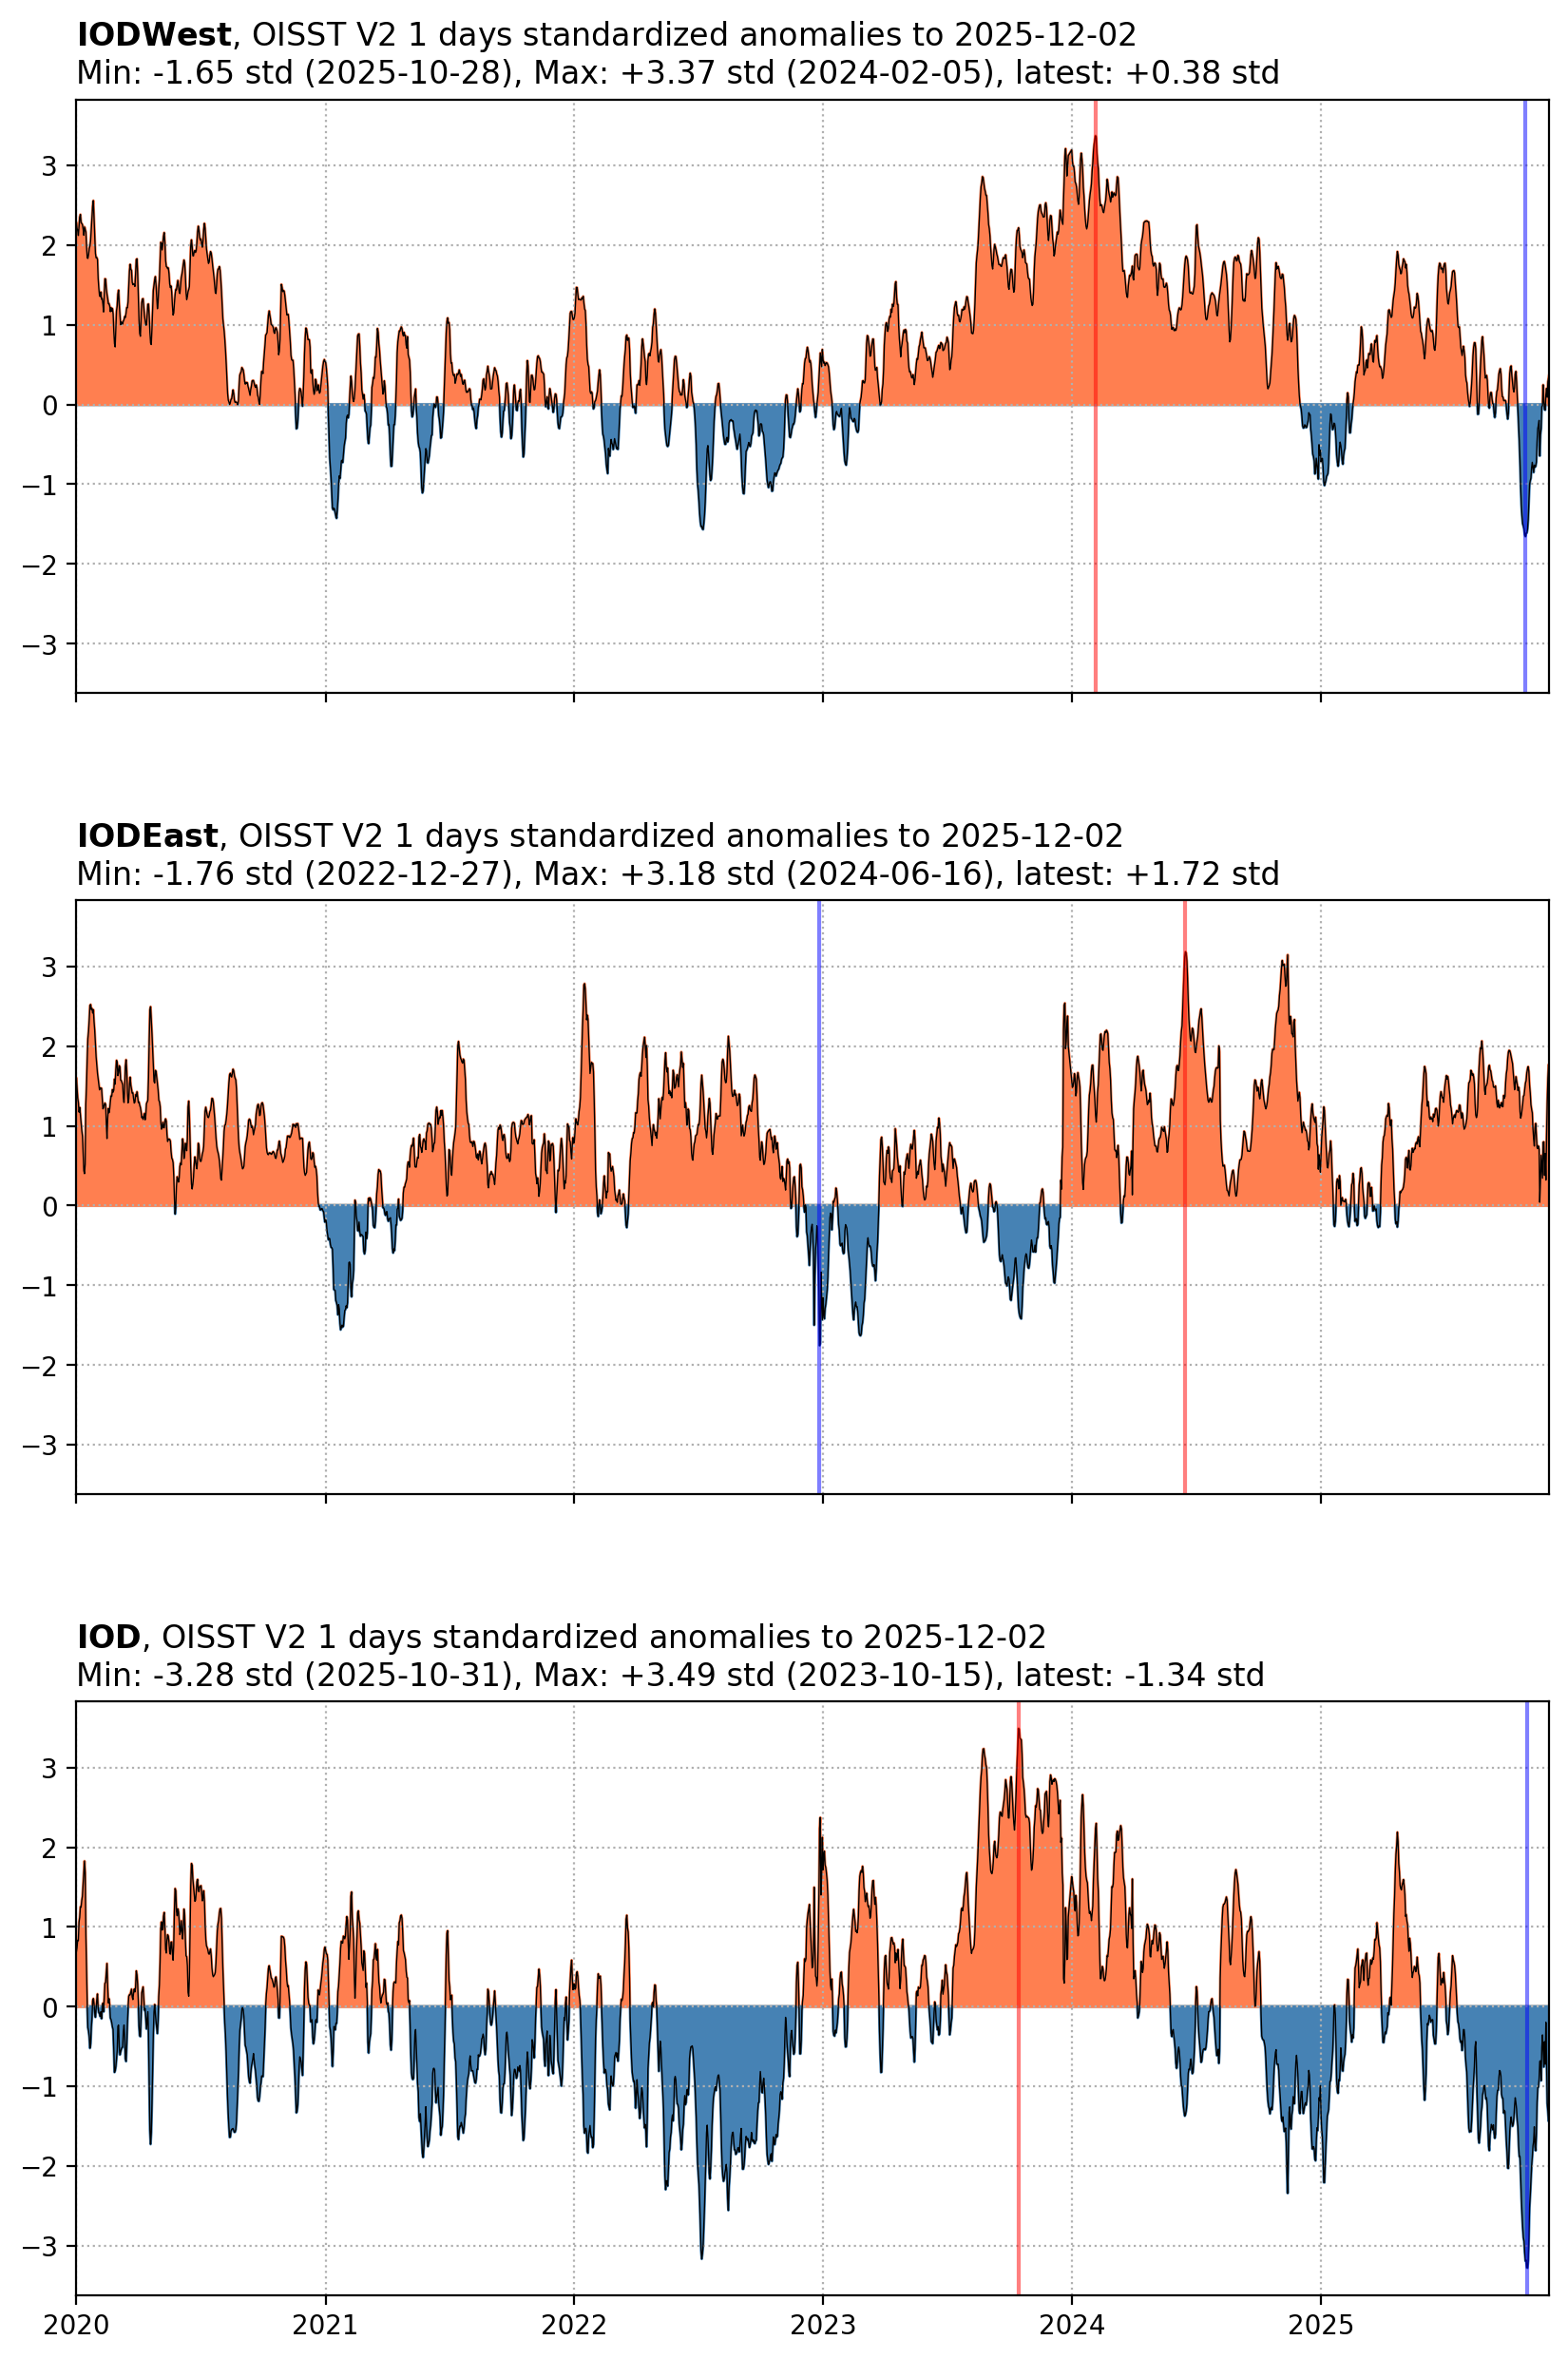
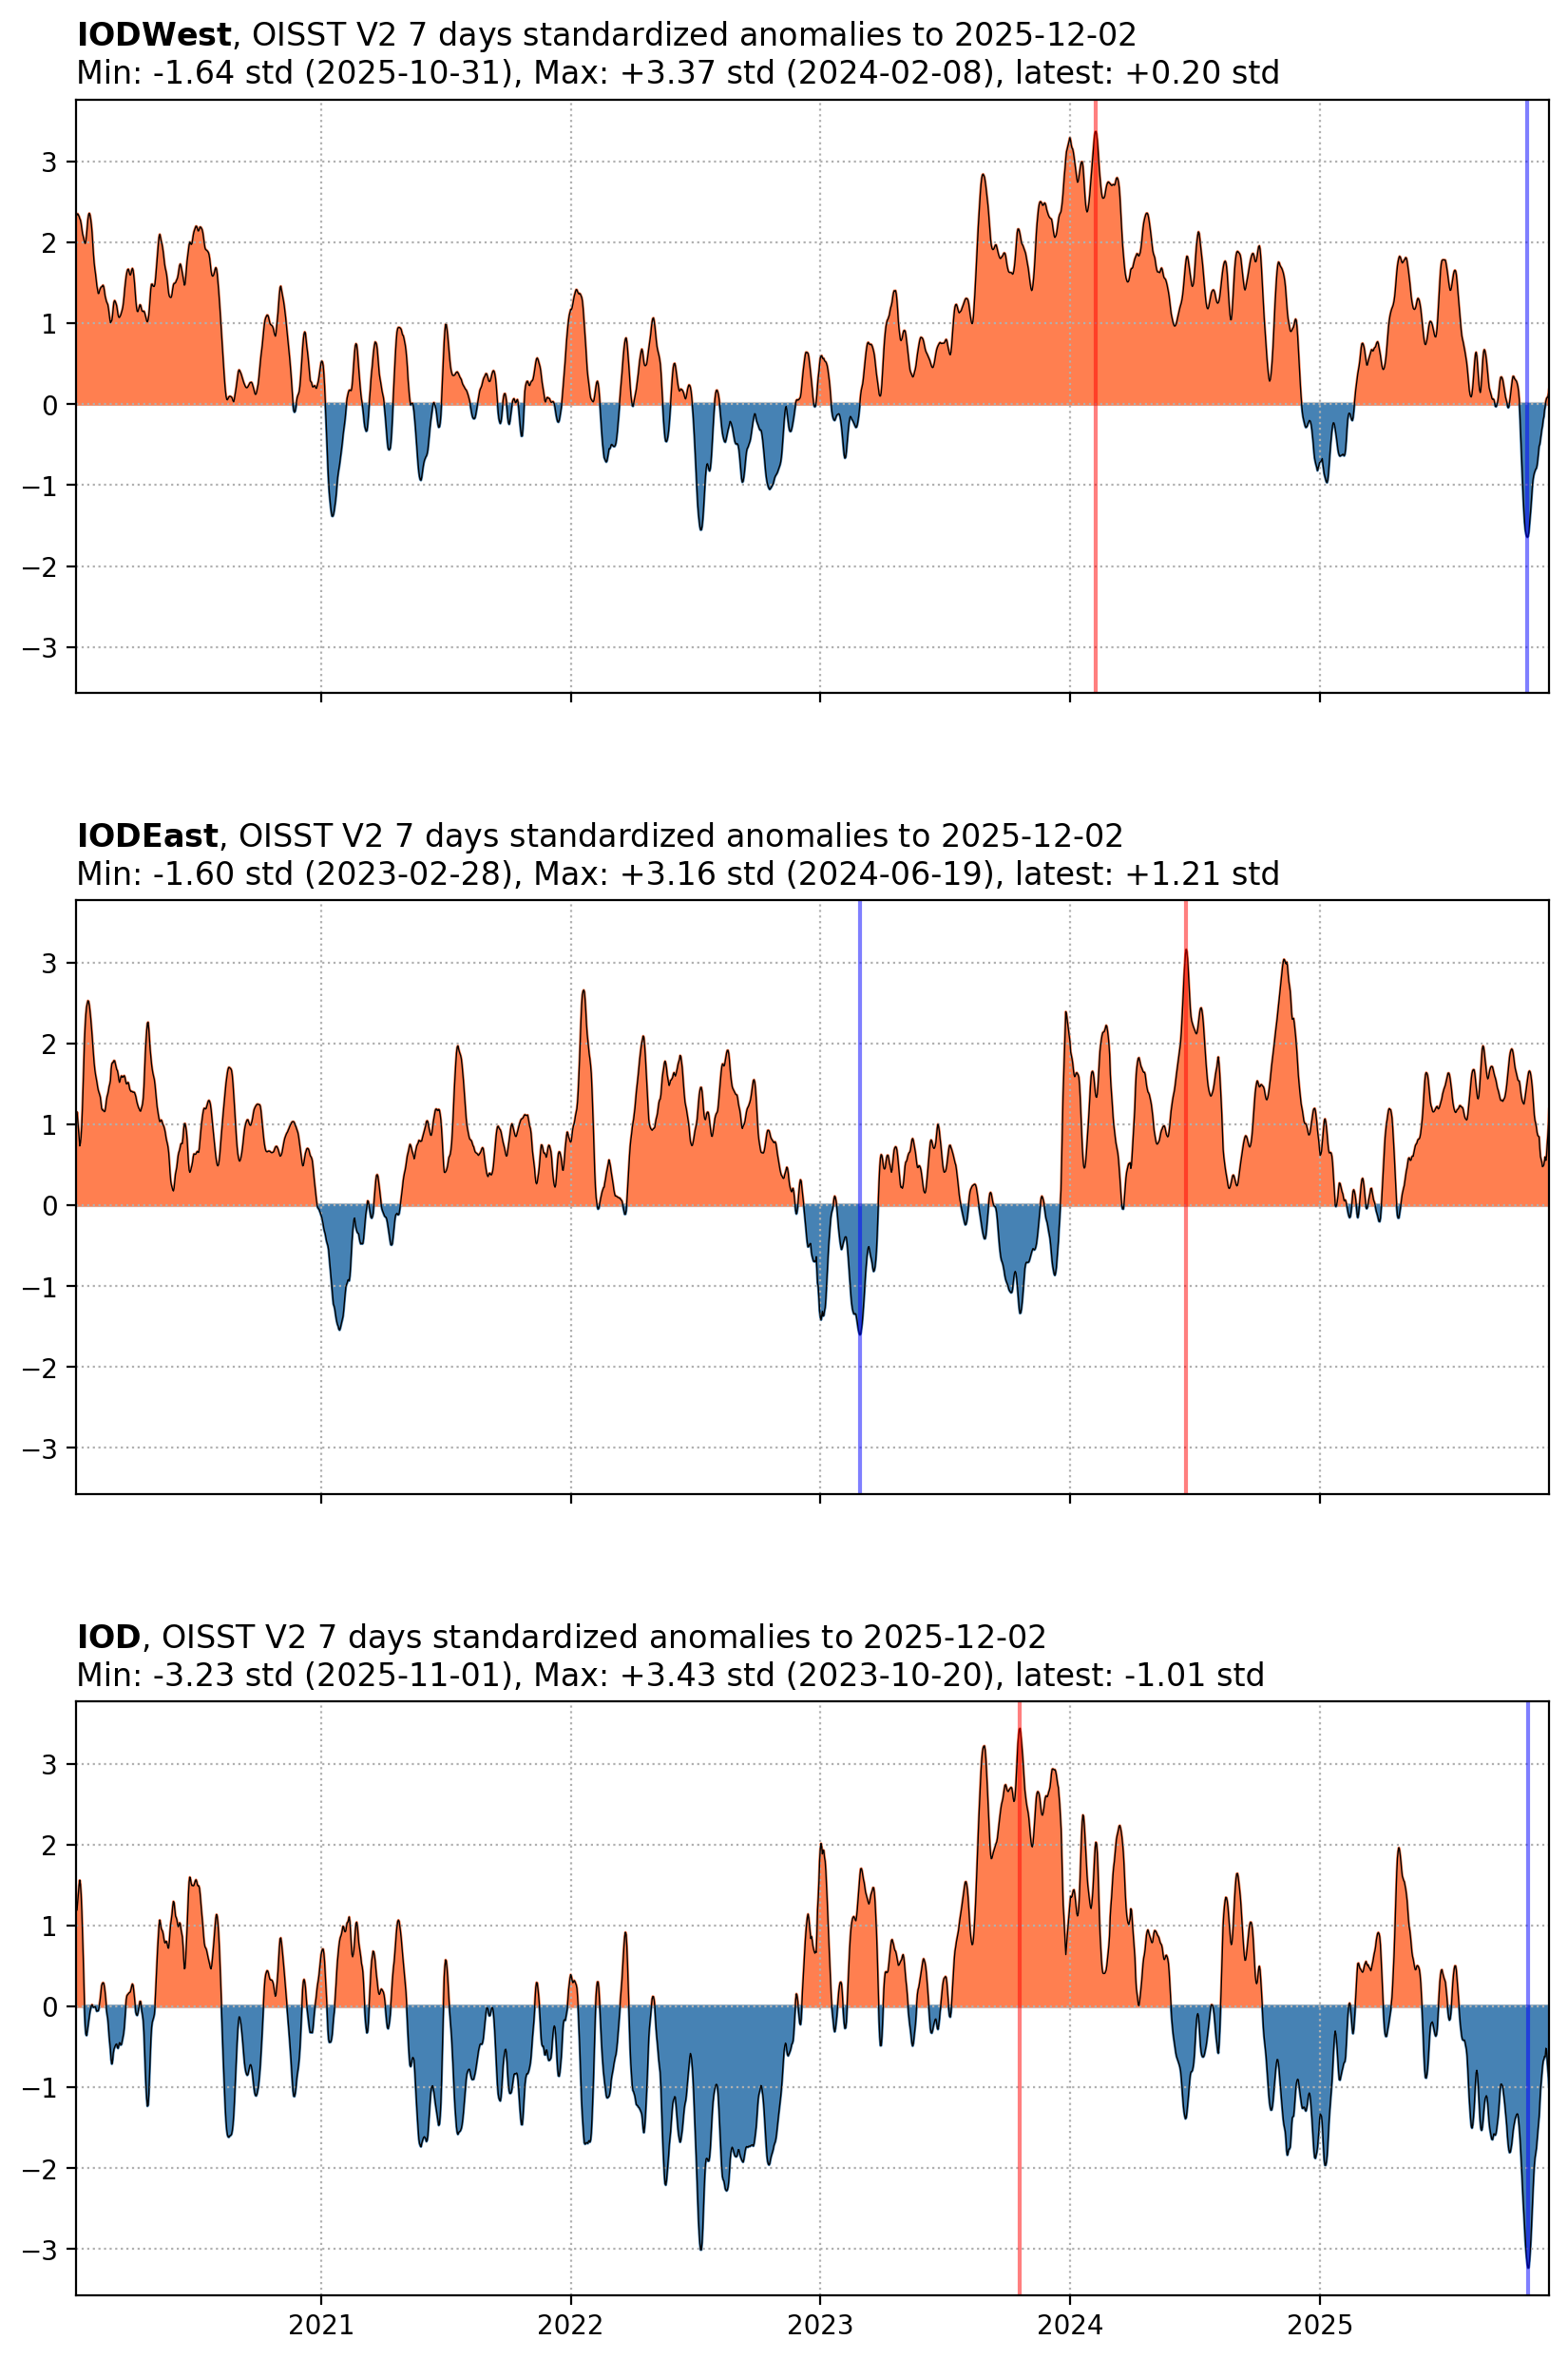
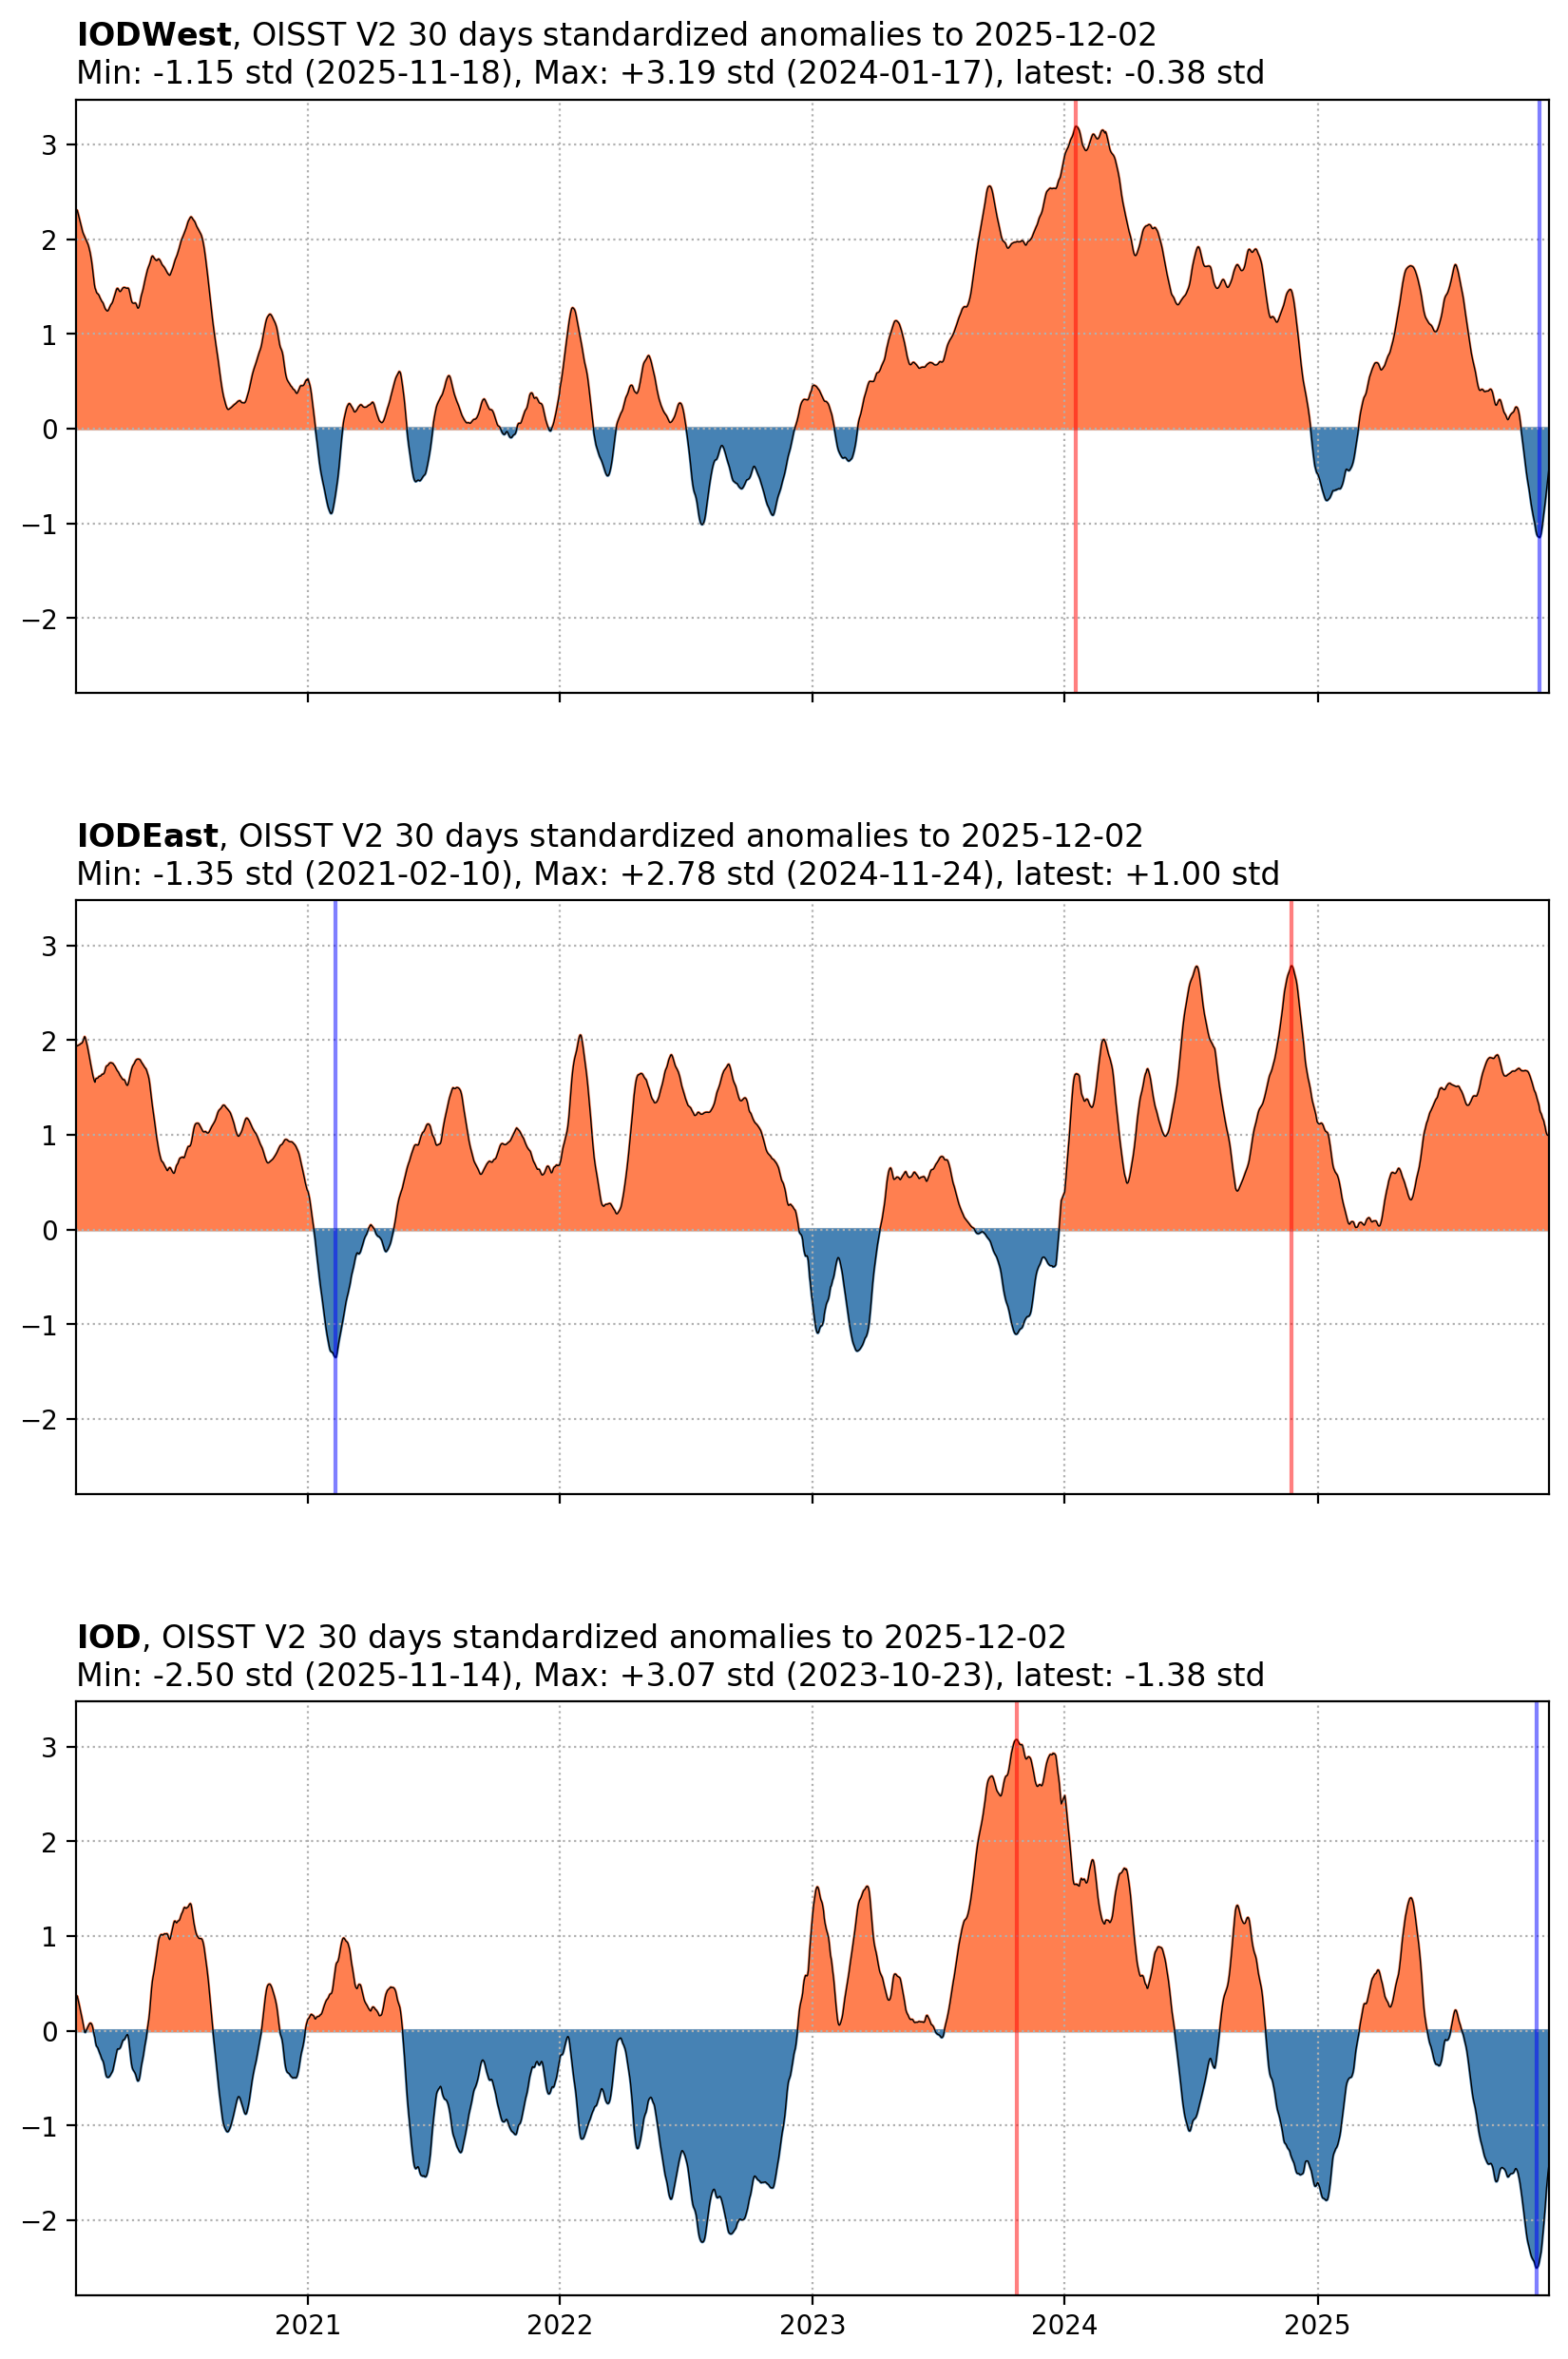
Indian Ocean Dipole (IOD) (Read me)
------- PLOTS: Anomalies for the IOD, west Indian Ocean basin, east Indian Ocean basin
composite figure (1-day, 7-day, 30-day; all 3 elements)
------- DATA: (1-day, 7-day, 30-day for west basin, east basin and IOD index)
South Pacific subtropical dipole (coming soon)
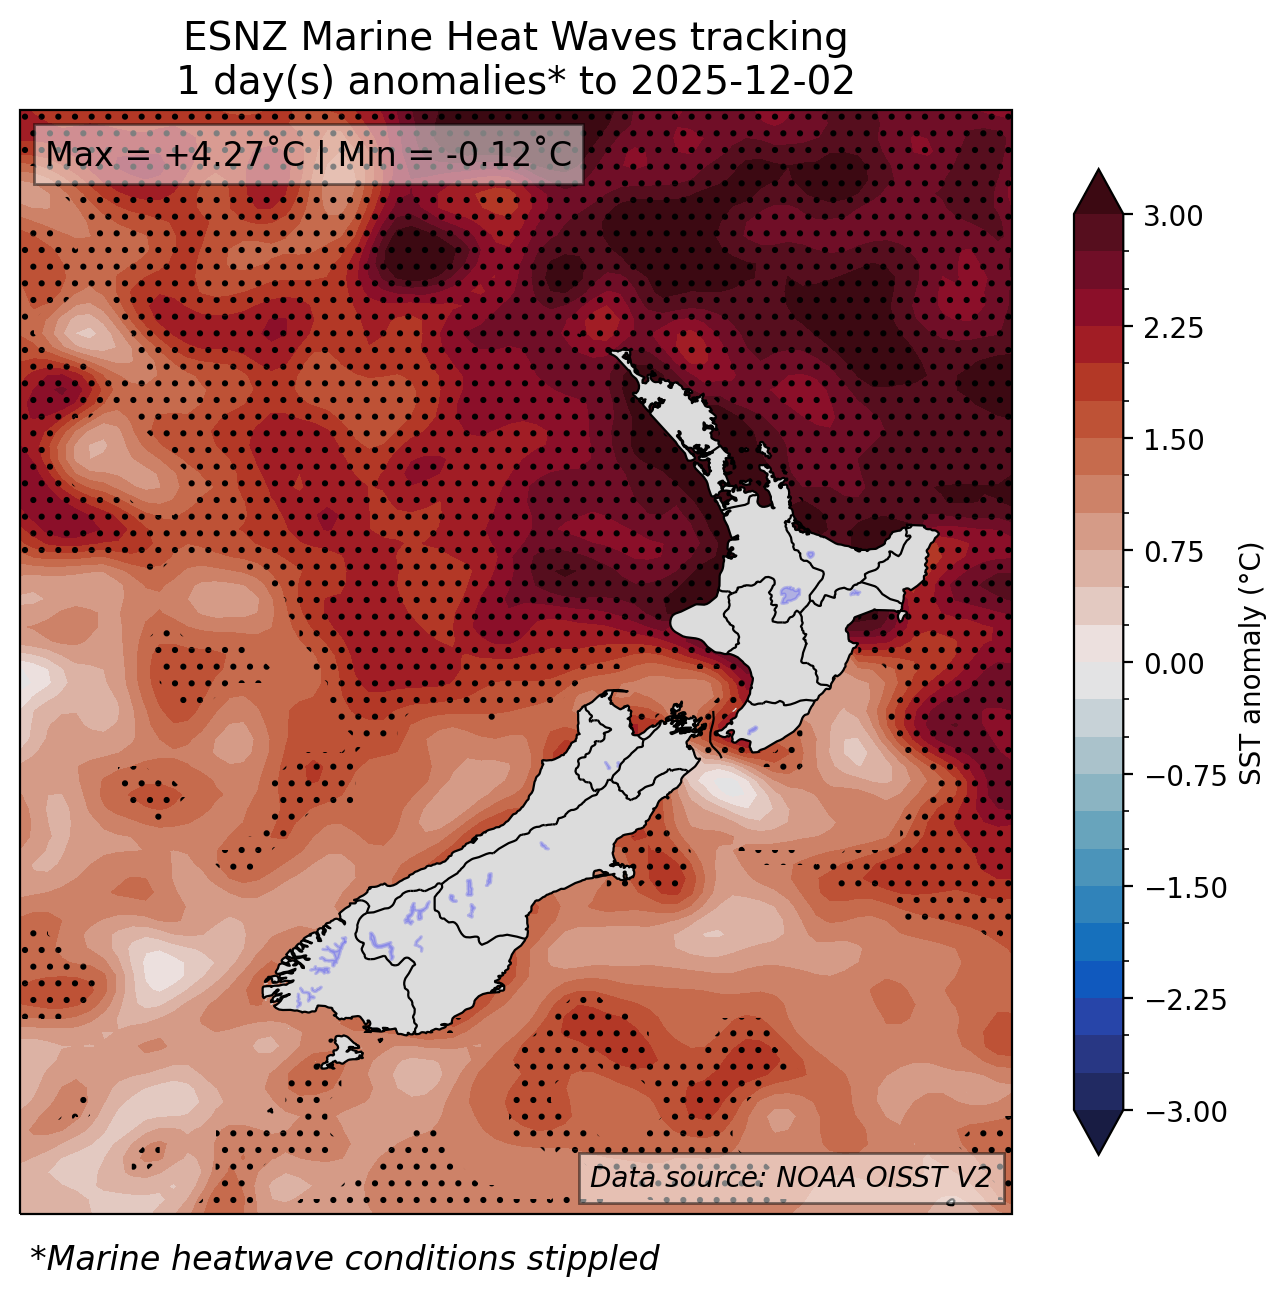
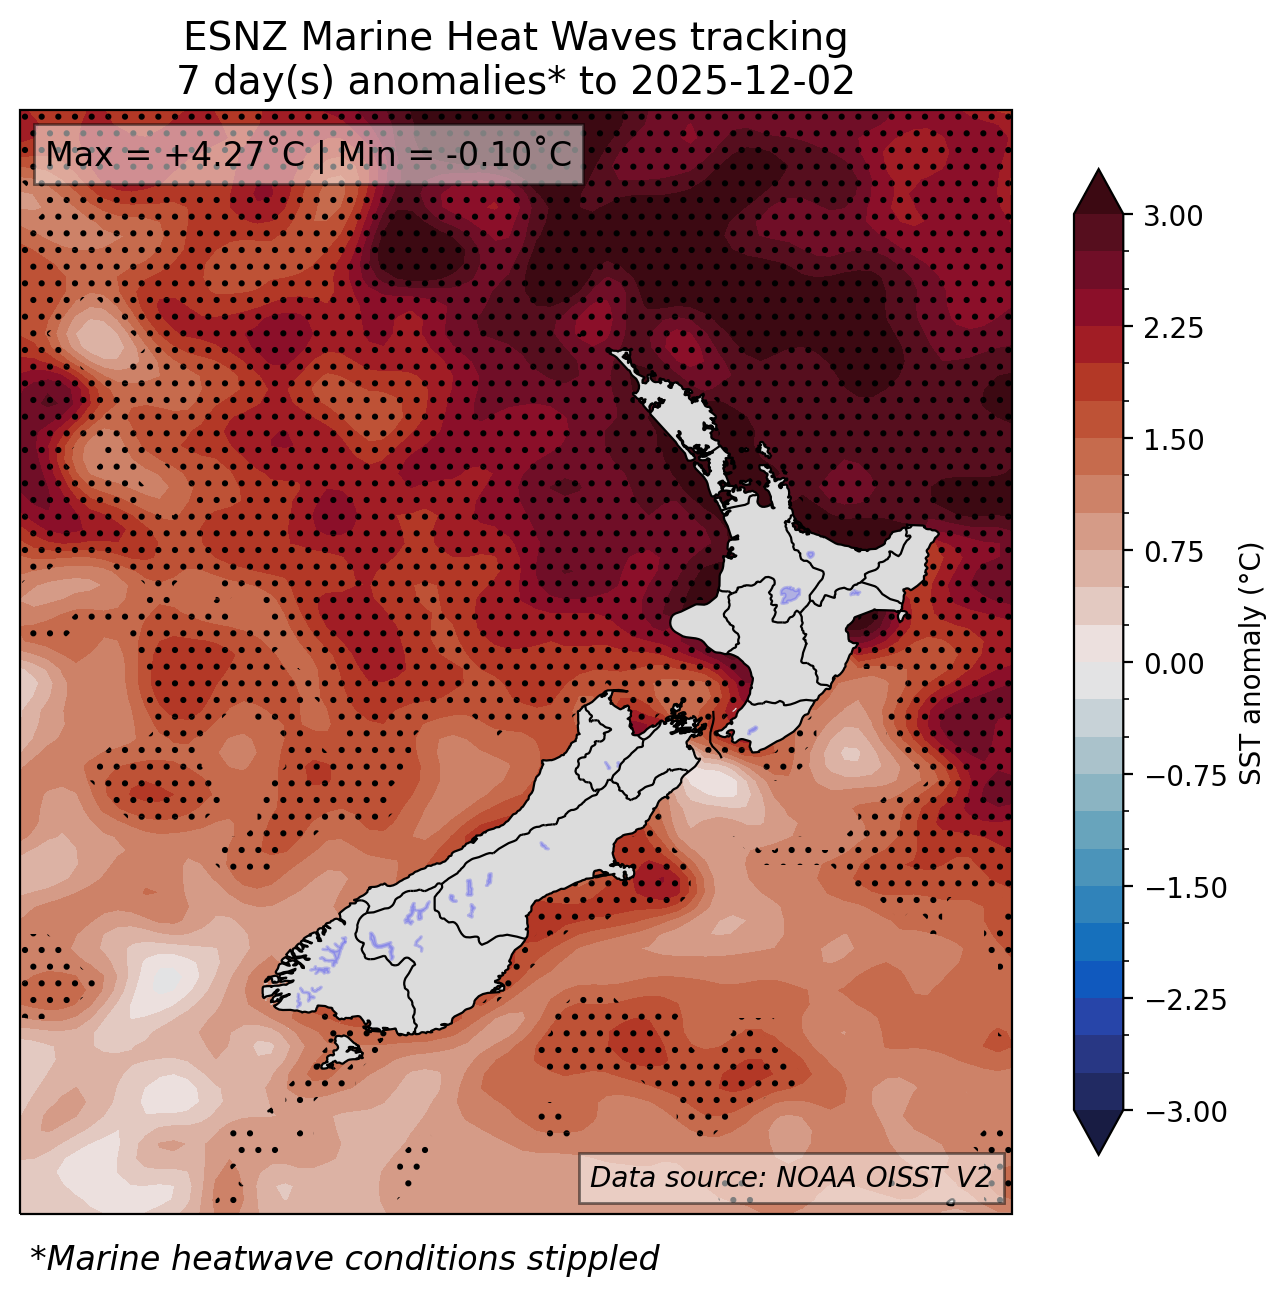
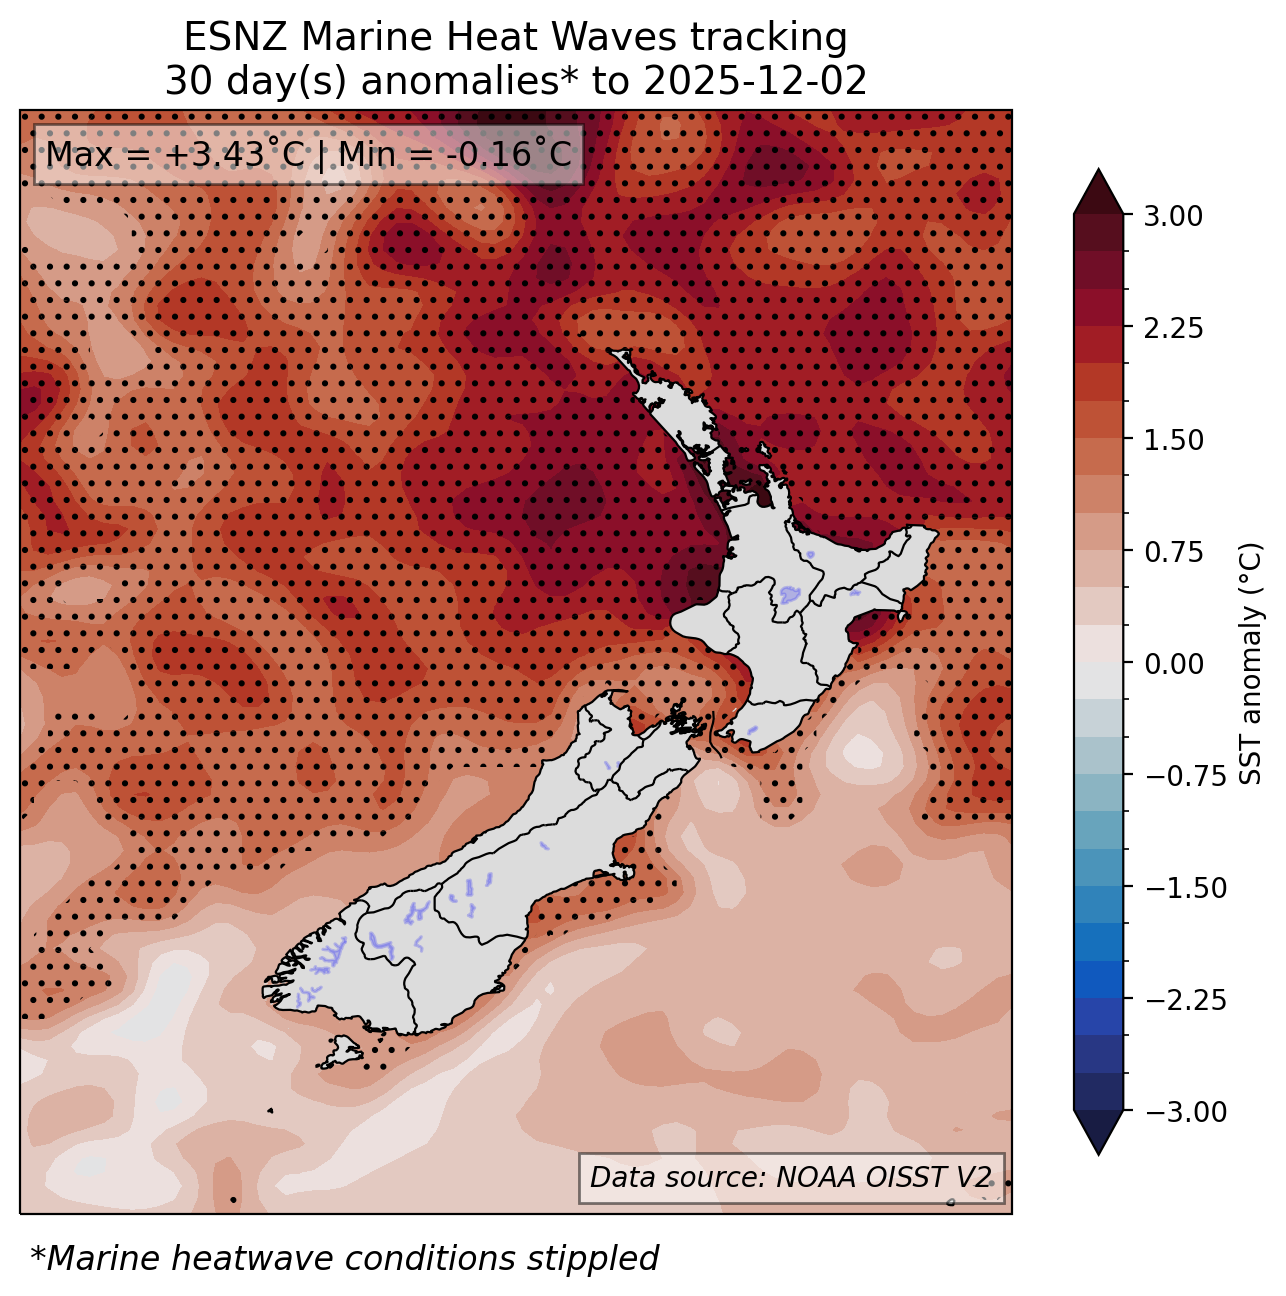
New Zealand marine environmental conditions
National sea surface temperature anomalies
------- PLOTS: (1 day; 7 day; 30 days)
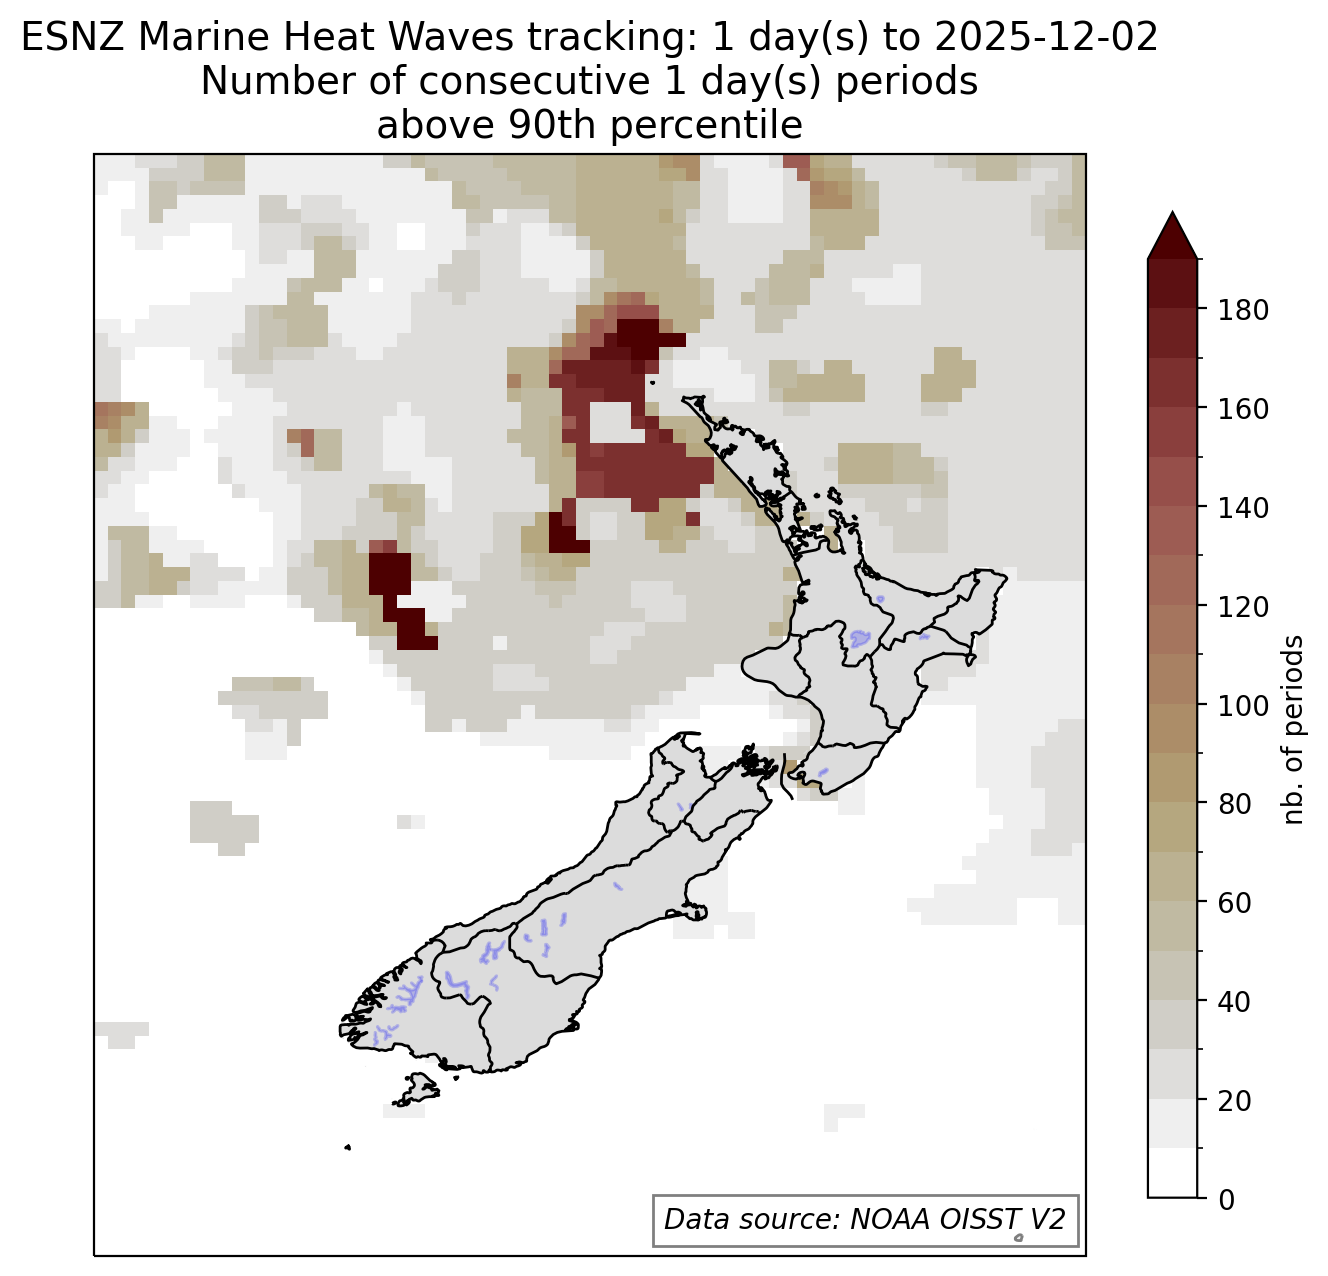
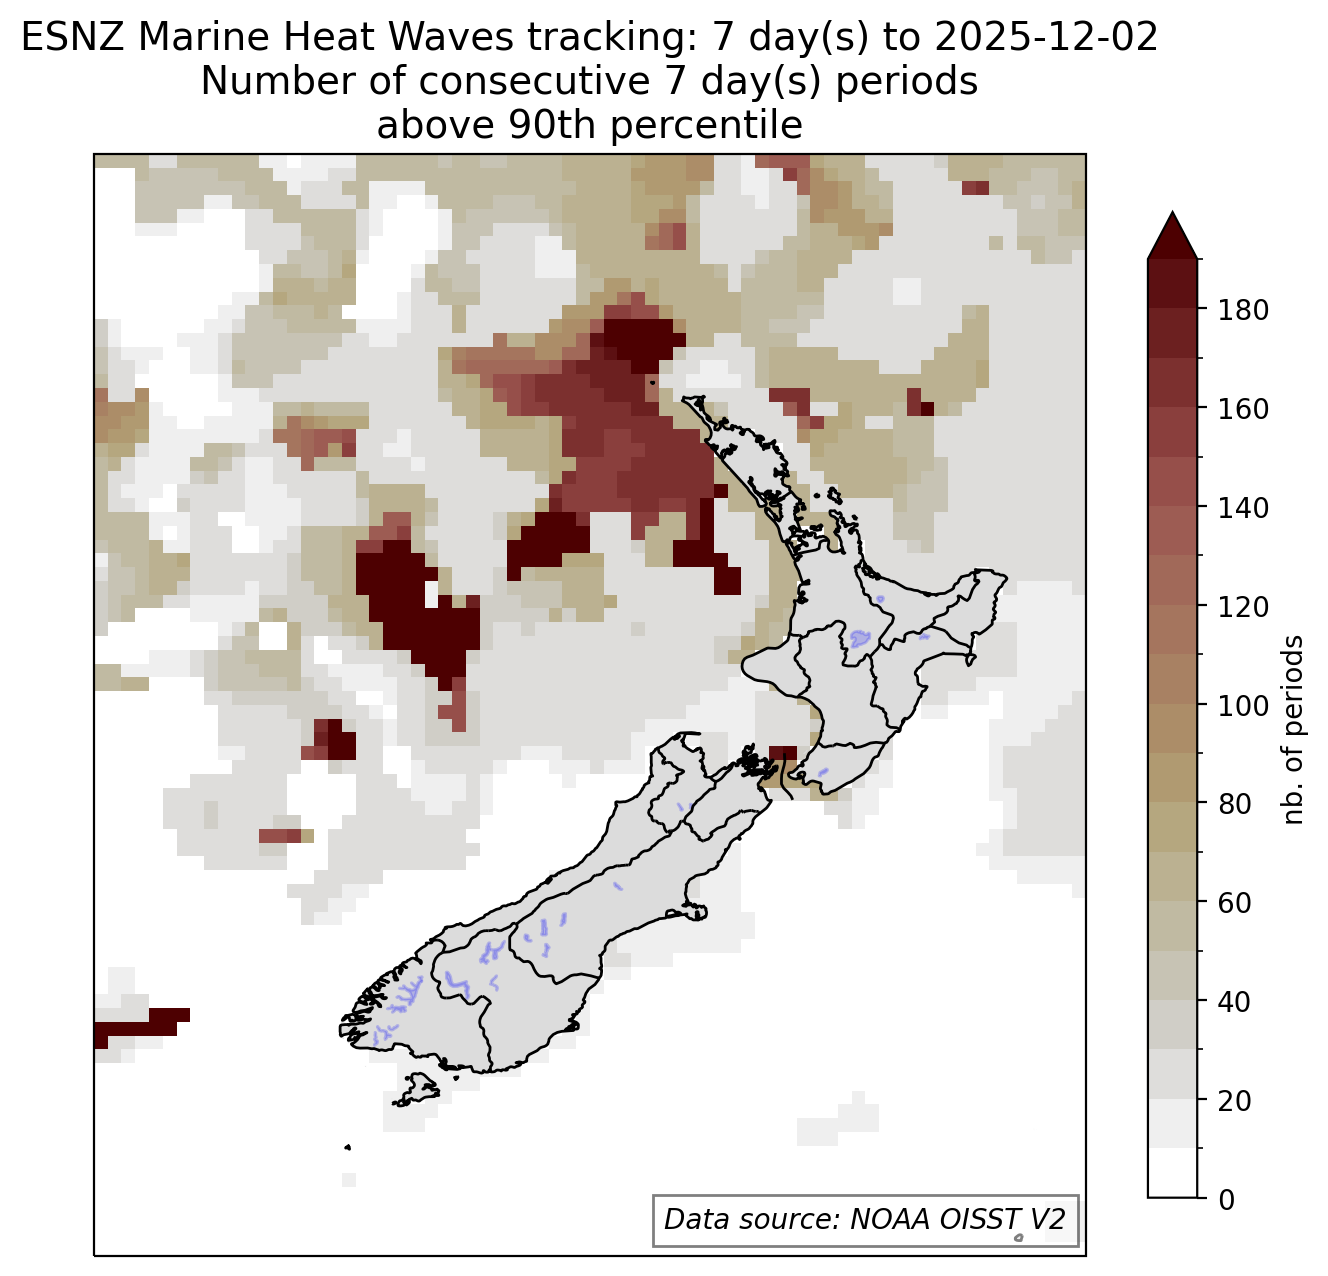
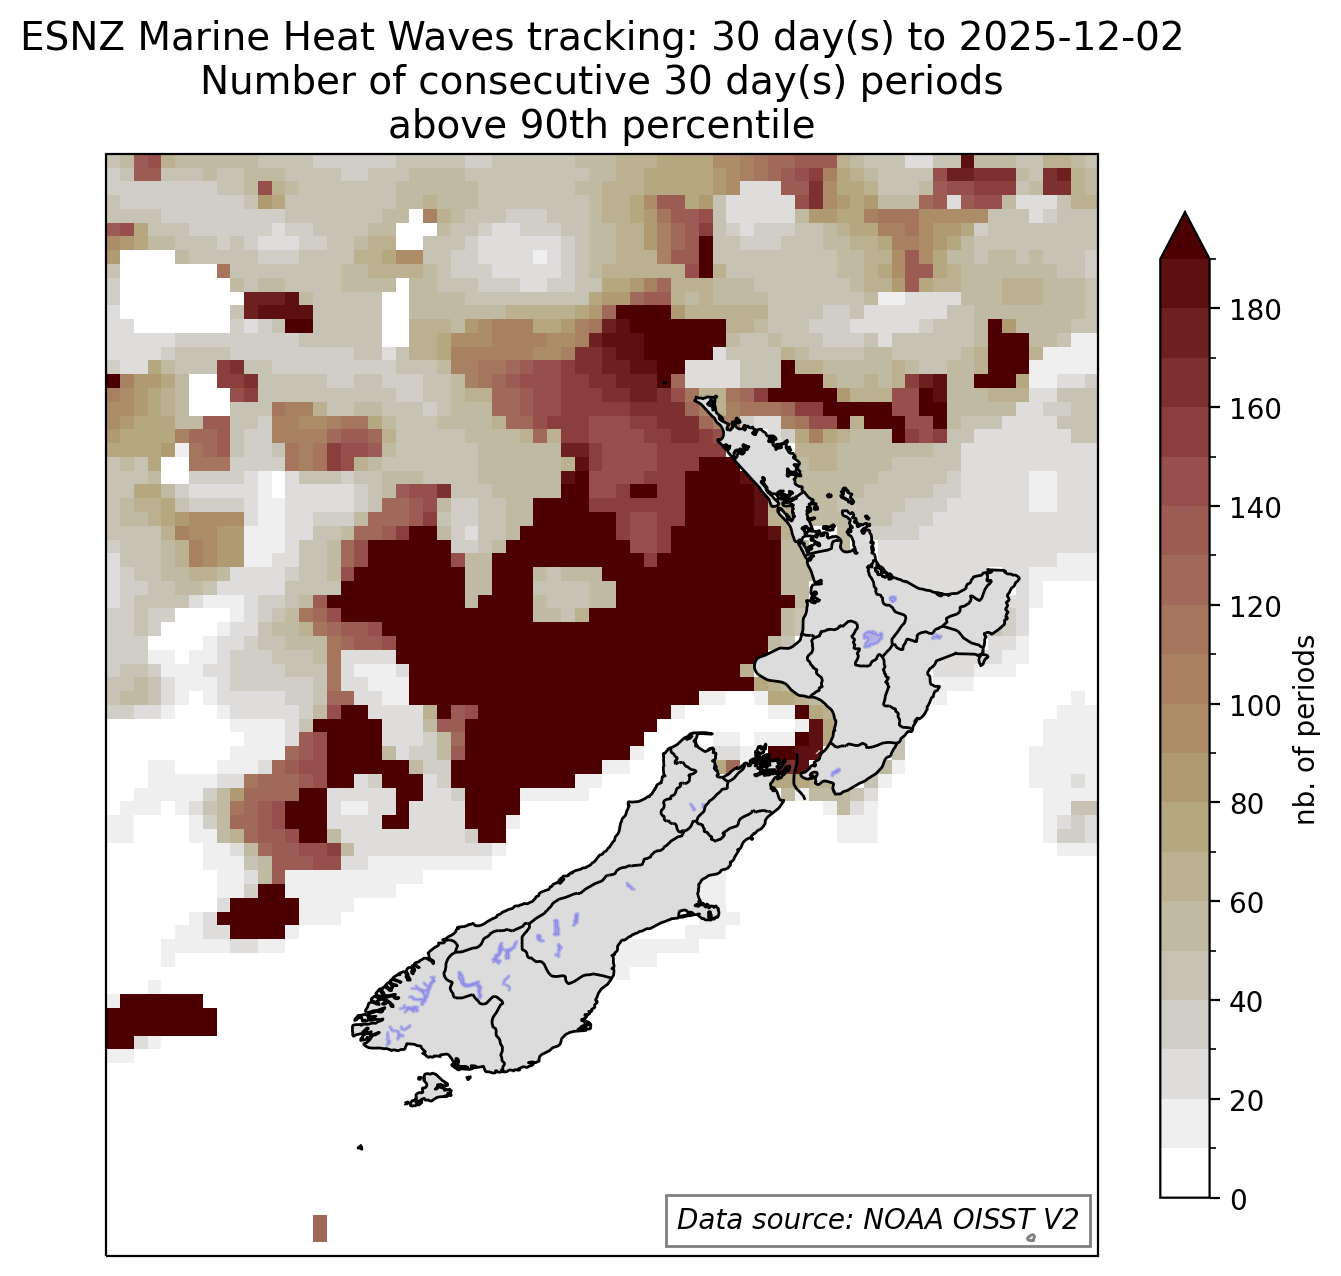
Marine heatwave conditions (consecutive intervals >90th percentile)
------- PLOTS: (1 day; 7 day; 30 day)
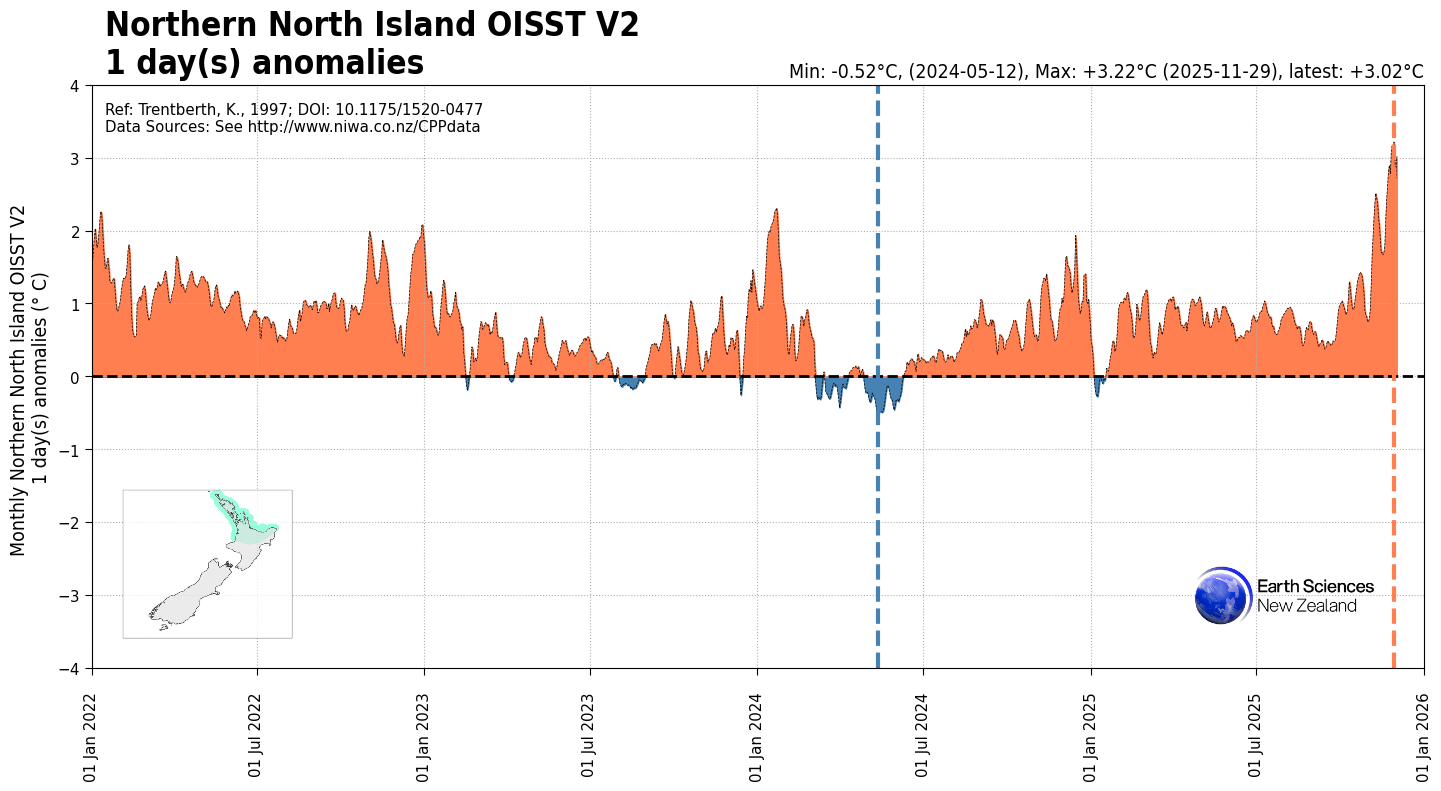
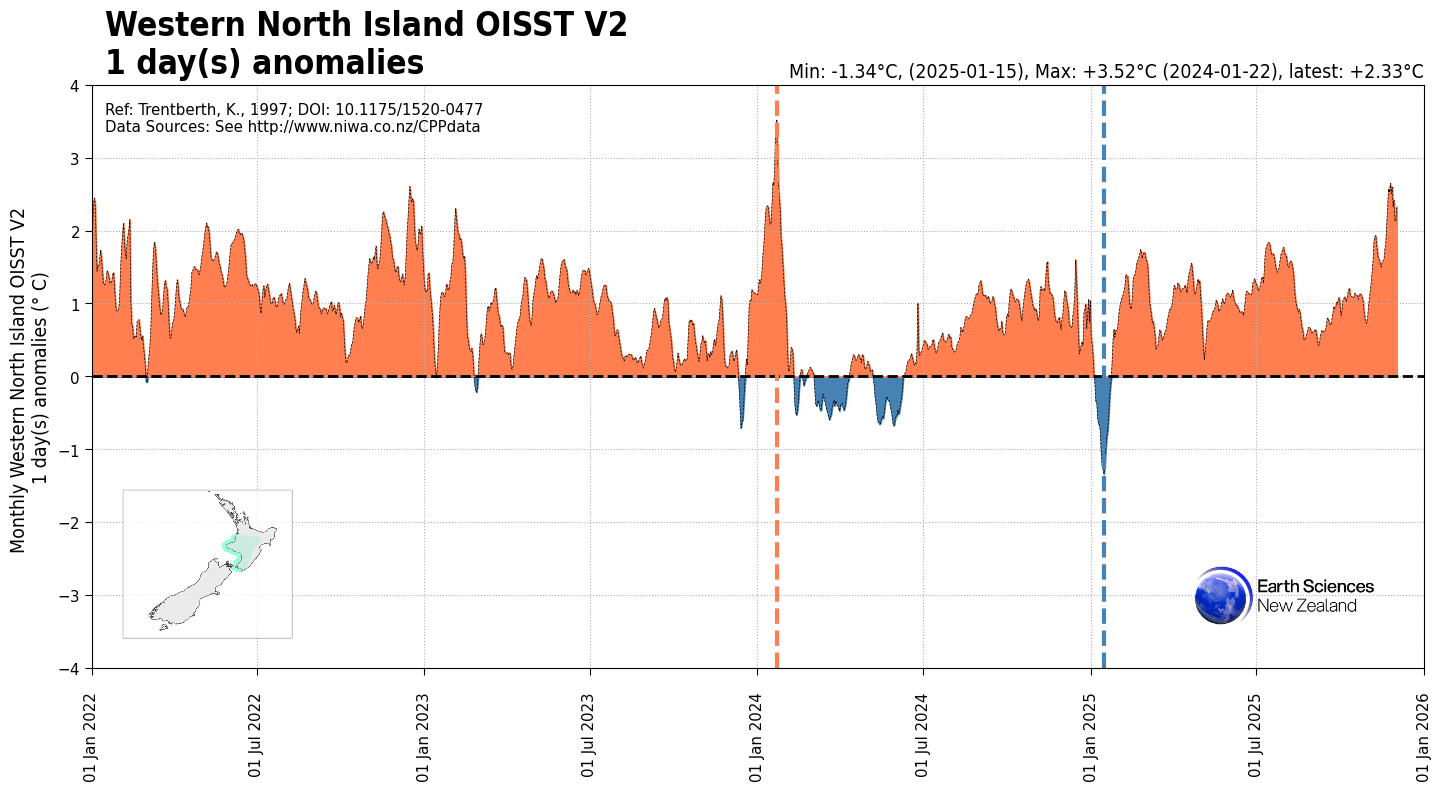
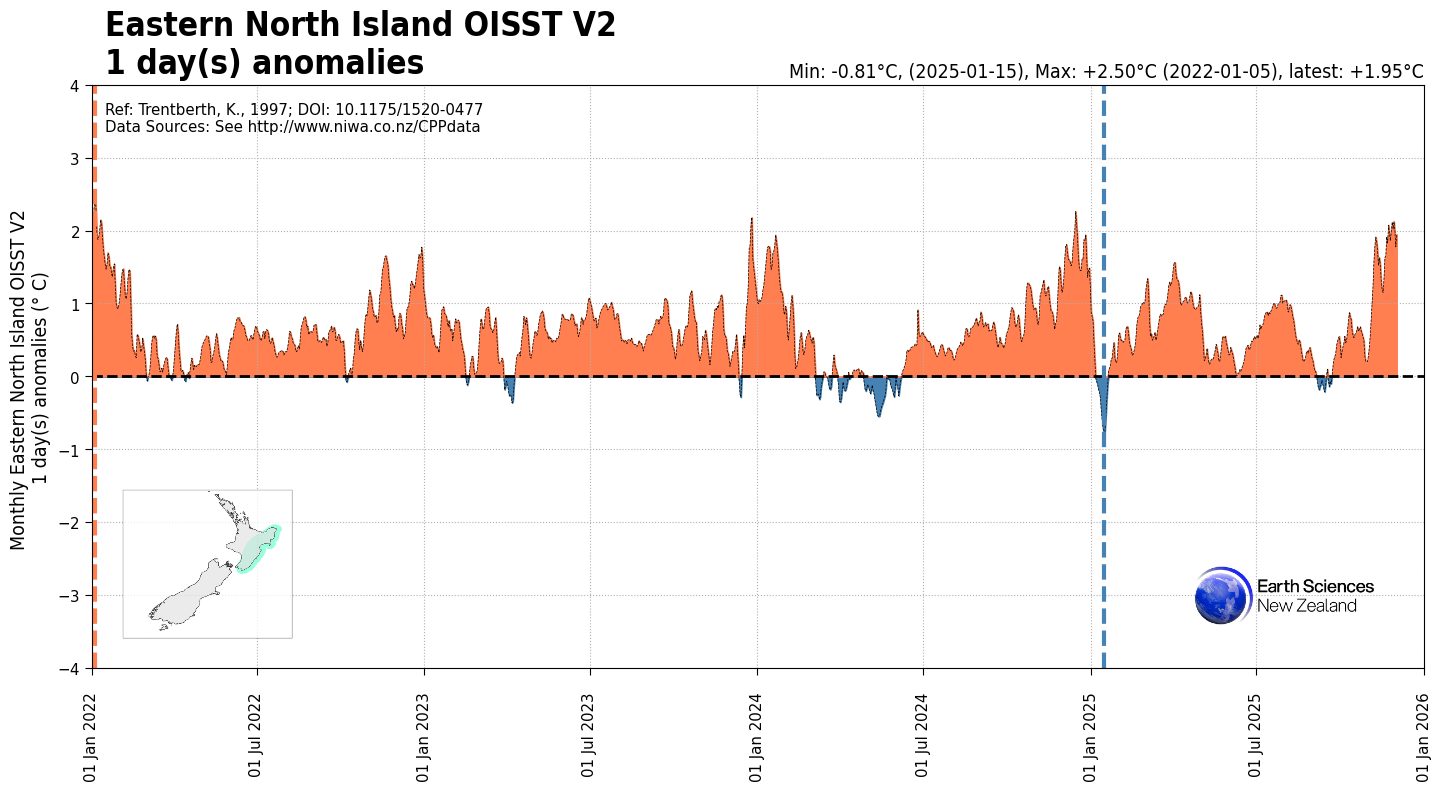
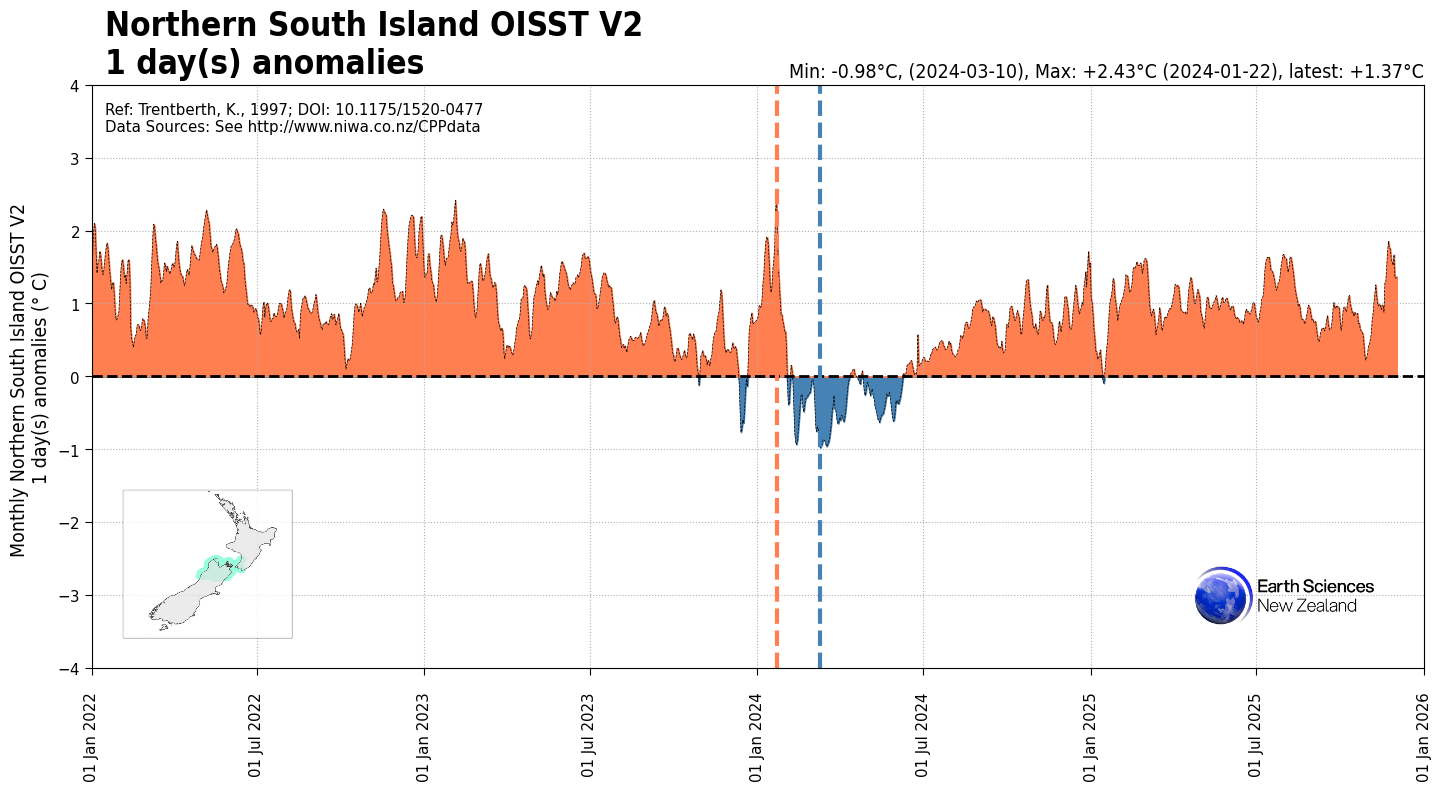
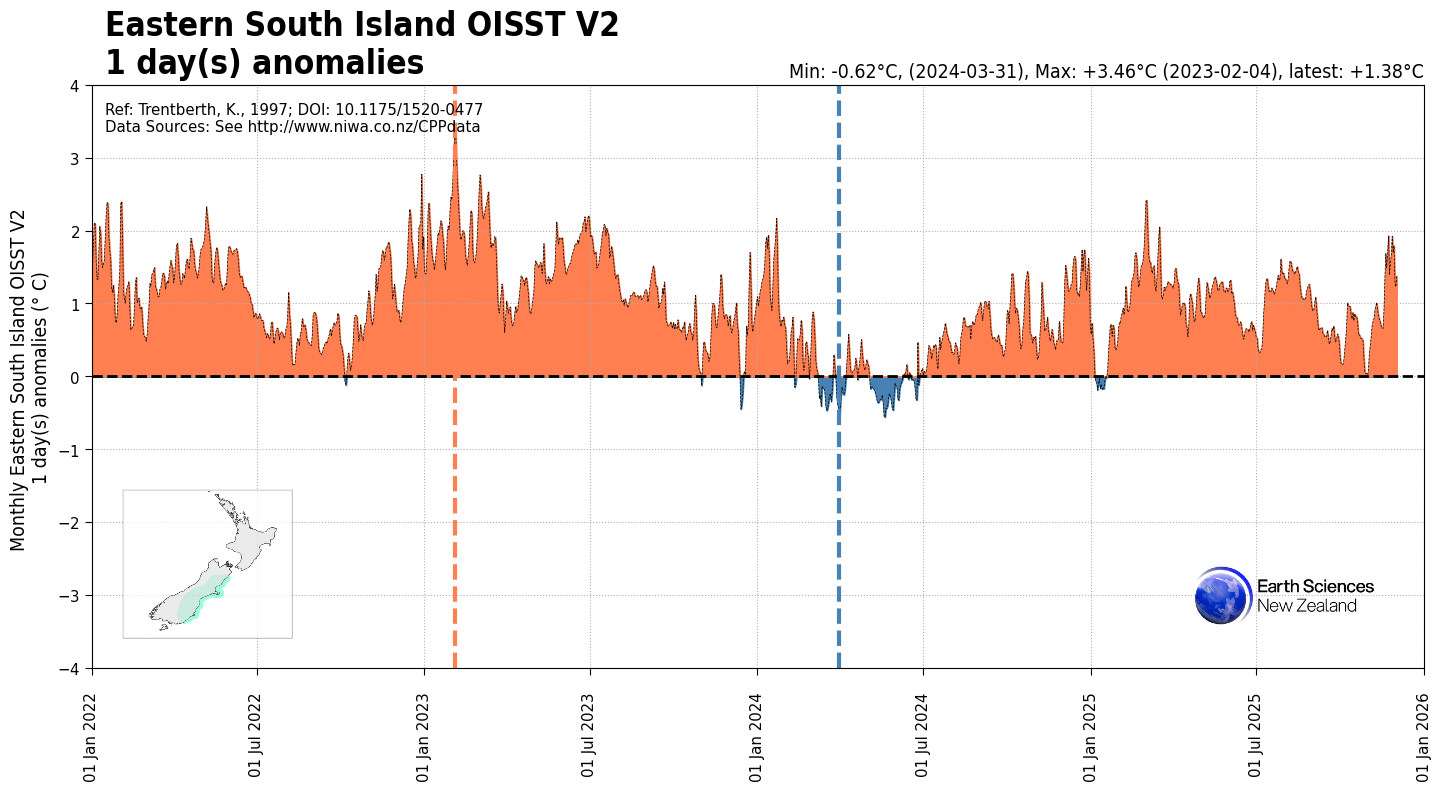
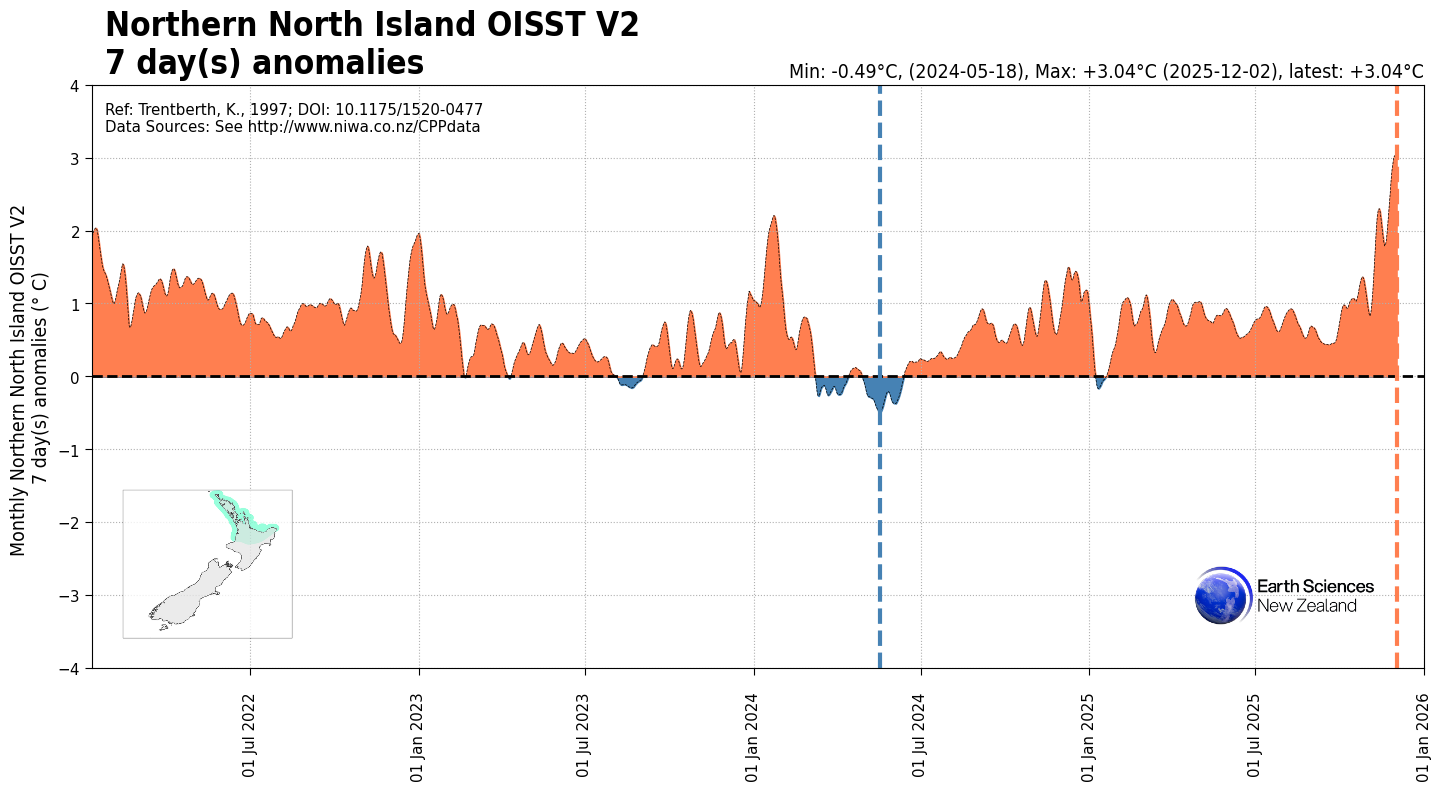
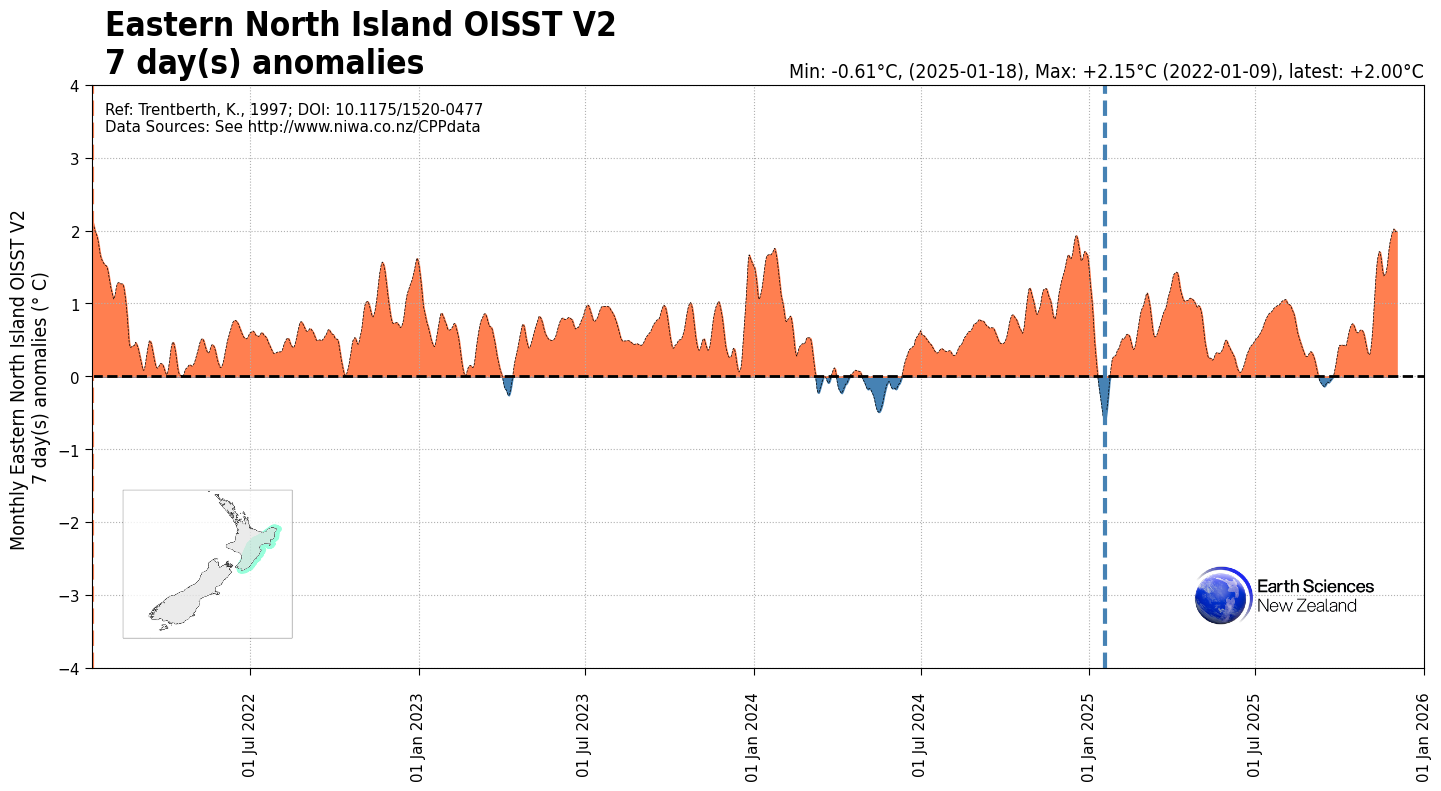
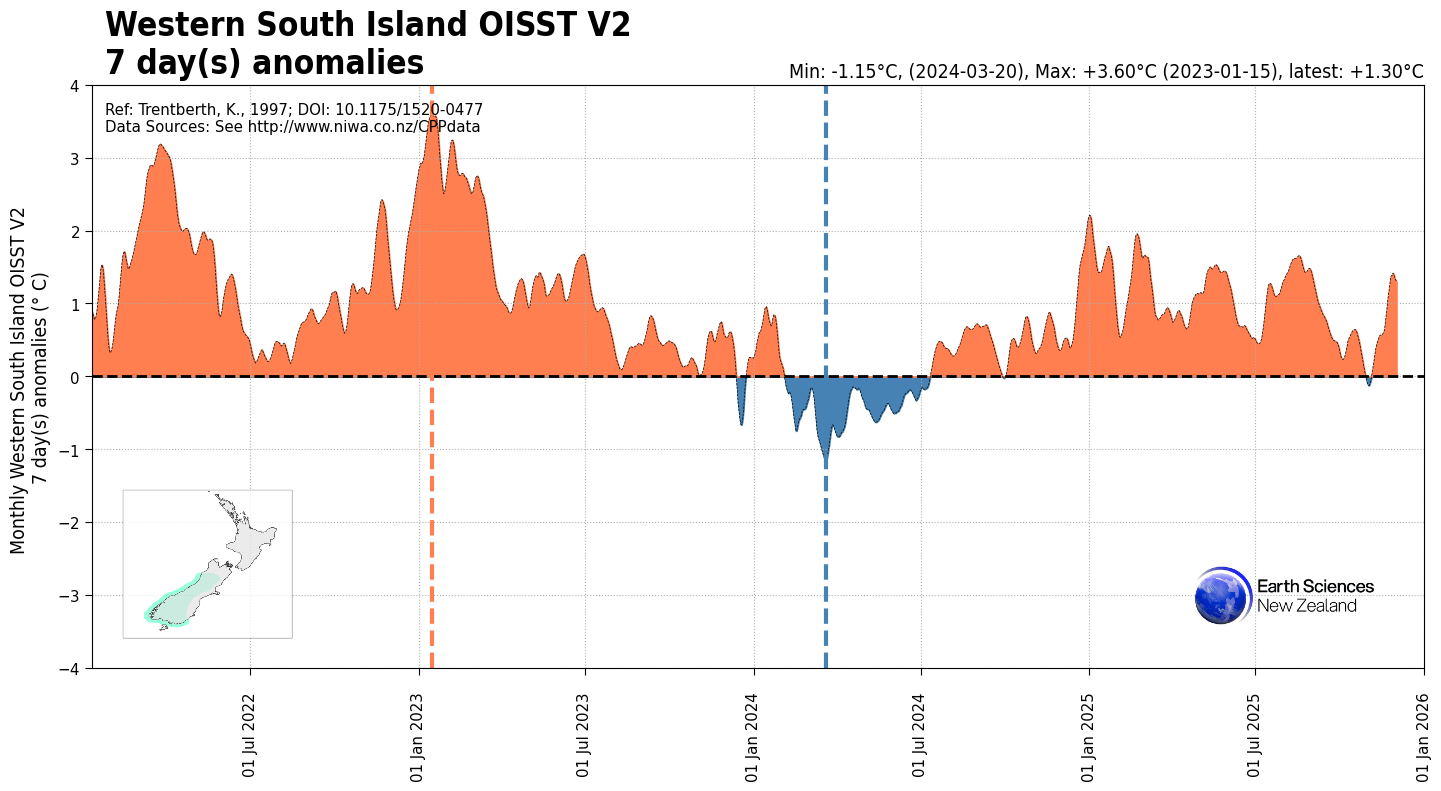
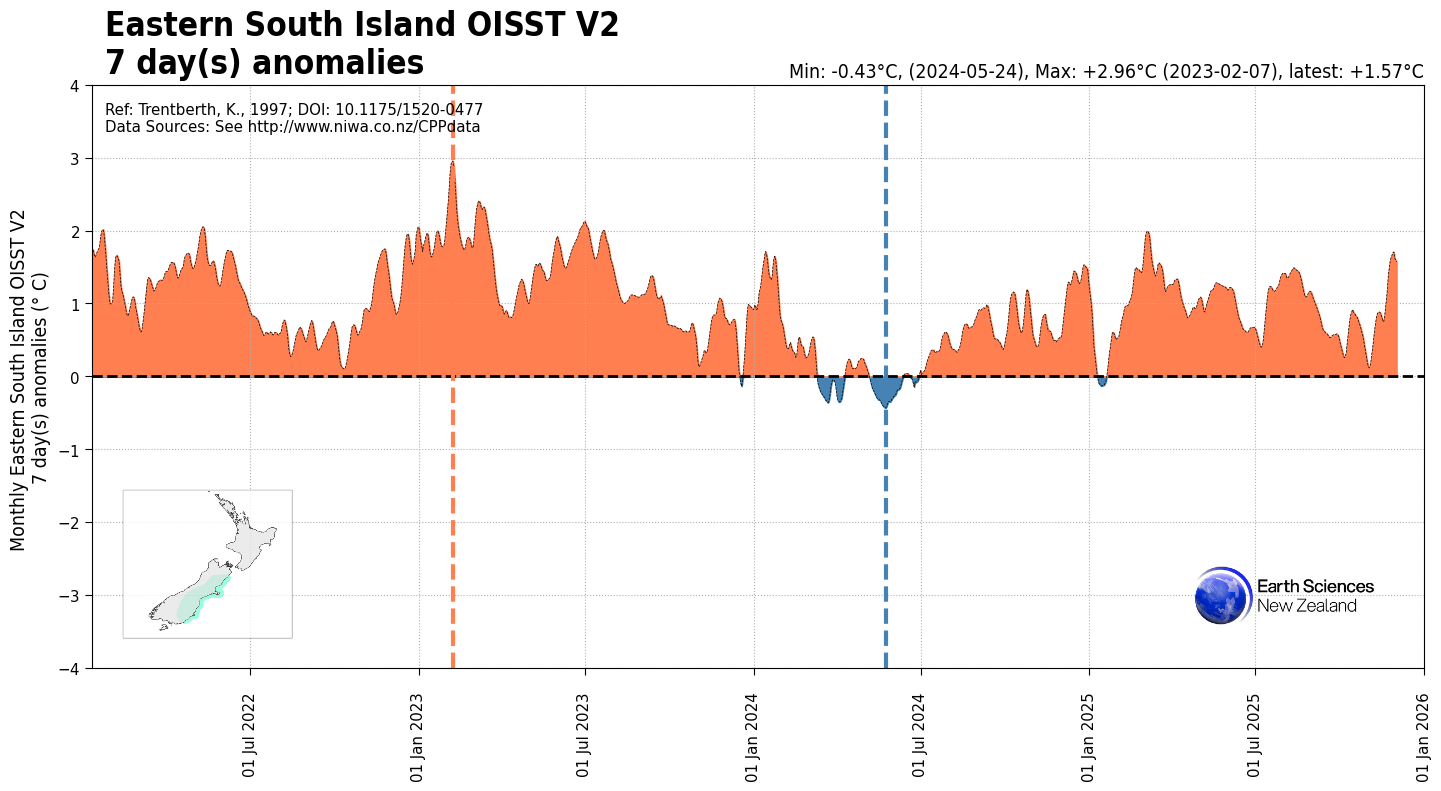
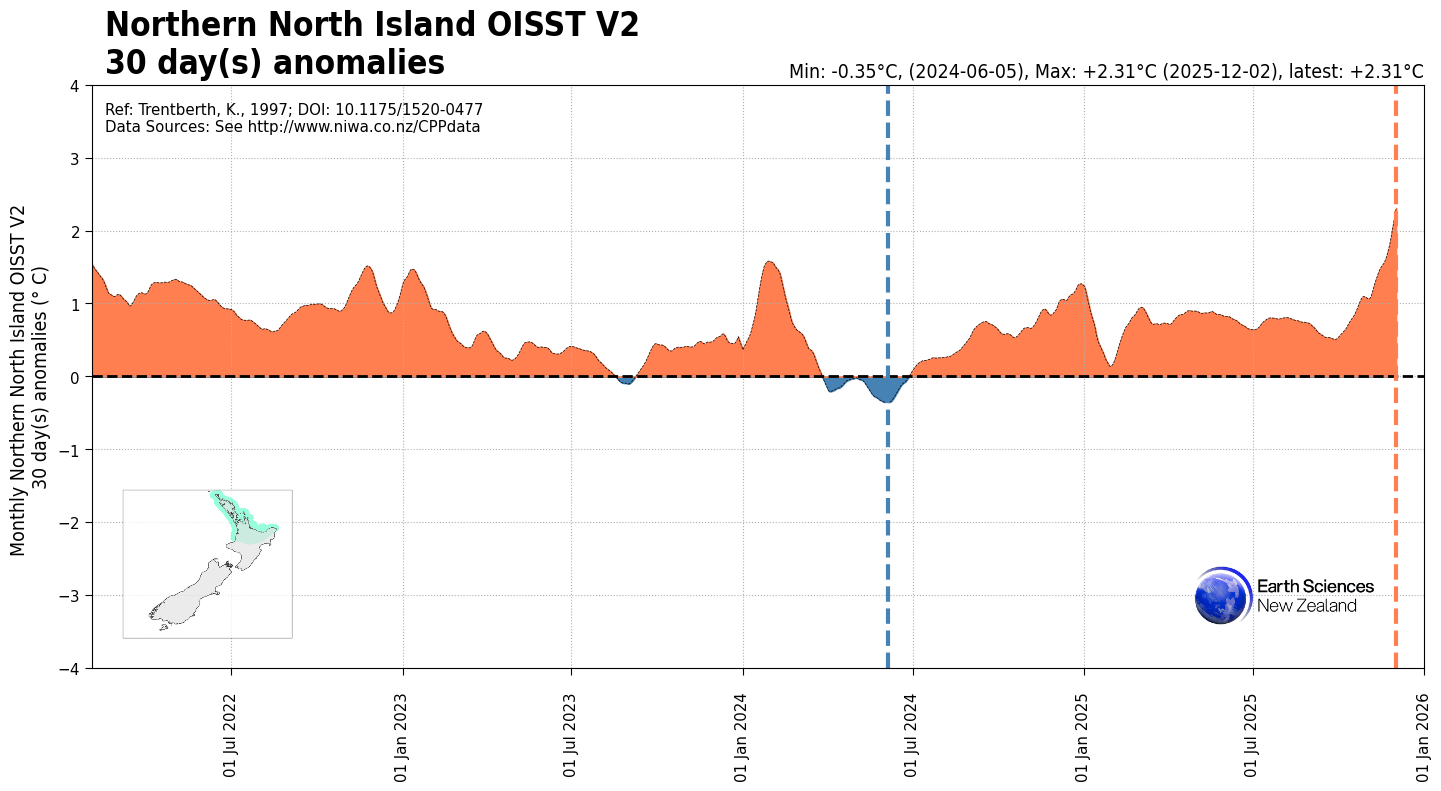
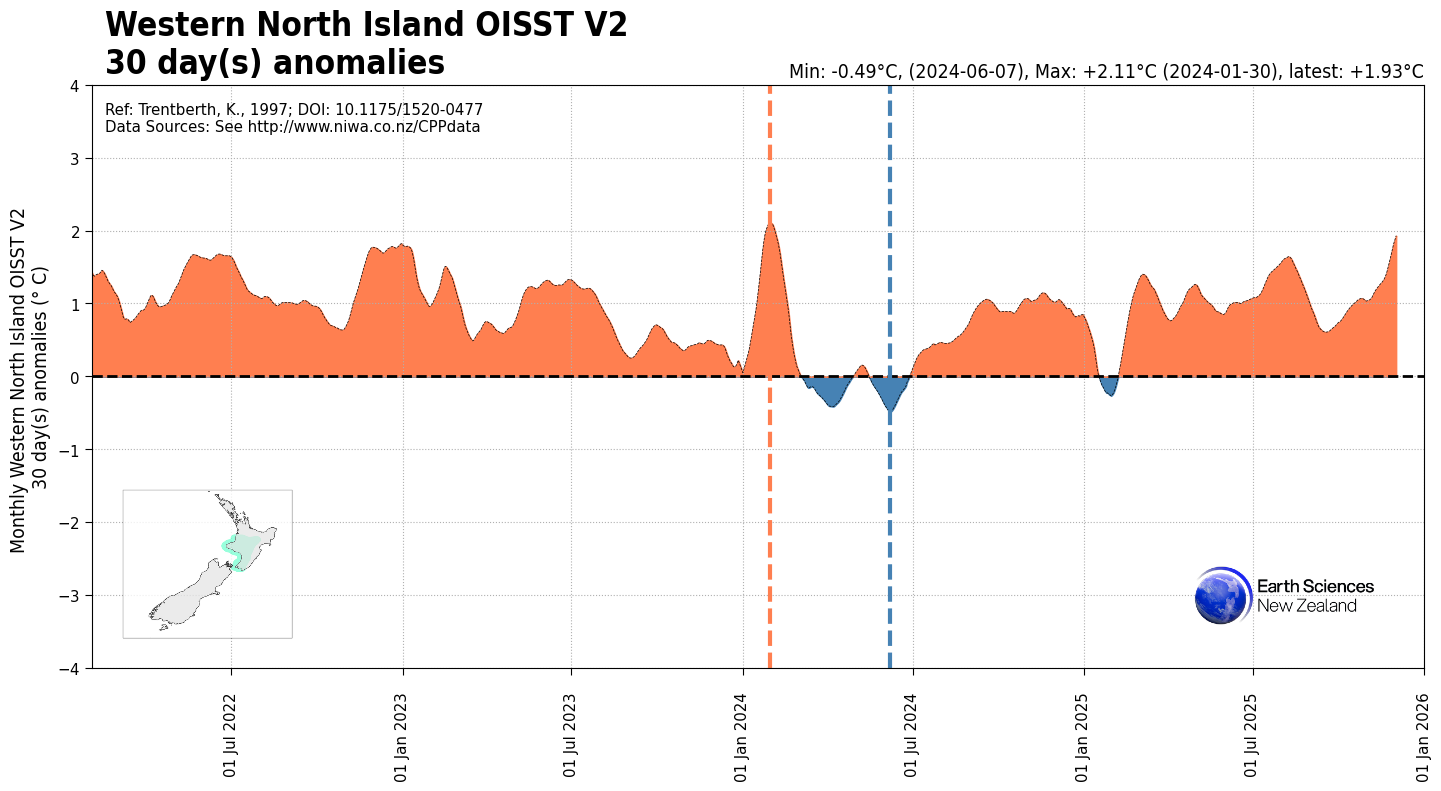
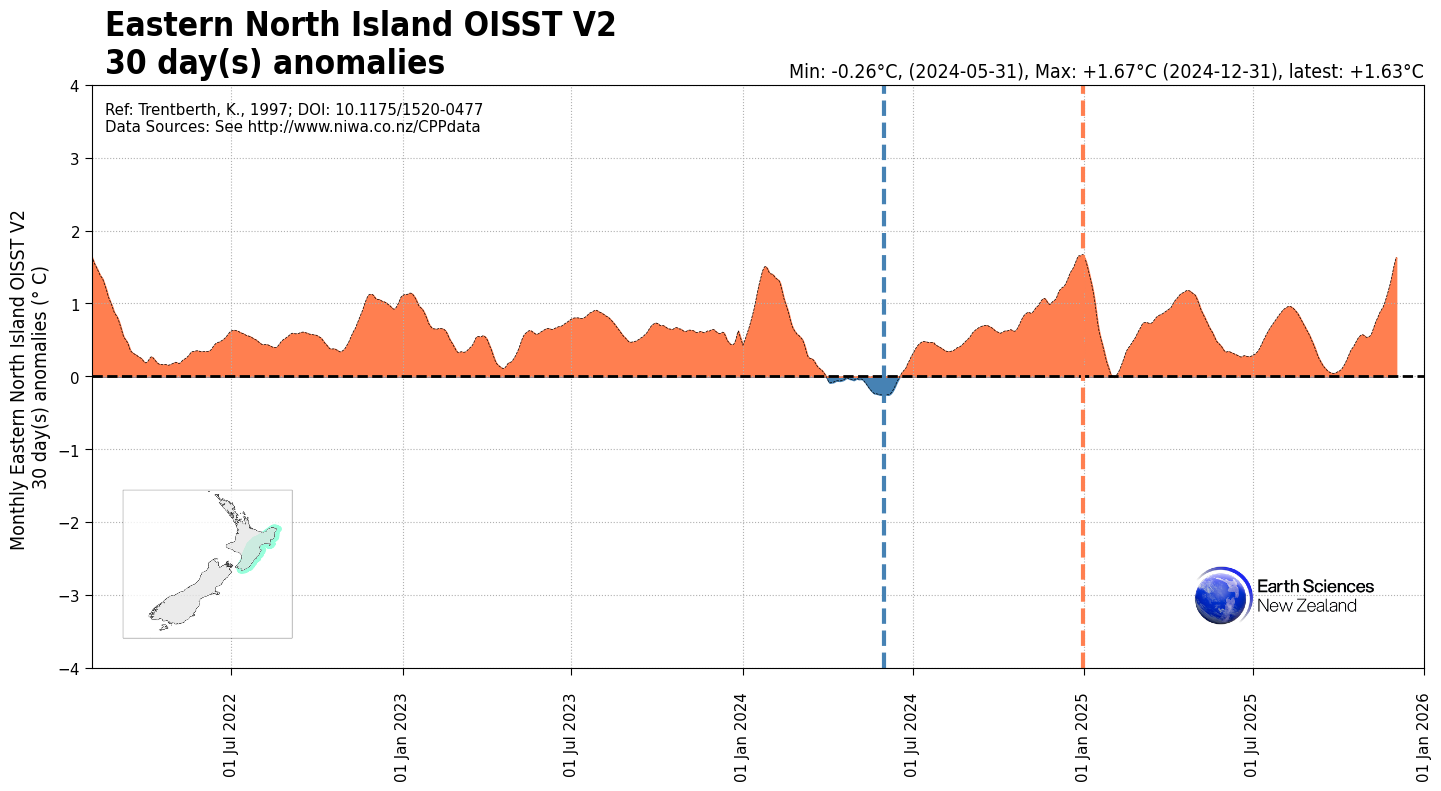
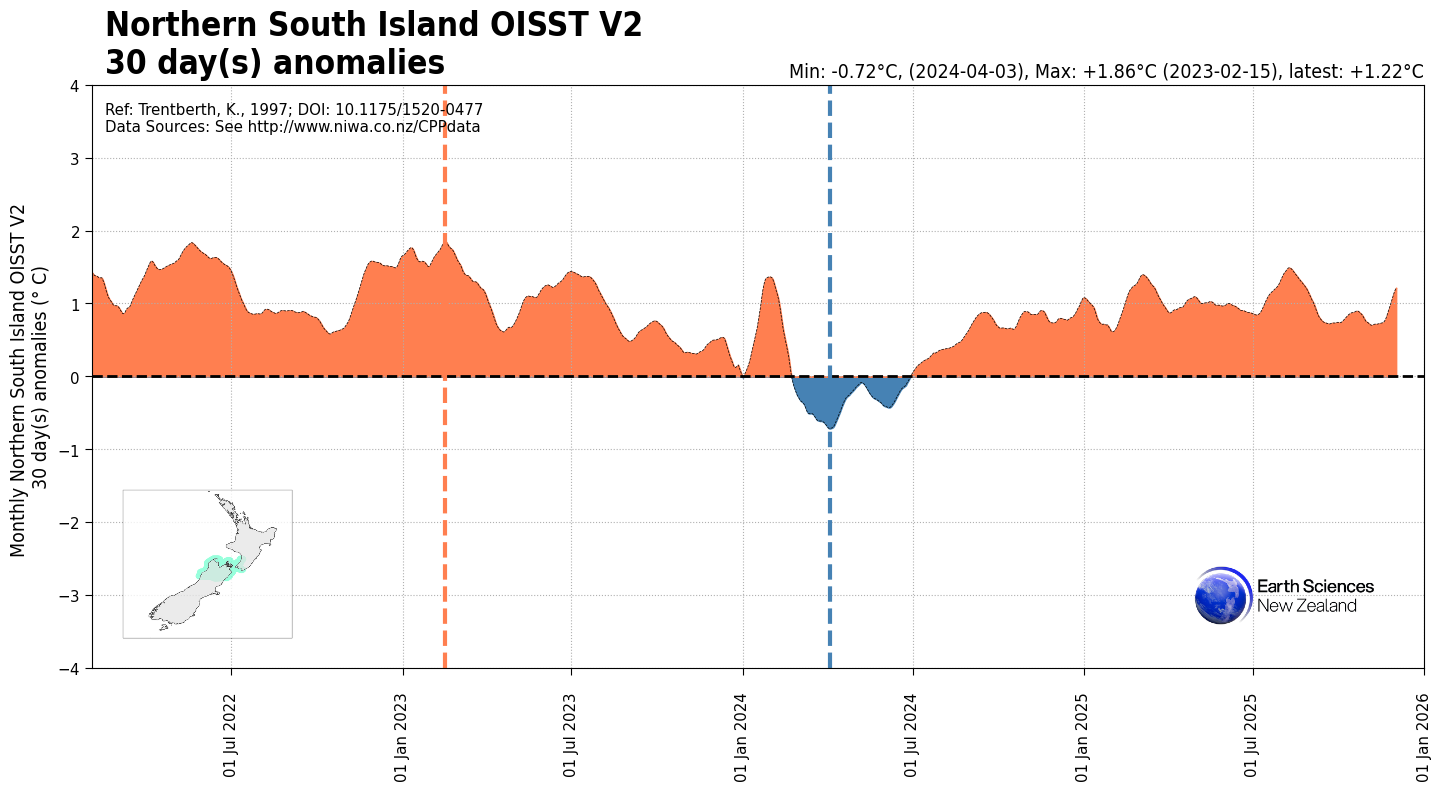
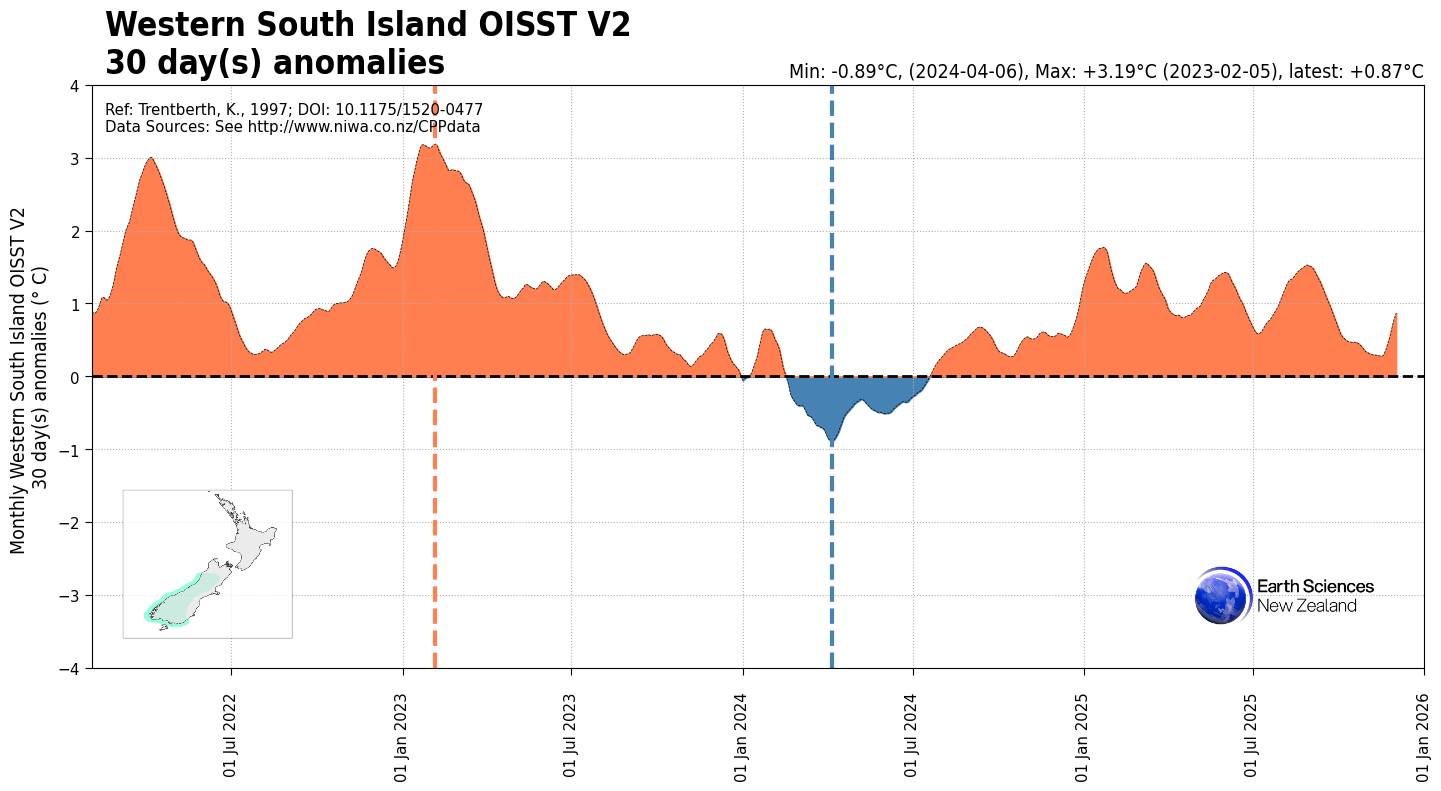
Regional sea surface temperature anomalies (read me)
------- PLOTS:
1-day anomalies: NNI, WNI, ENI, NSI, WSI, ESI
7-day anomalies: NNI, WNI, ENI, NSI, WSI, ESI
30-day anomalies: NNI, WNI, ENI, NSI, WSI, ESI
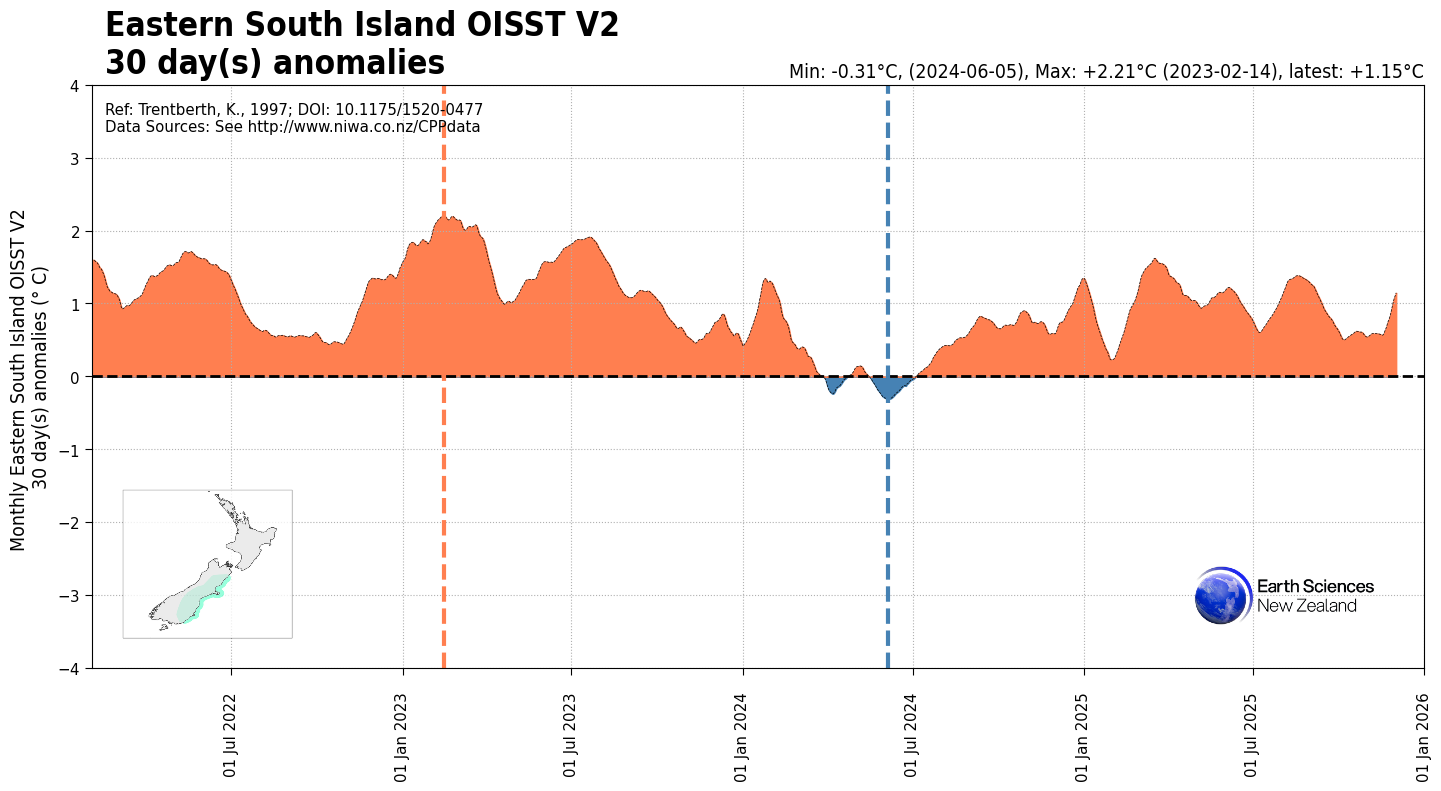
------- DATA:
All six regions (last 4 years)
Regional atmospheric circulation indices and daily weather classifications (updates coming soon)
New Zealand twice-daily synoptic weather types (Kidson, 2000)
------- PLOTS: New Zealand synoptic weather regime archetypes (Kidson 2000)
New Zealand once-daily two-tiered weather regimes (Rampal, Lorrey, Fauchereau 2022)
SW Pacific weather regimes (Lorrey and Fauchereau 2018)
Ross Sea synoptic weather regimes (Cohen et al. 2013)
------- PLOTS: 6 Ross Sea once-daily synoptic weather regime patterns (archetypes)
Trenberth circulation indices (coming soon)
------- PLOTS: M1 M2 M3 MZ1 MZ2 MZ3 MZ4 Z1 Z2 Z3 Z4 Z5 ZN ZS
------- DATA: (All series except TPI)
Terrestrial, atmosphere and cryosphere climate time series
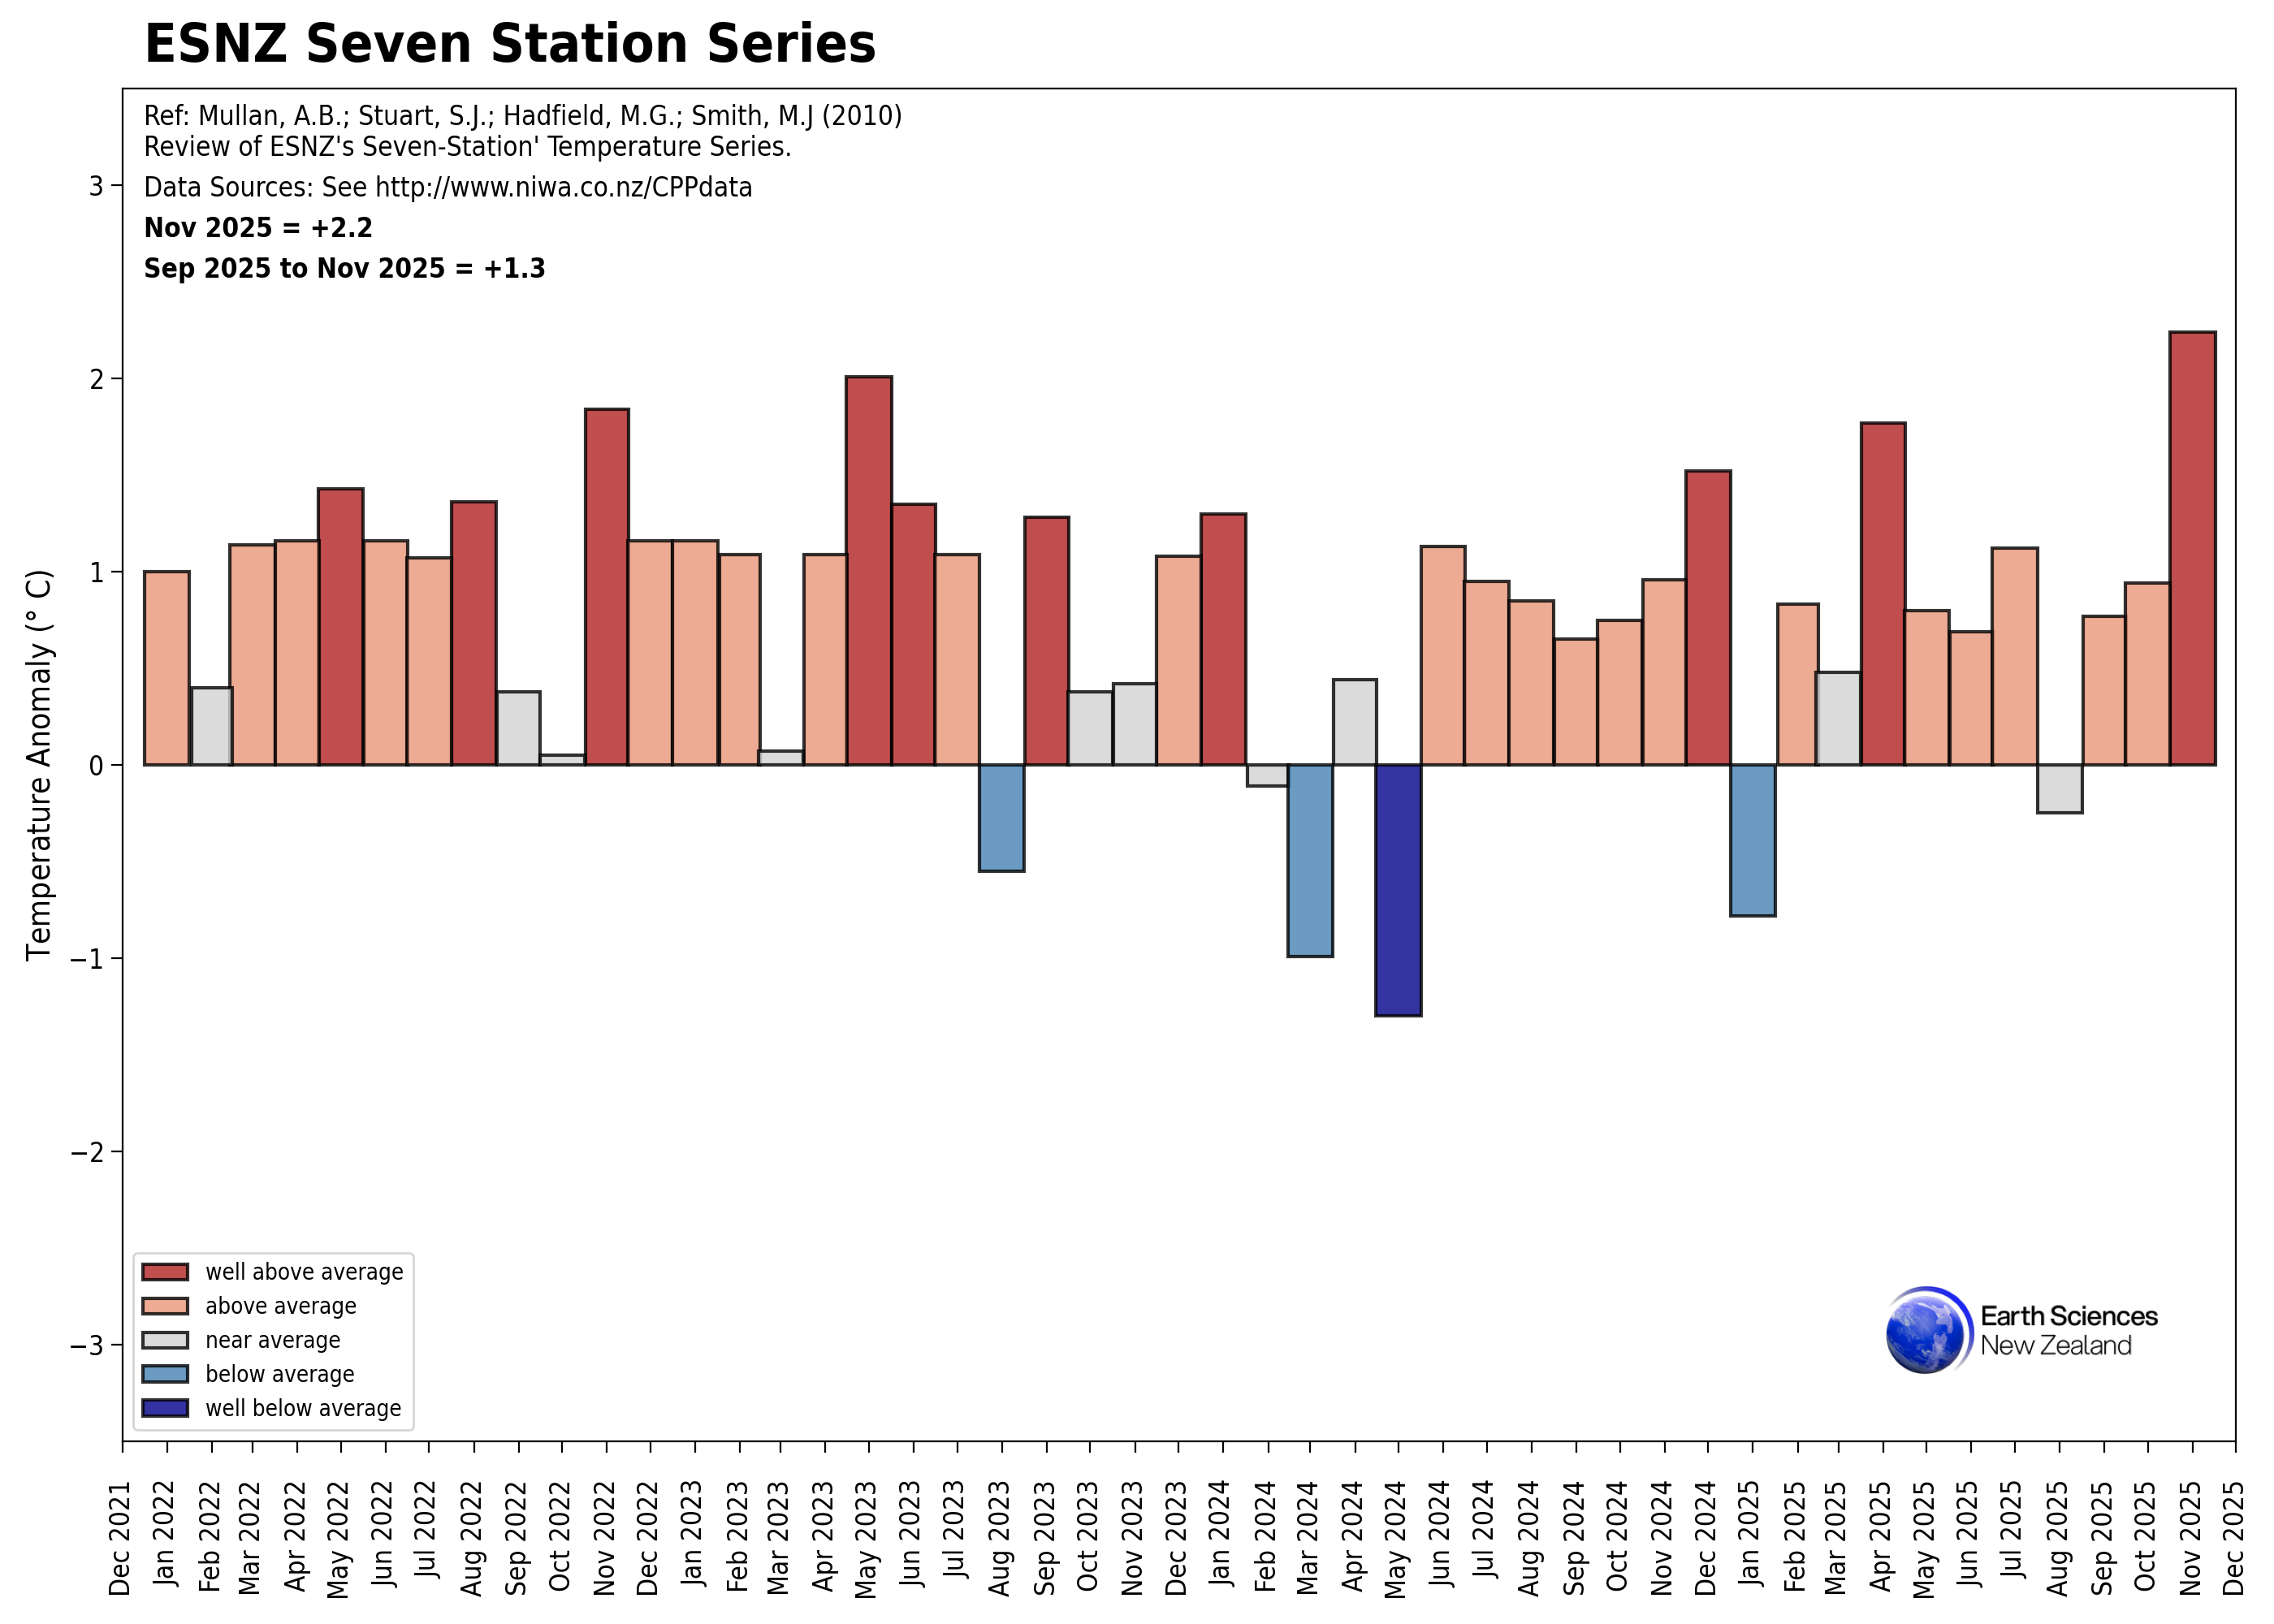
New Zealand 7-station temperature series (Read me)
------- PLOTS: Monthly, Last 4 years
------- DATA: 7-Station Series sites from 1909
NZ mean monthly temperature, brick format (years/row; months/column)
NZ monthly mean minimum temperature
NZ monthly mean maximum temperature
NZ monthly mean, max and min temperature anomalies (time series format)
NZ monthly mean, max, and min temperature anomalies (brick format)
------- DATA: Sites used in 7-Station Series
Monthly mean temperature: Auckland, Masterton, Wellington, Nelson, Lincoln, Hokitika, Dunedin
Monthly mean maximum temperature: Auckland, Masterton, Wellington, Nelson, Lincoln, Hokitika, Dunedin
Monthly mean minimum temperature: Auckland, Masterton, Wellington, Nelson, Lincoln, Hokitika, Dunedin
Monthly mean temperature anomalies (relative to 1991-2020): Auckland, Masterton, Wellington, Nelson, Lincoln, Hokitika, Dunedin
Monthly mean maximum temperature anomalies (relative to 1991-2020): Auckland, Masterton, Wellington, Nelson, Lincoln, Hokitika, Dunedin
Monthly mean minimum temperature anomalies (relative to 1991-2020): Auckland, Masterton, Wellington, Nelson, Lincoln, Hokitika, Dunedin
Baring Head CO2 record
------- PLOTS: Baring Head atmospheric CO2 record
Southern Alps end of summer snowline series (Read me)
------- PLOTS: NZ-ELA (master record; current to 2020) ; Regional series
------- DATA: All time series (NZ-ELA series, regional series, individual index glacier ELAs and normalised series)
Homogenised Auckland daily rainfall (coming soon)
------- PLOTS:
------- DATA: Central Auckland Rainfall (full series)
This page is contributed to and maintained by Climate Present and Past team members. Please email Andrew Lorrey ([email protected]) if you find any bugs or have any questions that cannot be answered using the read me files.