-

‘Weather detectives’ saving historical records
Media release01 December 2017More than 50 “weather detectives” from 20 countries will be in Auckland next week to share their experiences saving snippets of meteorological history that will ultimately help scientists better understand the processes of climate variability and change. -

NIWA's Hotspot Watch for 30 November 2017
Hotspot30 November 2017A weekly update describing soil moisture across the country to help assess whether severely to extremely dry conditions are occurring or imminent. Regions experiencing these soil moisture deficits are deemed “hotspots”. Persistent hotspot regions have the potential to develop into drought. -

Scientists explore the deepest depths of the Kermadec Trench
Media release24 November 2017A team of international researchers leaves Wellington this weekend to explore the bottom of the Kermadec Trench – one of the deepest places in the ocean. -
NIWA's Hotspot Watch for 23 November 2017
Hotspot23 November 2017A weekly update describing soil moisture across the country to help assess whether severely to extremely dry conditions are occurring or imminent. Regions experiencing these soil moisture deficits are deemed “hotspots”. Persistent hotspot regions have the potential to develop into drought. -
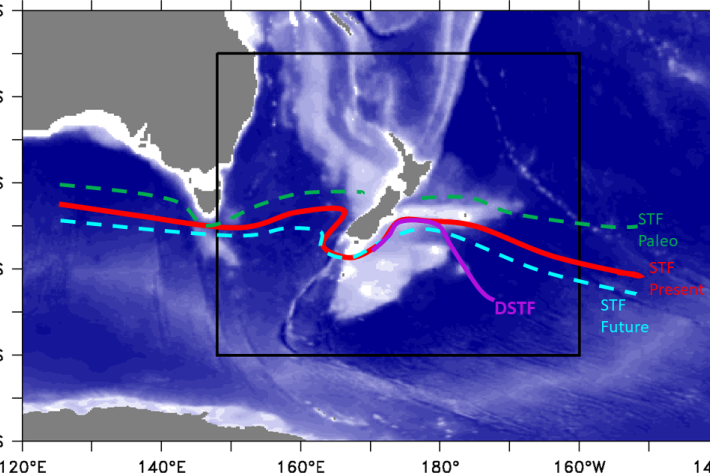
The Stormy Seas project
Research ProjectDoes climate change affect the position of the Subtropical Front around New Zealand? -

NIWA co-leads international expedition to study New Zealand’s largest earthquake fault
Media release21 November 2017An ambitious scientific expedition involving 30 scientists from around the world leaves Perth next week bound for the East Coast of the North Island. -

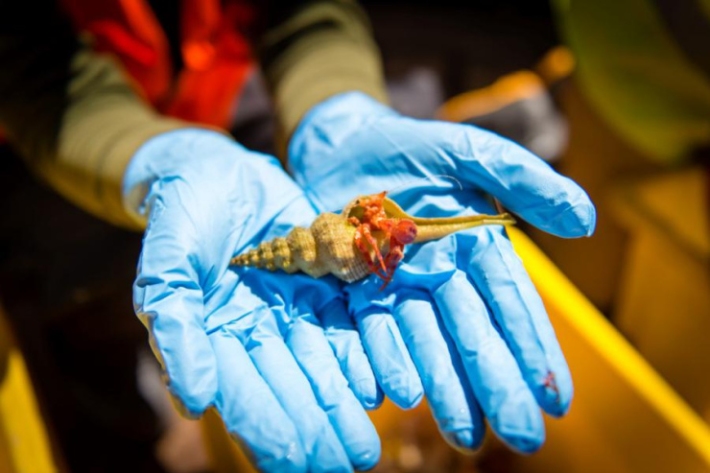
2017 - Kermadec trench biology
This voyage is the first of a series of expeditions exploring selected trenches of the Pacific Ocean, starting with the Kermadec trench. It will investigate carbon and nutrient cycling by microbial communities in trenches exposed to different rates of organic carbon supply. -
NIWA's Hotspot Watch for 16 November 2017
Hotspot16 November 2017A weekly update describing soil moisture across the country to help assess whether severely to extremely dry conditions are occurring or imminent. Regions experiencing these soil moisture deficits are deemed “hotspots”. Persistent hotspot regions have the potential to develop into drought. -

NIWA's Hotspot Watch for 9 November 2017
Hotspot09 November 2017A weekly update describing soil moisture across the country to help assess whether severely to extremely dry conditions are occurring or imminent. Regions experiencing these soil moisture deficits are deemed “hotspots”. Persistent hotspot regions have the potential to develop into drought. -
2016-2017 - Voyage summary
VoyageRV Tangaroa Summary Voyages 2016/17
1 July 2016 to 30 June 2017 -

Winters much shorter than they once were, says NIWA
Media release08 November 2017New Zealand winters are a month shorter than they were 80 years ago, NIWA scientists say.“This is a consequence of rising temperatures around the globe, and such trends in colder temperatures and frosts will influence the life cycle of plants and animals” - Dr Brett Mullan. -

Machine learning ecosystem models
Unlike other ecosystem models, machine learning is built solely from the information it is presented.