PDF of this article (522 KB)

Janet Bradford-Grieve Stuart Hanchet
By increasing our knowledge of food webs we are learning more about the resilience of marine and freshwater ecosystems and the effects of fishing on the relationships between species.

Anyone involved in fisheries is required by the 1996 Fisheries Act to maintain the number of associated or dependent species above a level that ensures their long-term viability, and to maintain the biodiversity of the aquatic environment. In addition, it is becoming clear that the effects of fishing on ecosystems can have significant impacts on fisheries themselves. For example, over-fishing might remove too many carnivores from the top of the food chain, which can change the whole structure of the ecosystem, leading to an increase in phytoplankton and plankton-eating fish, and a decline in zooplankton. Thus, maintaining a balance between fish and mammalian predators is very important for sustaining viable marine ecosystems.
As an example, disturbance of the food web is a likely cause of the non-recovery of cod stocks in eastern Canada. The fishery collapsed because of over-fishing, but predation by harp seals may be preventing the cod population from recovering. In other cases, fishing may have lead to an increase in non-commercial fish populations and this has possibly occurred on the Chatham Rise.
Increasingly, managers of marine ecosystems in New Zealand need to consider the interdependence of species and any adverse effects of fisheries and aquaculture activities. Understanding the links within the food web can help.
An easy-to-use model, Ecopath with Ecosim (EwE), has been available since the mid-1990s and provides a framework for assessing these links. Examples of the model’s use overseas include:
- an assessment of whether a coastal embayment had enough nutrients to allow for further scallop culturing without negatively impacting on other local fisheries;
- investigations into fisheries management options;
- determining why particular fish stocks are not recovering.
In New Zealand we have good fisheries statistics and fish biomass estimates, so we can now construct models for many areas. We chose to study the Southern Plateau because it is important to fisheries, it is a relatively enclosed system, and we have a large amount of data available on its ecosystem.


The Southern Plateau ecosystem
The Southern Plateau covers about 434,000 km2 and includes the Campbell Plateau, the Bounty Plateau, Pukaki Rise, Campbell Rise, and the Auckland Island Shelf. The Subantarctic Water on the plateau is bounded by the Southland Front to the northwest , and separated from less saline circumpolar flows in the Southwest Pacific Basin by the Subantarctic Front around its southern and eastern flanks. Thus we regard the Southern Plateau as a closed system.
Subantarctic water tends to have low phytoplankton biomass and production and one reason for this is the very low levels of dissolved iron in the water. This iron-limitation causes very small forms to dominate the phytoplankton. The food web in the Southern Plateau is therefore long because the tiny phytoplankton has to be “repackaged” by single-celled protozoa into food particles big enough for the larger zooplankton to eat. The length of the food web suggests that only a small fraction of the low phytoplankton production reaches the large carnivores.
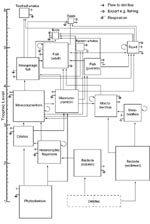
We simulated the Southern Plateau food web using the EwE model, based on the framework shown on the right. For all ecosystem components (boxes) we entered biomass, the ratio of food consumption and production to biomass, and diet. The model also took account of fish catches, incidental bycatch, and discards. Our aim was to identify and quantify the parts of the oceanic food web that support the birds, mammals and fish of the Southern Plateau and evaluate the effect on top predators (including birds) of removing fish and squid.
What does the model show?
The most striking characteristic of the Southern Plateau system is its very low total biomass (6.2 gC/m2) and total throughput (1,128 gC/m2 per year) compared with other systems. For example, the total biomass of a very productive bay in Chile is 235 gC/m2 and total throughput is 20,835 gC/m2 per year. However, the transfer of material through the Southern Plateau system is extremely efficient compared with other regions – the opposite of what we expected.
We estimate that there are about 0.5 million tonnes of mesopelagic fish and almost 2 million tonnes of macrozooplankton in the Southern Plateau. Most of the plateau’s biomass and total production occurs in the pelagic system.
Fisheries form the biggest “predator” of adult fish, taking 32% of total adult fish production.
The model suggests what might happen to a species if the biomass of another species is increased. For example, if phytoplankton increases then the biomass of nearly all other species also increases. An increase in fish biomass has positive effects for the fishery but negative effects on birds and seals that compete with fish for food. This is especially the case when fishing activity is increased: birds and seals are incidentally caught in the fishery but also compete with it for food.
We could not describe the interactions between individual fish species at higher levels of the food web because of a lack of data on food requirements and growth, so we cannot be sure that, for example, birds and seals are directly competing with the fishery for food. If we could describe these interactions in more detail it would help to address some of the interdependence issues in the 1996 Fisheries Act.
Implications for fisheries management
- The Southern Plateau has low primary production and annual changes in this production can have large flow-on effects to the fish species and fisheries operating in this area. For example, we know that a large and variable number of hoki on the Southern Plateau do not go to spawn each year and this may be a result of changes in primary production over the Plateau.
- There is potential competition with the fishery from other large predators.
Future studies
To improve the model and study the effects of fishing on the ecosystem more fully we need more information on:
- production and consumption to biomass ratios for New Zealand’s major fish species,
- fish and top predator diets,
- the biomass of mesopelagic fish and macrozooplankton,
- whale biomass, migration habits, and feeding patterns,
- improved estimates of primary production.
Teachers: this article can be used for Biology L7 A.O. 7.3b. See other curriculum connections at www.niwa.co.nz/pubs/wa/resources
Janet Bradford-Grieve is based at NIWA in Wellington and Stuart Hanchet is at NIWA in Nelson.
Further reading
Daskalov, G.M. (2002). Overfishing drives a trophic cascade in the Black Sea. Marine Ecology Progress Series 225: 53–63.
Bundy, A. (2001). Fishing on ecosystems: the interplay of fishing and predation in New Foundland-Labrador. Canadian Journal of Fisheries Science 58: 1153–1167.
Gabriel, W.L. (1992). Persistence of demersal fish assemblages between Cape Hatteras and Nova Scotia, Northwest Atlantic. Journal of Northwest Atlantic Fisheries Science 14: 29–46.
Wolff, M. (1994). A trophic model for Tongoy Bay – a system exposed to suspended scallop culture (Northern Chile). Journal of Experimental Marine Biology and Ecology 182: 149–168.
Some oceanographic & fisheries terms
Biomass: the amount of a group of organisms present in the system at any one time, expressed as the weight of carbon per unit area of water column or as weight per unit volume of water.
Macrozooplankton: larger planktonic forms such as krill or shrimps.
Mesopelagic: living away from the sunlit sea surface at about 500–1000 m depth; these species may rise into surface waters at night.
Pelagic: floating or swimming freely in the ocean and not connected with the sea floor.
Subantarctic Water: waters south of the Subtropical Front, which are cooler and have a lower salinity than Subtropical Waters to the north.
Total throughput: the sum of total consumption + total export + total respiration + total flows to detritus.
