PDF of this article (923 KB)

Niall Broekhuizen John Oldman
Individual cells can differ from each other. This could be important in attempts to predict how populations of phytoplankton might respond to changes in the ocean.


We all recognise that no two people – except, perhaps, identical twins – are exactly the same. Most people differ in the way they look, think and behave, partly because of genetic differences but also as a result of differing past experiences. Though much less obvious, such between-individual variability is also seen in simple micro-organisms. For example, as a result of differing histories, neighbouring individual phytoplankton cells (single-celled, floating plants) may have differing quantities of stored nutrients.
Nutrient storage capacity is especially important for phytoplankton during the summer, when sunshine warms the surface of the ocean and causes it to stratify. In the warm, well-lit, upper layer, phytoplankton grow rapidly. Soon, most inorganic nutrients in the surface layer are used up and phytoplankton growth slows dramatically. In this situation, phytoplankton that can swim have an advantage: they can move down into the deep layer where there are still plenty of nutrients. Here, they can re-stock with nutrients before returning to the surface and resuming photosynthesis.
At any given time individual members of the population will be spread all through the upper ocean. Cells will be carrying varying amounts of nutrients, growing at different rates, and moving at different speeds and in different directions. How might this affect any predictions we make about the responses of phytoplankton to changes in the marine environment?
Modelling phytoplankton
Scientists use models to answer questions about how ecosystems might respond to changes. For example, what will happen to natural phytoplankton populations in the region around a new shellfish farm? Unfortunately, between-cell differences make describing phytoplankon dynamics quite difficult. An important question is: “can we get adequate results if we assume all the individuals are identical, or must we explicitly consider each individual (or, at least, a representative subsample of these) in order to yield good predictions?”
There are two approaches to modelling phytoplankton dynamics. In the so-called Eulerian approach the area we want to look at is divided into a grid. For each box in the grid, the model considers averaged information about the phytoplankton population (for example, cells per cubic metre, average cell weight and nutrient content). Currents and swimming/sinking of cells cause material to move between adjacent boxes. As soon as cells move from one box to another, the model assumes that all the cells in each box instantaneously adopt the same (new) average characteristics. This means that this kind of model cannot easily reproduce the variability that may exist amongst phytoplankton cells when the ocean is stratified in summer.
In contrast, the Lagrangian Ensemble approach lumps individuals that share similar histories (and are, therefore, in similar physiological states). This is done by explicitly tracking many “particles”. Each particle represents numerous phytoplankton cells, all of which are in the same physiological state because they share similar histories. We derive the average state of the population within a spatial box from all the particles in it at the time.
Both approaches can model variability on a large (greater than box-sized) scale. The Lagrangian approach can also keep a record of fine-spatial-scale variability within each box.
Theoretically, Lagrangian models should be more accurate than Eulerian models if nearby individuals are very different from one another. But because the Lagrangian model carries much more information than the Eulerian approach, it needs much more computer time to run the model. This is quite a big disadvantage. It has meant that Lagrangian Ensemble models have not yet come into common use, and we still do not know whether simulation results from this theoretically superior approach really are more accurate.
Comparing models: an example from north-east New Zealand
Over the past few years at NIWA we have developed some theories about how prevailing wind conditions influence phytoplankton growth on the continental shelf to the north- east of New Zealand. These were outlined in Water & Atmosphere 8(2): 15–18. In summary, when winds blow from the north-west (spring and El Niño years), surface waters are driven offshore and replaced by nutrient-rich waters drawn up from the deep ocean. This situation favours fast-growing phytoplankton (e.g., diatoms). When south-east winds blow (summer, and La Niña years), the circulation pattern is reversed. The surface waters become depleted of nutrients and slow-growing phytoplankton (e.g., dinoflagellates) are favoured.
Our data from these contrasting situations provided a good opportunity to compare Eulerian and Lagrangian modelling approaches. If the differences are small, then we may safely use the simpler Eulerian approach in further investigations – with the associated savings in computer time.
We therefore made two simulations. In the first, we used the Lagrangian Ensemble model. In the second, we removed all the small-scale variability and forced the Lagrangian Ensemble model to behave like a Eulerian model.
Does the complex model perform better?
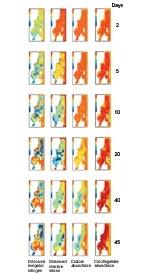
Using the Langrangian approach, we modelled the spatial distribution of nutrient (nitrogen (N) and silicon (Si)), diatom and dinoflagellate abundance over 45 days in late spring (Image 1, above). As the simulation progresses, surface-layer silicon and nitrogen both start to become depleted over much of the area, except where deep, nutrient-rich waters come to the surface. Later on, nitrogen concentrations recover over quite large areas, but silicon concentrations do not. The difference between silicon and nitrogen reflects the fact that nitrogen in dead phytoplankton cells is converted back into inorganic nitrogen much more rapidly than is silicon.
Initially, diatoms and dinoflagellates are approximately equally abundant. Later on, dinoflagellates become increasingly dominant because (1) they are motile (meaning they can move on their own) and can access nitrogen in deeper waters; (2) dinoflagellates don’t need silicon, which limits diatom growth.
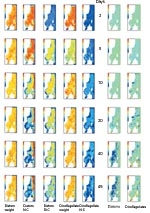
To look at between-cell variability we examined the variability of N and Si in the cells (as a proportion of total body mass). Low variability suggests that all cells are growing at similar rates; high variability indicates a wider range of growth rates. The results are shown in the five columns on the far left.
For diatoms, the ratios tend to be most variable where there are steep horizontal or vertical concentration gradients of inorganic nutrients. This is because, here, cells from nutrient-rich and nutrient-poor areas are most likely to be mixed. In dinoflagellates the cellular-N content is less variable than in diatoms because their motility allows them to regulate nutrient stores.
Low variability of cell weight suggests that the cells have been growing for a similar period since last dividing. Both diatoms and dinoflagellates showed moderately variable cell weights – indicating that the growth of individual cells is not synchronised with that of other cells.
So, the data from the Lagrangian model suggests that, in some places and at some times, both diatoms and dinoflagellates show substantial between-individual variability. This implies that the Lagrangian and Eulerian versions of our model might produce different results.
The differences are confirmed by the comparison shown (Image 3, above) in the two right-hand columns. Diatom abundances predicted by the Eulerian model tend to drop below those predicted by the Lagrangian model. In some places the Eulerian model predicts abundances only 20% of those predicted by the Lagrangian. For dinoflagellates, the situation is less clear-cut. The Eulerian model still tends to predict lower population abundances than the Lagrangian model, but the under-estimates are less extreme and in a few areas Eulerian estimates are higher.
Nevertheless, these simulations suggest that cells in the same phytoplankton population can be in substantially different physiological states and their growth rates can be quite different. Models which fail to take proper account of this run the risk of producing seriously misleading results.
Niall Broekhuizen and John Oldman are based at NIWA in Hamilton.
Oceanic terms
Diatoms: fast-growing, non-swimming phytoplankton with a cell wall made of silicon. They tend to sink to the sea floor unless there is enough turbulence to continually return them to the surface.
Dinoflagellates: slow-growing phytoplankton with “tails” which they use for swimming. This enables them to regulate their depth when the water stratifies, but not in very turbulent conditions.
Stratify: form layers; in summer the sun warms the sea surface and, if no wind mixes it, then a warm layer floats on top of a cooler, denser layer.
