PDF of this article (574 KB)

Roy Walters
A new, widely applicable computer model may improve our understanding of sediment accumulation in estuaries.


Did you ever ask yourself why rivers sometimes look dirty, and where all the mud in an estuary comes from?
Sediment is picked up by a river all along its course, from the river bed and banks, and from land around the river when it is in flood. Especially during floods the sediment can span a large range of sizes, shapes, densities, and chemical properties, and there can be huge amounts of it. It would be very useful to be able to predict where various components of the sediment might end up. Unfortunately, so many factors affect sediment erosion, transport and deposition that describing them is almost impossible.
One way to get an idea of how and where rivers erode and deposit sediment is to take measurements in a real situation. This is known as an empirical approach. However, this approach is quite limited as the measurements apply to only one situation.
To get the bigger picture, we need to use numerical models, which can be applied to the entire river and floodplain. We can then apply the models to real situations – both simple and complex – to check their accuracy.
The checking process allows us to use the model to develop better understanding of a problem. Comparing the output from a model with the results we expect (from measurements) can very clearly tell what is known and what is not known. When sufficient understanding is built up, the model can become a forecasting tool.
A general model for New Zealand
At NIWA, we are developing a cohesive-sediment-transport model to help predict the effects of catchment changes on sediment inputs to estuaries. Our aim is to design a system applicable to all types of New Zealand rivers, from gravel-bed rivers to muddy-bottomed lowland streams. Cohesive sediment refers to sediment that contains a lot of fine material and therefore sticks together.
The new model is based on mathematical equations that describe the conservation of mass and momentum (i.e., Newton’s laws). The equations use data that are averaged over both time and space. This means that the calculations do not need to include small-scale events, such as fluctuations in water turbulence, and small-scale features such as sizes of individual particles.
The system is organised in two parts. One model deals with the hydrodynamics (the forces caused by water flows) and the other with sediment transport. Splitting the model this way allows for more efficient computing, and makes it easier to develop and improve relationships between the two parts. For an example of output from a related model, see “A computer model of an estuary” in Water & Atmosphere 10(2): 19.
There are still many aspects of the model that we do not understand well enough, especially in the sediment transport component. Therefore, the project includes field experiments to investigate some of the relationships (see “Sorting out sediment transport” below).
How accurate is the model?
To test how well the model works, we have run trials to check parts of the output. Two examples follow.
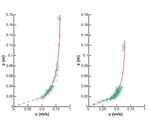
- In an experiment to determine how water velocities respond to very rough bed-sediments, we used an outdoor flume with an artificial bed made of hemispheres. Theory tells us that the flow over a river bed is made up of three layers (shown below): a layer up to just over the top of the sediment particles, where flow velocity is low, a layer where velocity increases rapidly, and an outer layer with almost constant velocity. So, knowing the shape and height of the bottom layer, can we predict the flow in the upper two layers? The graphs below show that our measurements of flow velocity matched well with the velocities predicted by the model, using a substrate layer 21 mm thick. The changeover from the bottom layer (dotted line) to the second one (solid line) shows up clearly. We found the same close match in predicted and measured velocities over a range of different substrate heights.
- To determine the velocities required to keep sediment in suspension, we used a test case for sediment transport taken from the scientific literature. The test case describes a relationship between water velocity (uniform horizontal flow) and suspended-sediment concentration when sediment is diffusing upwards and settling down at exactly the same rate. We found that our model could predict exactly the results as described in the test case. From results so far, this model shows promise in meeting the design criteria of reasonable accuracy, efficiency, and robustness. The double-averaging procedure (over time and space) enables an adequate description of what happens to water and sediment close to the bed, but could be expanded to various levels of detail that depend on the problem under consideration. For instance, the effects of small features – such as mussel strings or bed ripples in an estuary, or vegetation in a river – could be assessed. The next stage of model development is to test the potential for modelling these more detailed bed processes.
Roy Walters is based at NIWA in Christchurch.
This work was undertaken in the project “Sediment transport in lowland streams and its modelling”, which was a part of the FRST-funded research programme “Effects of Sediments on Estuarine and Coastal Ecosystems” (contract no. C01X0024).
Acknowledgements
I gratefully acknowledge the assistance of the other project members, Dr V. Nikora and Dr J. Aberle.

Sorting out sediment transport
To specify the relationships for the sediment model, the project team has designed a series of field measurements and experiments. The aim is to obtain information about the vertical distribution of turbulence properties and sediment concentrations, and their links to erosion, transport and deposition. This information supports development of the sediment model.
We are using a wide variety of instruments, including:
- acoustic Doppler velocity meters (ADV) to measure flow rates;
- velocity profilers (ADP) to measure vertical profiles of velocity;
- echo-sounders to measure erosion depth;
- optical backscatter sensors (OBS) to measure sediment concentration;
- an in situ sediment flume specially designed and built within our project to study cohesive sediment dynamics.
The NIWA in situ flume is a submersible, straight benthic flume with an open-bottomed working area for the investigation of the bed response to erosional forces. The flume is placed directly on the river or sea bed and water is sucked through the flume with a motor and propeller. Flow velocity can be controlled and is measured with a current meter. The erosion process is monitored with two optical backscatter (OBS-3) sensors and five photodetectors. Experiments with the NIWA in situ flume have produced relationships for the critical bed-shear stress for erosion and the erosion rate, for inclusion in the model.
Further reading
Aberle, J.; Nikora, V.; McLean, S.; Doscher, C.; McEwan, I.; Green, M.; Goring, D.; Walsh, J. (2003). A straight benthic flow-through flume for in situ measurement of cohesive sediment dynamics. Journal of Hydraulic Engineering 129(1): 63–67.
Senior, A.; Green, M. (2002). Assessing human impacts on estuaries: it’s a risky business. Water & Atmosphere 10(2): 18–19.
Stephens, S.; Green, M.; Pilditch, C. (2002). Bugs ’ n’ mud – a sticky problem. Water & Atmosphere 10(1): 14–15.
