-

'Eleven-station' series temperature data
Research ProjectTemperature trends from 1930s to present day -
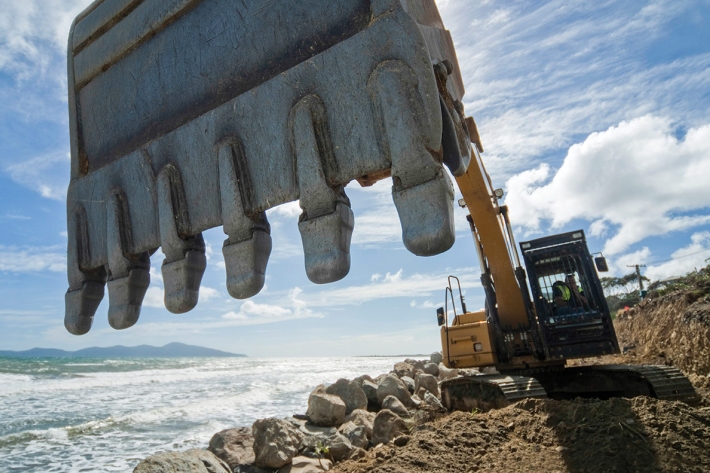
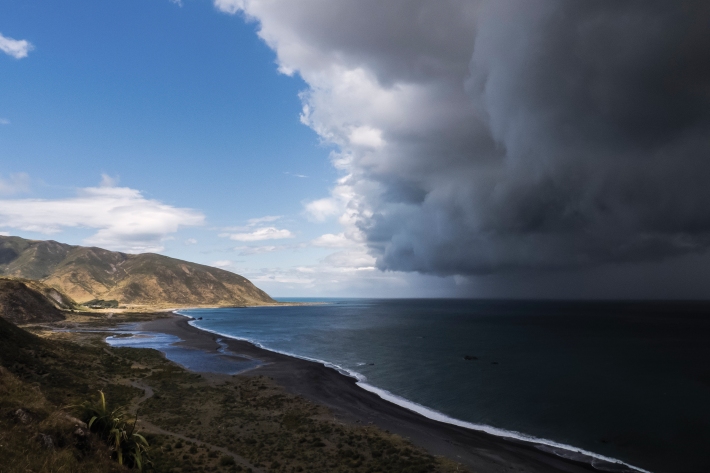
Shifting Sands – the end of a Kiwi dream
Feature story06 June 2017The Kiwi dream of owning a beachfront property with panoramic views of the ocean is under threat—and not just for financial reasons. -
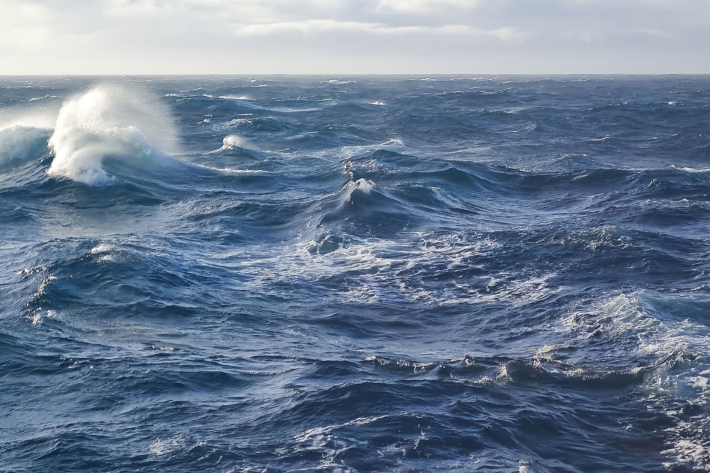
What is ocean acidification?
Education ResourceOcean acidification is the name given to the lowering of pH of the oceans as a result of increasing carbon dioxide (CO2) in the atmosphere. -
Scholarships
Scholarships available to both Masters and undergraduate students in the fields of fisheries science and marine biology. -
Daily climate maps
These climate maps are updated daily and are based on data from our National Climate Database. -
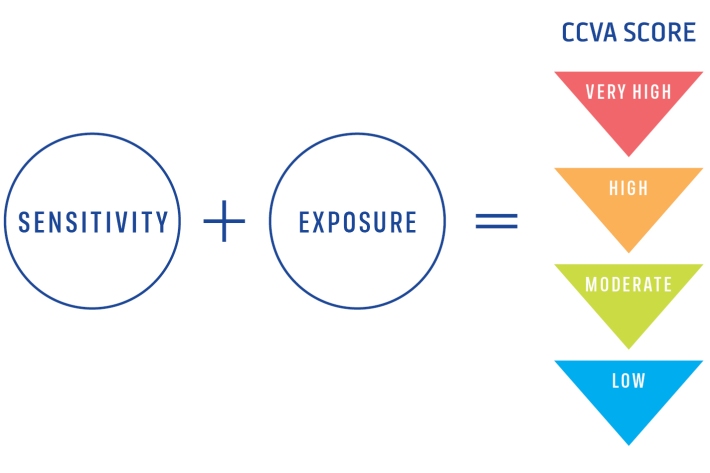
Climate Change Vulnerability Assessment (CCVA)
ServiceTo prepare for changes in climate, our freshwater and oceans decision-makers need information on species vulnerability to climate change. -
Special Climate Statement 2017-18 Summer
Sea surface temperatures in the southern Tasman Sea rose to exceptionally high levels in late 2017 and early 2018. These temperatures were far above any others previously observed at that time of year in the region, and extended west from New Zealand to Tasmania and mainland southeast Australia. -
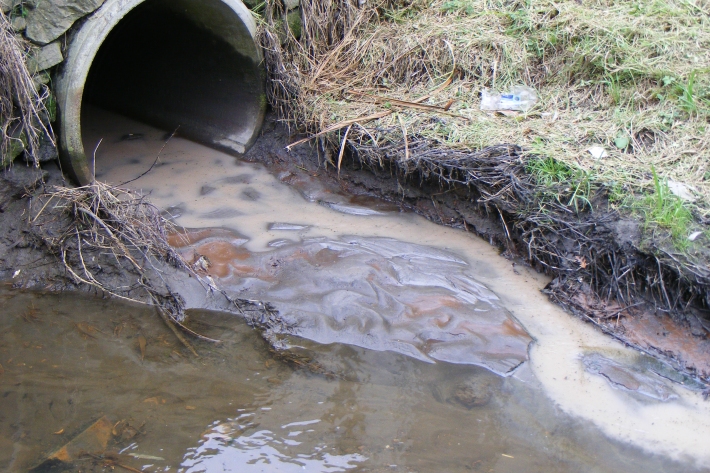
Instream barriers and altered water flow
Instream barriers and diversions alter the natural flow of rivers, streams, and lakes. -

Dry stock farming activities
Dry stock farms can cover large areas of hill-country grassland that may be steep and prone to erosion. -
Graphing with Microsoft Excel
How do I create a graph?
Using Microsoft® Excel is easy because the Chart Wizard does all the work for you!
Simply enter the data for your data table.
Highlight the cells you want to graph.
Click on the Chart Wizard icon on the Tool Bar.
Select the chart type you want to use and click Next.
Click Next to confirm the range of cells.
Give your graph a title, label x- and y-axis and click Next.
Click on the gridlines tab to remove or add gridlines.
Click Finish and graph is complete!
Help, my graph is too small!
When the chart wizard creates your graph it will probably be too smal -
NIWA staff profile: Nava Fedaeff
Feature story06 June 2017At the age of seven, NIWA’s youngest climate scientist, Nava Fedaeff, swapped sub-arctic Siberia for balmy Auckland – and her first job was to learn to swim.